4 Profile of the study area
The following sections present the essence of the work done to assess the cumulative effects of marine vessel activities on the valued components of the St. Lawrence and Saguenay Rivers selected for this pilot project, i.e. to form a profile of the study area. Specifically, the following sections detail the recommended approach to data collection and management, present the characterization of environmental stressors and valued components in the study area, and detail the assessment of valued component vulnerability to environmental stressors.
4.1 Data collection and management
4.1.1 Data collection
Since this pilot project did not aim to collect any new data, the profile presented is a monitoring of current knowledge allowing the characterization of marine vessel activities and valued components in the study area. The availability and accessibility of data has thus guided the work done. Data were collected in cooperation with the various collaborators involved in the project as well as with the collaboration and support of Transport Canada and the members of the project led by the St. Lawrence Action Plan project.
Data collection began by sending a list to various experts and collaborators involved in the project for annotation. This list consisted of subcategories of environmental stressors and valued components. Participants were asked to identify any known databases that could be used to characterize the stressors and valued components within the study area, and to identify any other subcategories or databases deemed relevant to the project. We then collated the comments and suggestions and began the process of collecting data relevant to the cumulative effects assessment.
Where possible, priority was given to the open and accessible data from federal and provincial data sharing platforms Open Government and Données Québec, as well as resources available through the St. Lawrence Global Observatory (SLGO). In this regard, searches were conducted on these platforms to identify relevant data that was not included in the previously shared list. By prioritizing open data, it will be easier to reproduce and update the assessment conducted by this pilot project. Appendix 1 presents all the data that was considered for the assessment. In that appendix, the data are described and the data selected for the assessment are identified. Data that were not selected were retained to document all the data that was explored for the assessment. The data that were not included were left out because they were covered by other selected databases or because they did not meet a specific assessment objective.
Particular attention was also paid to the knowledge of experts in their respective fields, as well as that of the various project partners. We thus were in direct discussion with resource persons in order to revise the various sections of the profile of the study area characterizing the environmental stressors and the valued components. The resource persons who contributed to the revision of these sections are specifically thanked at the beginning of the sections to which they contributed. A list of resource persons/organizations for this project is available in Appendix 2.
Close cooperation with First Nations was also an important component of the project for ensuring that we have the benefit of Indigenous knowledge and First Nations concerns related to the study area. We were thus in contact with representatives of the participating First Nations in order to obtain a spatial characterization of areas of cultural, heritage and archeological interest. See the section on areas of cultural, heritage and archeological interest for more details.
4.1.2 Data management and reproducibility
The aim of database management is to ensure the transparency of the cumulative effects assessments and that they are reproducible. Our approach is based on the principles FAIR (Findable, Accessible, Interoperable, Reusable), the purpose of which are to ensure that the data used is discoverable, accessible, interoperable and reusable. We therefore use programming tools, in particular the language R2. There are a number of advantages to using programming tools such as ArcGIS3. They offer great flexibility, enabling us to very quickly integrate changes or new considerations without having to redo a number of steps in a complex process. This flexibility is not limited to analysis, since all steps of a project, from the integration of raw data to the production of reports, can be integrated and easily modified. It is then an easy matter to integrate comments or new recommendations arising from engagement processes, for example.
We also used GitHub4, a version control tool for the documentation, quality control, and development/change history of programming elements relevant to the entire project. We created an organization named CumulativeNavigationEffects. A listing of all reports written and seminars offered during the pilot project is available here. A public repository entitled ceanav serves as the research compendium and is the core of the assessment; a research compendium is a collection of all parts of a research project including text, figures, data, and code that ensures reproducibility of the study. A detailed description of the assessment’s research compendium structure is available in Appendix 3 and on the GitHub repository webpage ceanav.
While not including the data directly, the assessment’s research compendium contains all the resources making it possible to access and transform the raw data. It also contains the code allowing us to characterize the environmental stressors and valued components, and to create the analyses, figures, tables and the final report. Only sensitive data for which confidentiality agreements have been signed remain inaccessible; however, these are catalogued in the report and accompanying documents so that a user or reader can know the type and source of data used in the analyses, as well as the resource persons to contact to obtain more information about the data used. The data incorporated into the study grid enabling us to conduct the cumulative effects assessment are open and available through the pilot project’s main repository ceanav; we are also working with SLGO to make them available on their portal.
The databases considered for the assessment are identified by a unique identifier in the form #### for each database considered: the unique identifier is available in Appendix 1. For example, the database 0001 corresponds to an eelgrass inventory (Zostera marina) for James Bay, Baie des Chaleurs, the Estuary and the Gulf of St. Lawrence (Pêches et Océans Canada, 2009). These unique identifiers are used to identify, directly on the figures, the databases that were used to characterize the categories of environmental stressors and valued components presented in sections 4.2 and 4.3; the list of unique identifiers can be viewed in the bottom right margin of each figure. In addition, all data and metadata included in the assessment’s research compendium use these unique identifiers to reference the databases considered. In total, 88 databases were considered for the assessment and are accessible through the research compendium; of these, 64 were used to conduct the cumulative effects assessment of marine vessel activities on the valued components selected. See Appendix 1 for more details on these databases. As with for the data, the various organizations and experts consulted for this project, or custodians of the open databases used, are identified by a unique identifier of the form #### available in Appendix 2.
4.2 Environmental stressors
Characterization of environmental stressors in the study area resulted in the description of 7 stressors divided into 26 subcategories that are considered for the cumulative effects assessment of marine vessel activities (Table 4.1). The following sections present the data, methods, and results of the data integration allowing us to characterize the environmental stressors in the study area.
| Environmental stressors | Subcategories | Description | Source |
|---|---|---|---|
| Anchorage | Commercial anchorage sites | Distribution of anchorage sites for commercial shipping | 0070, 0071 |
| Accidental spills | Hydrocarbons | Hydrocarbon spills, e.g. fuel, diesel, oil, propane, hydraulic oil, etc. | 0016 |
| Others | Spills other than hydrocarbons, e.g. ballast water, waste, bilge water, coal, organic matter, etc. | 0016 | |
| Unknown content | Spills content of which is unknown | 0016 | |
| Dredging | Dredging sites | Maintenance dredging sites, i.e. more or less regular dredging of the waterway in order to maintain safe conditions for navigation. | 0018, 0019, 0046, 0048, 0052, 0069 |
| Disposal sites | Disposal sites in the aquatic or marine environment for sediments dredged during maintenance or capitalization dredging operations. | 0018, 0019, 0046, 0048, 0069 | |
| Planned capitalization dredging | Planned capitalization dredging sites, i.e. dredging to deepen and widen the waterway. | 0049, 0050 | |
| Shipwreck | Recorded shipwreck sites | Grounded or submerged wrecks of commercial and recreational vessels. | 0062 |
| Shipping | Cargo | Marine traffic of commercial vessels transporting goods in various forms. | 0020, 0021 |
| Containers | Marine traffic of commercial vessels transporting goods exclusively in transport containers. | 0020, 0021 | |
| Dry bulk | Marine traffic of commercial vessels transporting goods in bulk, i.e. grain and coal. | 0020, 0021 | |
| Government / research | Marine traffic of government and research vessels, such as military craft, Coast Guard patrol vessels and scientific research vessels. | 0020, 0021 | |
| Marine mammals observation | Marine mammal observation activities at sea on craft with a class 1 permit. | 0028 | |
| Passenger / ferry / ro-ro | Marine traffic of passenger transportation vessels and ferries carrying passengers and/or vehicles. | 0020, 0021 | |
| Pleasure vessels | Recreational vessel marine traffic. | 0020, 0021 | |
| Special ships | Marine traffic of miscellaneous vessels such as dredgers, cable layers, platforms, drilling vessels, etc. | 0020, 0021 | |
| Tanker | Marine traffic of vessels transporting petroleum products in bulk | 0020, 0021 | |
| Tugboat / port | Marine traffic of tugboats. | 0020, 0021 | |
| Port shipping | Navigation activities that take place near port facilities such as ports and marinas. | 0041, 0047 | |
| Commercial fishing | Demersal, destructive, high-bycatch | Commercial fishing activities using demersal fishing gear that may damage habitats or substrate, e.g. trawling and dragging. | 0033, 0034, 0035 |
| Demersal, non-destructive, low-bycatch | Commercial fishing activities using demersal fishing gear with little or no bycatch and not causing habitat modification, e.g., deep-sea fishing. | 0033, 0034, 0035 | |
| Demersal, non-destructive, high-bycatch | Commercial fishing activities using demersal fishing gear with high bycatch and not causing habitat modification, e.g., trap and seine. | 0033, 0034, 0035 | |
| Pelagic, low-bycatch | Commercial fishing activities using pelagic fishing gear with little or no bycatch and not causing habitat modification, e.g., line fishing, purse seine. | 0033, 0034, 0035 | |
| Pelagic, high-bycatch | Commercial fishing activities using pelagic fishing gear with high bycatch and not causing habitat modification, e.g., gillnet and longline. | 0033, 0034, 0035 | |
| Commercial fisheries in fluvial sector | Commercial fisheries activities using fyke nets during the spring, the summer and the fall, measured as the mean number of fyke nets deployed par day in segments dividing the fluvial sector of the study area. | 0083 | |
| Marine pollution | Marine pollution | Pollution related to navigation activities such as commercial navigation and fishing. Associated stressors may be operational discharges, waste, debris, ballast water, etc. | 0018, 0019, 0020, 0021, 0028, 0033, 0034, 0035, 0041, 0046, 0047, 0048, 0049, 0050, 0052, 0069, 0070, 0071, 0083 |
4.2.1 Anchorage
We thank the Canadian Coast Guard and Corinne Berthold for the discussions and support.
The unique identifiers given to the data presented in this section are: 0070, 0071. Refer to the following section and to Appendix 1 for more details on these data.
Anchorage sites were characterized through the integration of two databases from the Canadian Coast Guard (Garde côtière canadienne, 2022) and the Canadian Hydrographic Service (Service Hydrographique du Canada, 2020). The Canadian Coast Guard database provides the location of commercial anchorage sites from the mooring data sheets between Les Escoumins and Montreal (Garde côtière canadienne, 2022). Since this database does not cover the entire study area, we completed the characterization of anchorage sites using the Canadian Hydrographic Service database; this database provides the location of moorings and mooring areas in Canadian navigable waters (Service Hydrographique du Canada, 2020). We selected the moorings and mooring areas east of Les Escoumins in order to complete the profile of the study area. It is important to mention that the resulting data layer considers only commercial navigation and that anchorage sites for recreational boating are not represented.
A total of 101 sites were identified in the study area. To characterize the intensity of this environmental stressor, a 2 \(km\) buffer zone was drawn around each anchoring site. The number of anchorage sites intersecting each study grid cell was then assessed to obtain an assessment of the number of sites (\(n\)) per \(km^2\) with the potential to affect a cell (\(n\) sites * \(km^{-2}\)). This characterization allows us to obtain an assessment of the environmental risk associated with anchorage sites in each study grid cell by assuming that risks are higher when multiple anchorage sites are located close to each other. It is important to note that we are not characterizing the intensity of use of these sites by vessels here, but rather the presence of anchorage sites. Anchorage site use could be characterized in an updated version of this stressor; however, this work could not be completed as part of this report.
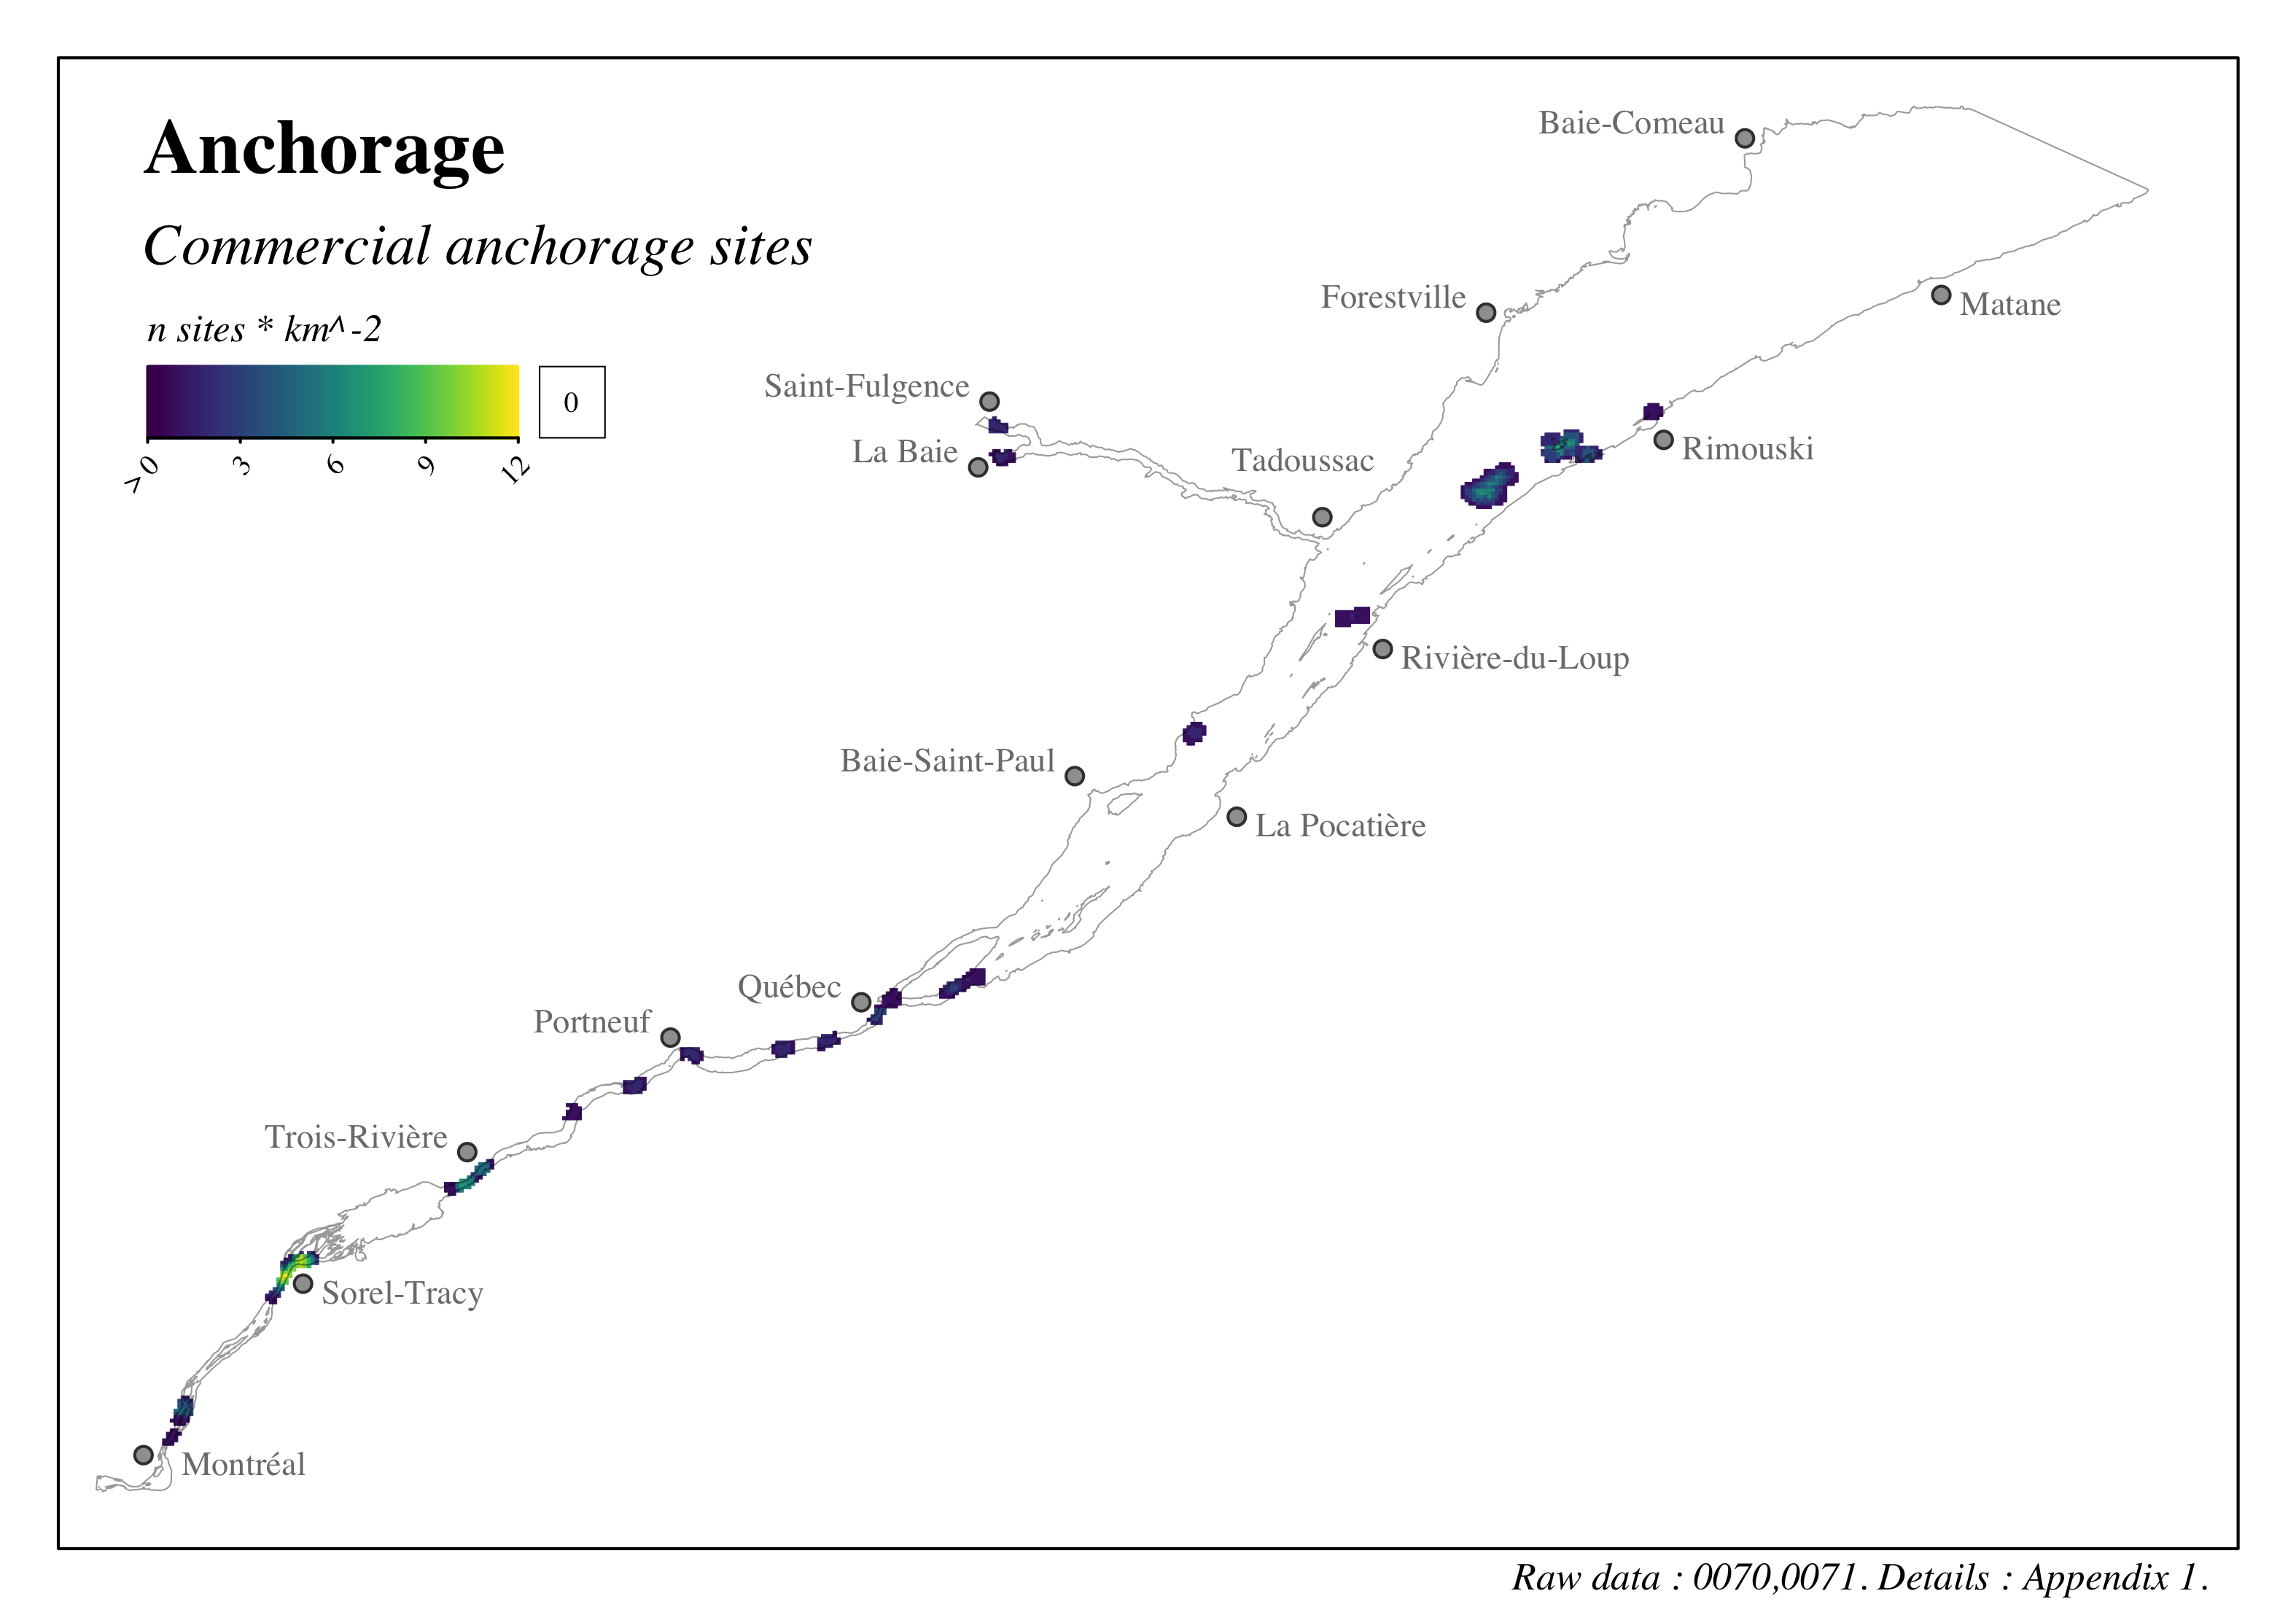
Figure 4.1: Distribution of anchorages for commercial shipping in the St. Lawrence and the Saguenay river.
4.2.2 Accidental spills
We thank Pierre Nellis at the Canadian Coast Guard for the discussions and support.
The unique identifier given to the data presented in this section is: 0016. Refer to the following section and to Appendix 1 for more details on these data.
Accidental spills were characterized using a marine spill incident inventory from the Canadian Coast Guard (Garde côtière canadienne, 2020). This inventory provides the location of accidental marine spills for the period 2016 to 2020. A total of 185 accidental spills were identified for the study area.
Each spill is characterized according to its content and grouped into three distinct groups: hydrocarbons (e.g. gasoline, diesel, propane), other (e.g. ballast water, wastewater, organic matter) and spills the content of which is unknown (Table 4.2). The spills are also categorized by the volume in litres of contaminant spilled (Table 4.3).
| Contaminant category | Subcategory | Number of spills |
|---|---|---|
| Hydrocarbons | Bunker C, Diesel fuel, Gasoline, Unknown hydrocarbon, Petcoke, Crude oil, Propane, Tar, Lubricating oil, Hydraulic oil, Motor oil, Bilge, BioSpec Hyd 32, Hydrox Bio 100, Lube oil, Biodegradable hydraulic oil, Liquid asphalt | 74 |
| Others | Hypochlorous acid, Ballast, Debris, Waste, Bilge water, Oily water, Wastewater, Milk, Organic matter, Iron ore, Calcium oxide (lime), Ammonium phosphate, Pollution, Sludge, Soot, Caustic soda, LAPIO oil, Hydraulic vegetable oil, Vegetable oil, Oily mixture, Coal | 20 |
| Unknown content | Unknown content | 34 |
| Categories of volumes spilled | Number of spills |
|---|---|
| 1 : 0 - 100 litres | 108 |
| 2 : 100 - 1000 litres | 14 |
| 3 : 1000 - 7000 litres | 0 |
| 4 : 100000 - 1000000 litres | 0 |
| NA : Volume unknown | 63 |
Since accidental spills have an effect that goes beyond the immediate location of the incidents due to the diffusion of the spill in the environment, the first step in characterizing the intensity of spills was to establish a potential zone of influence for each incident. We chose a passive diffusive model to establish the zone of influence and relative intensity of accidental spills in the study area (see Halpern et al., 2008).
The diffusion model establishes the zone of influence of the spills by creating concentric rings with a radius of 10 \(m\) centred on the incident site. An initial value equal to the category of the reported incident volume is assigned to the centre ring and represents the relative intensity of the incident on the environment. For example, an initial value of 2 was assigned to a spill of 0 to 100 litres (Table 4.3). As a precautionary measure, an initial value of 2 was also assigned to incidents the volume of which was unknown. A value is then successively assigned to the adjacent rings according to a decay function of 2% of the value of the previous ring, until a minimum threshold of 0.05% of the global maximum – 3 in our case – is reached. This approach assumes a linear decrease in the influence of the incidents on the environment up to a maximum radius of influence of about 3 \(km\) depending on the severity of the spill.
The intensity and spatial distribution of accidental spills in the study area was evaluated by distributing the relative intensity values modelled by the diffusive model within the 1 \(km^2\) study grid. For each concentric ring modelled, we multiplied the intensity value within each \(j\) of the study grid by the proportion of the ring area that intersects a \(j\) cell:
\[I_{spill,j} = \sum_{k=1}^{n_j} I_{tot, k} * \frac{A_{j,k}}{A_{tot,k}}\]
where \(j\) is a study grid cell, \(k\) is a modelled concentric ring, \(I_{tot}\) is the predicted relative intensity within the \(k\) ring, \(A\) is the area of the \(k\) concentric ring that intersects a \(j\) cell, and \(A_{tot}\) is the total area of the \(k\) concentric ring. Since the intensity values correspond to volume categories rather than a continuous quantity, the results of this diffusive model are relative and unitless.
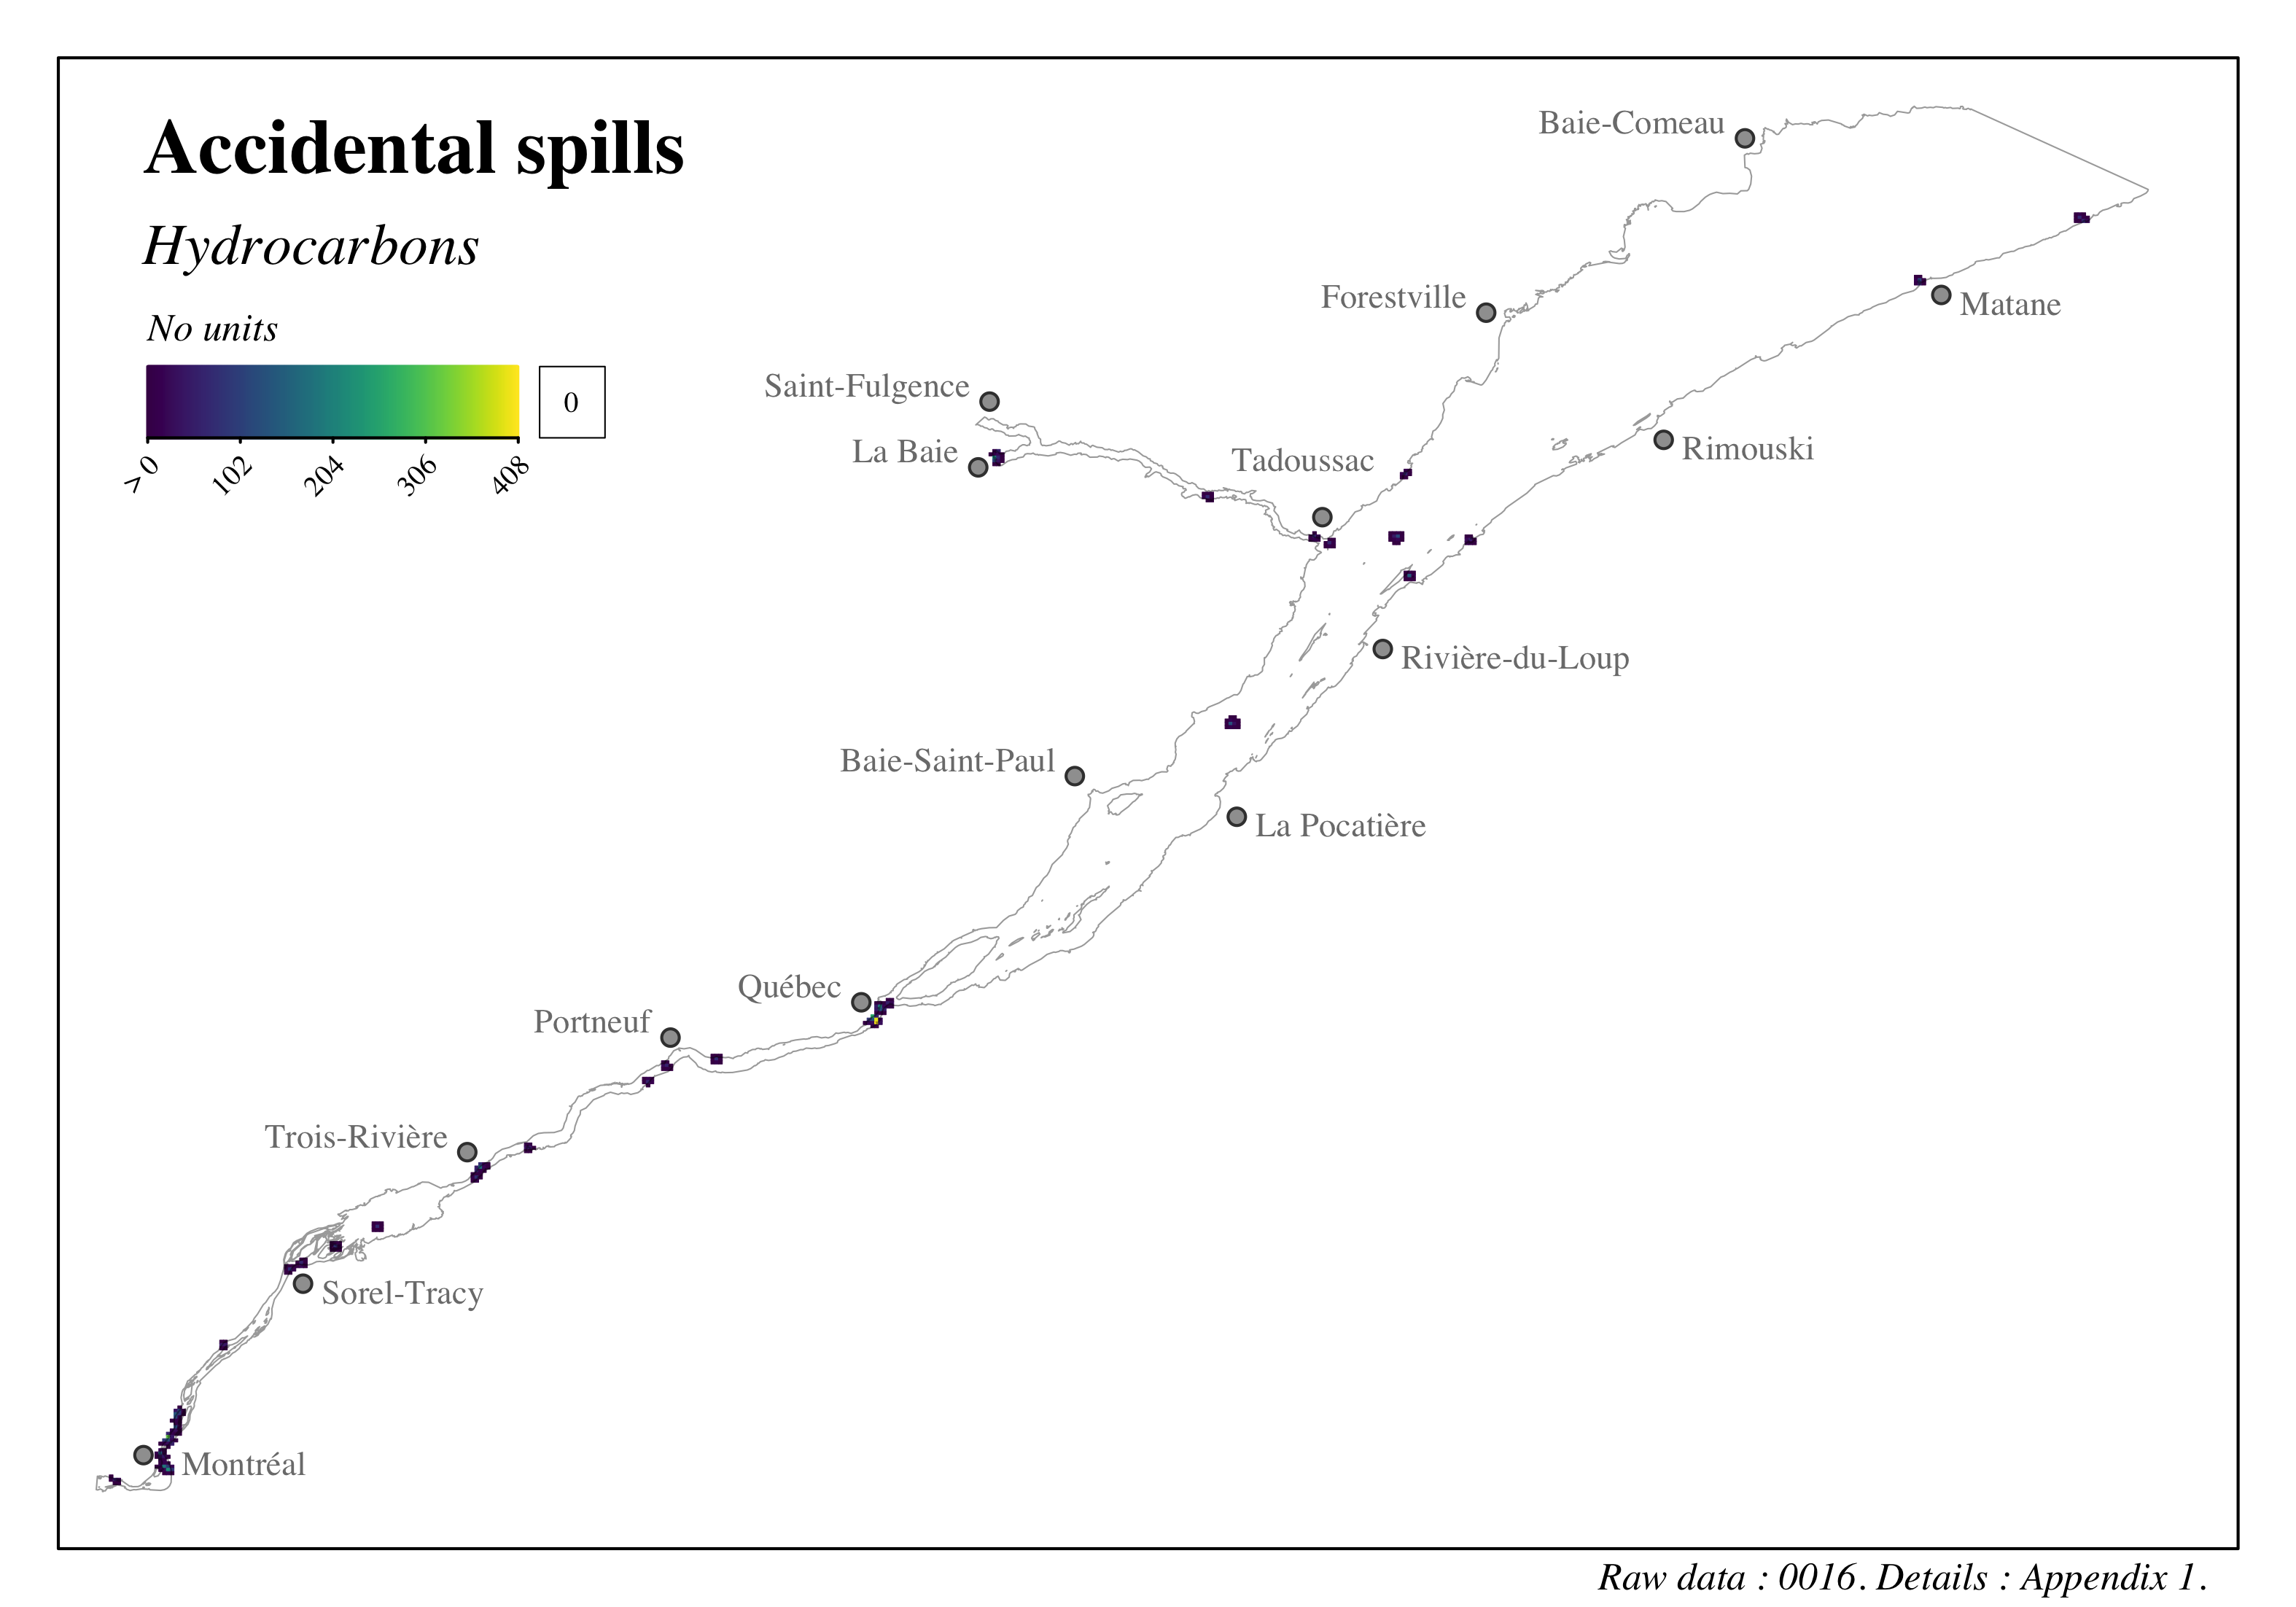
Figure 4.2: Distribution and intensity of accidental spills in the St. Lawrence and the Saguenay river - Hydrocarbons
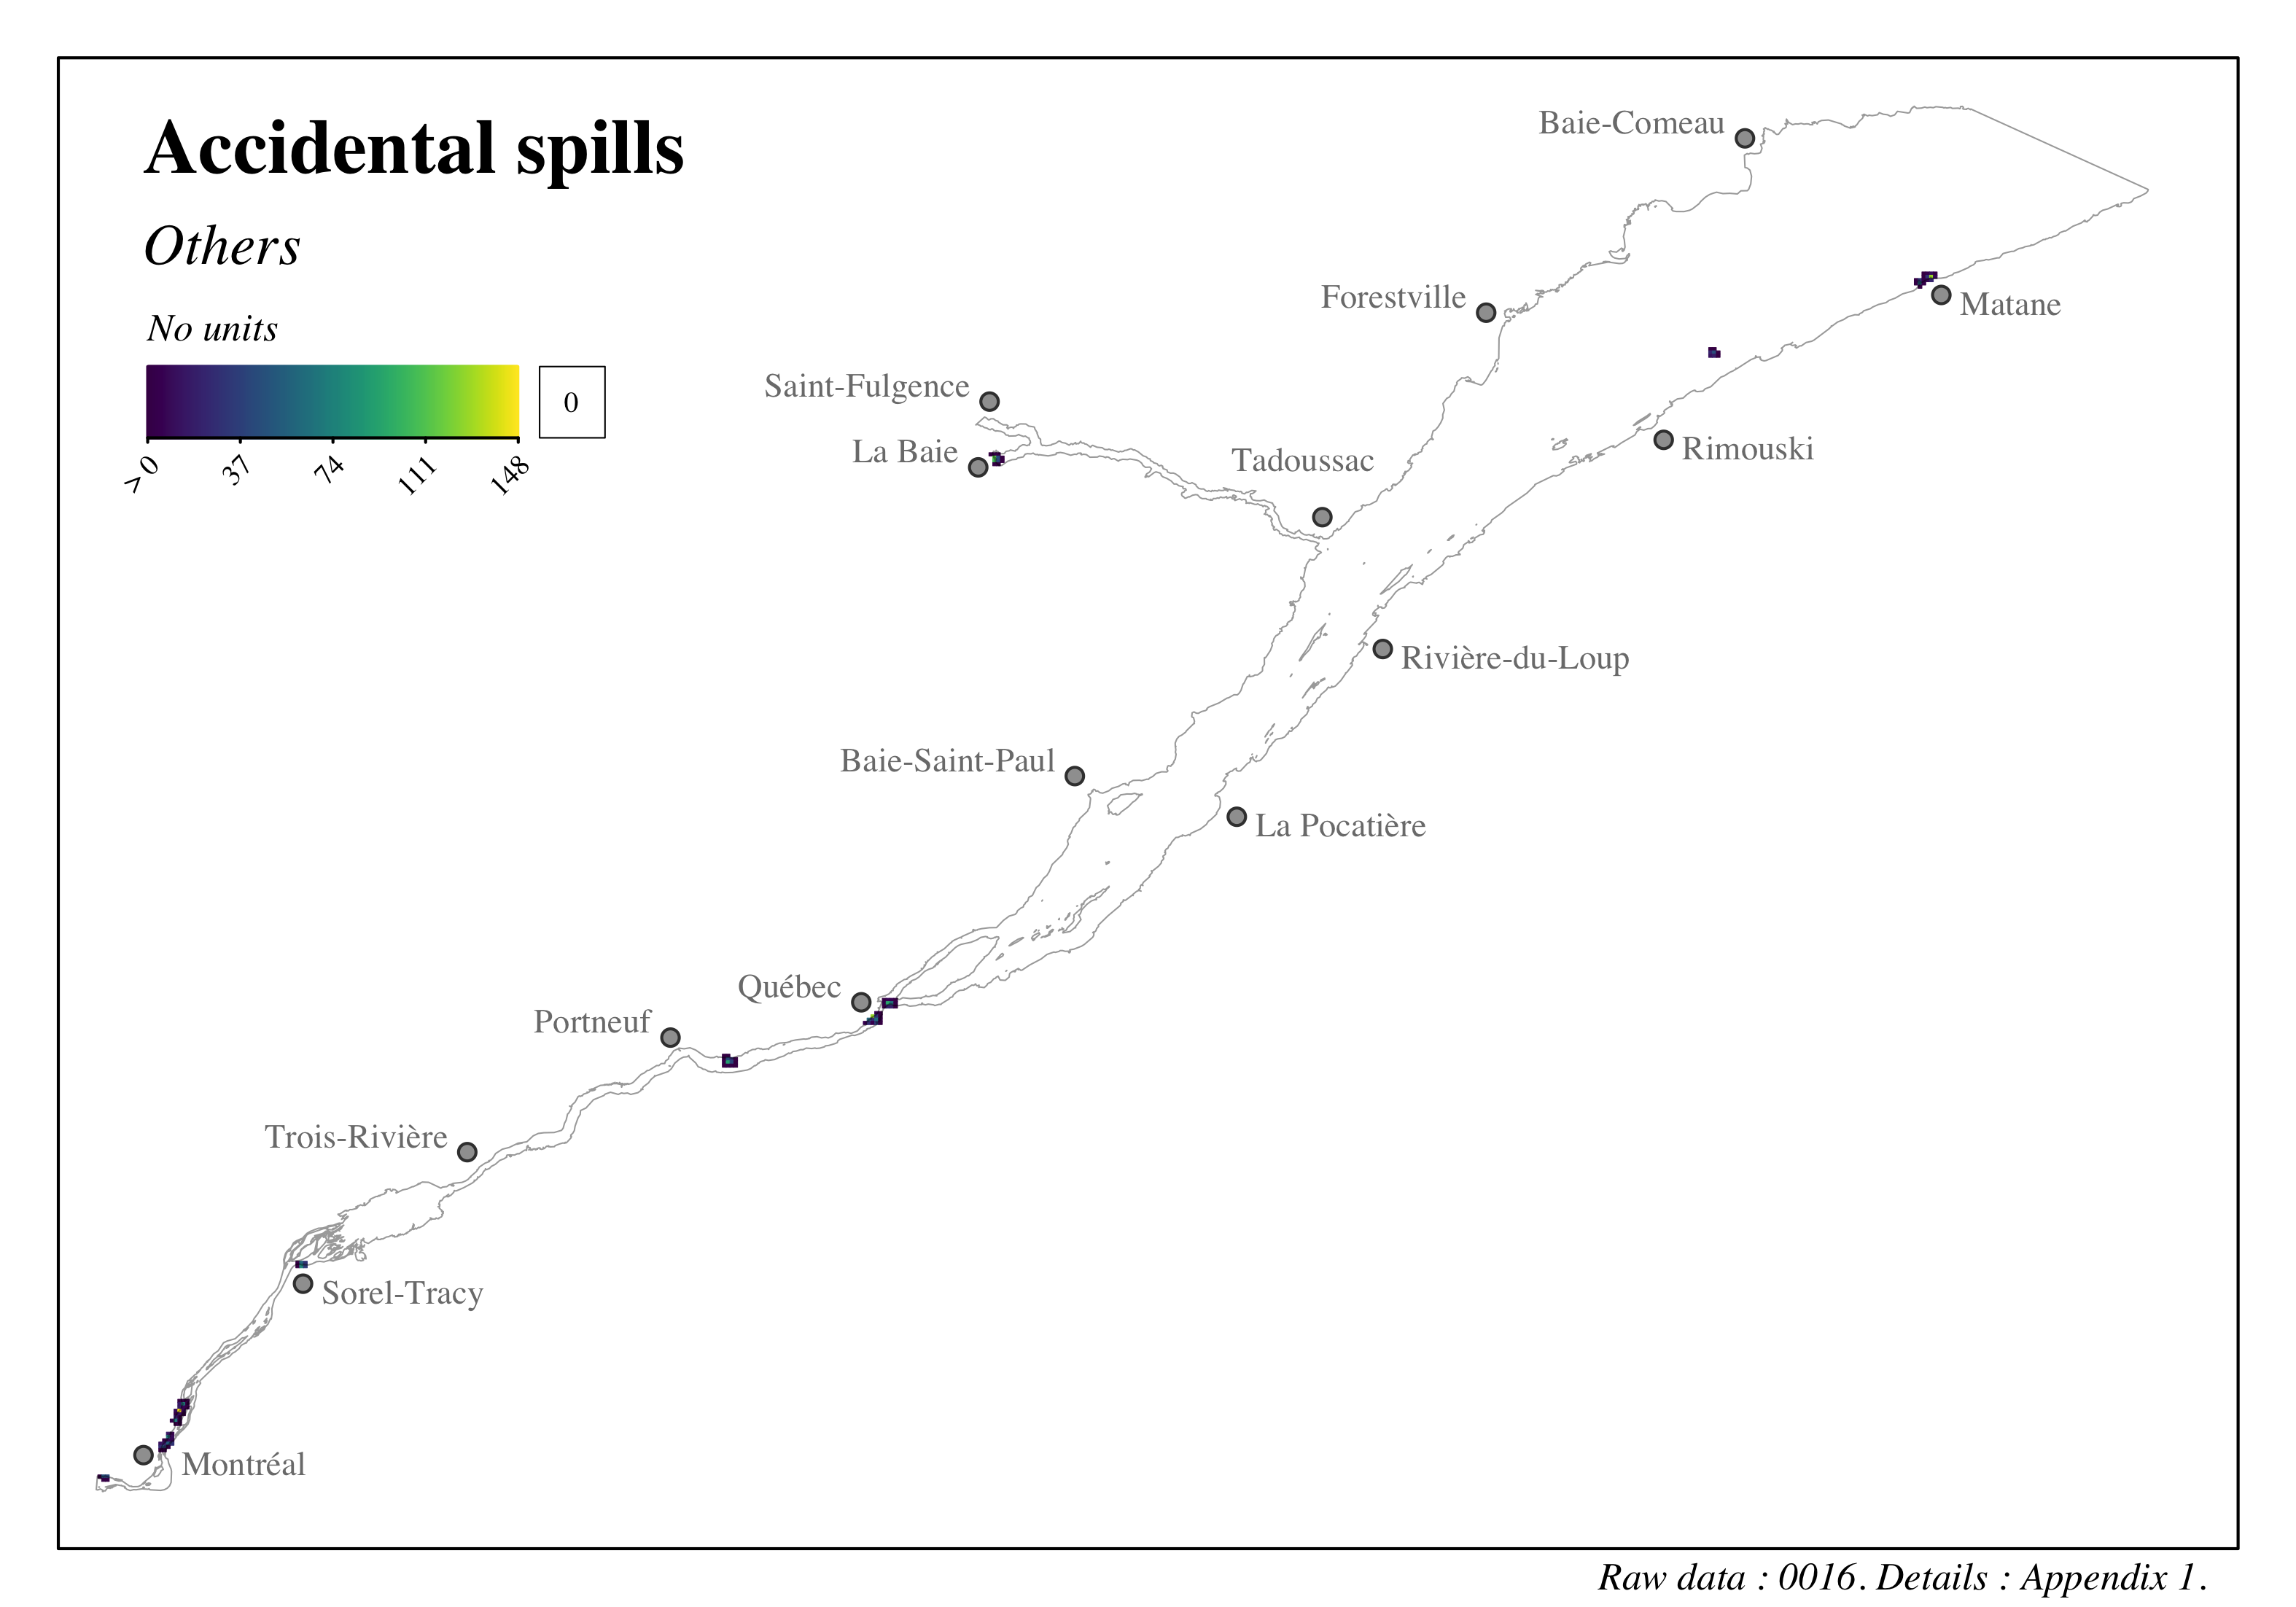
Figure 4.3: Distribution and intensity of accidental spills in the St. Lawrence and the Saguenay river - Others
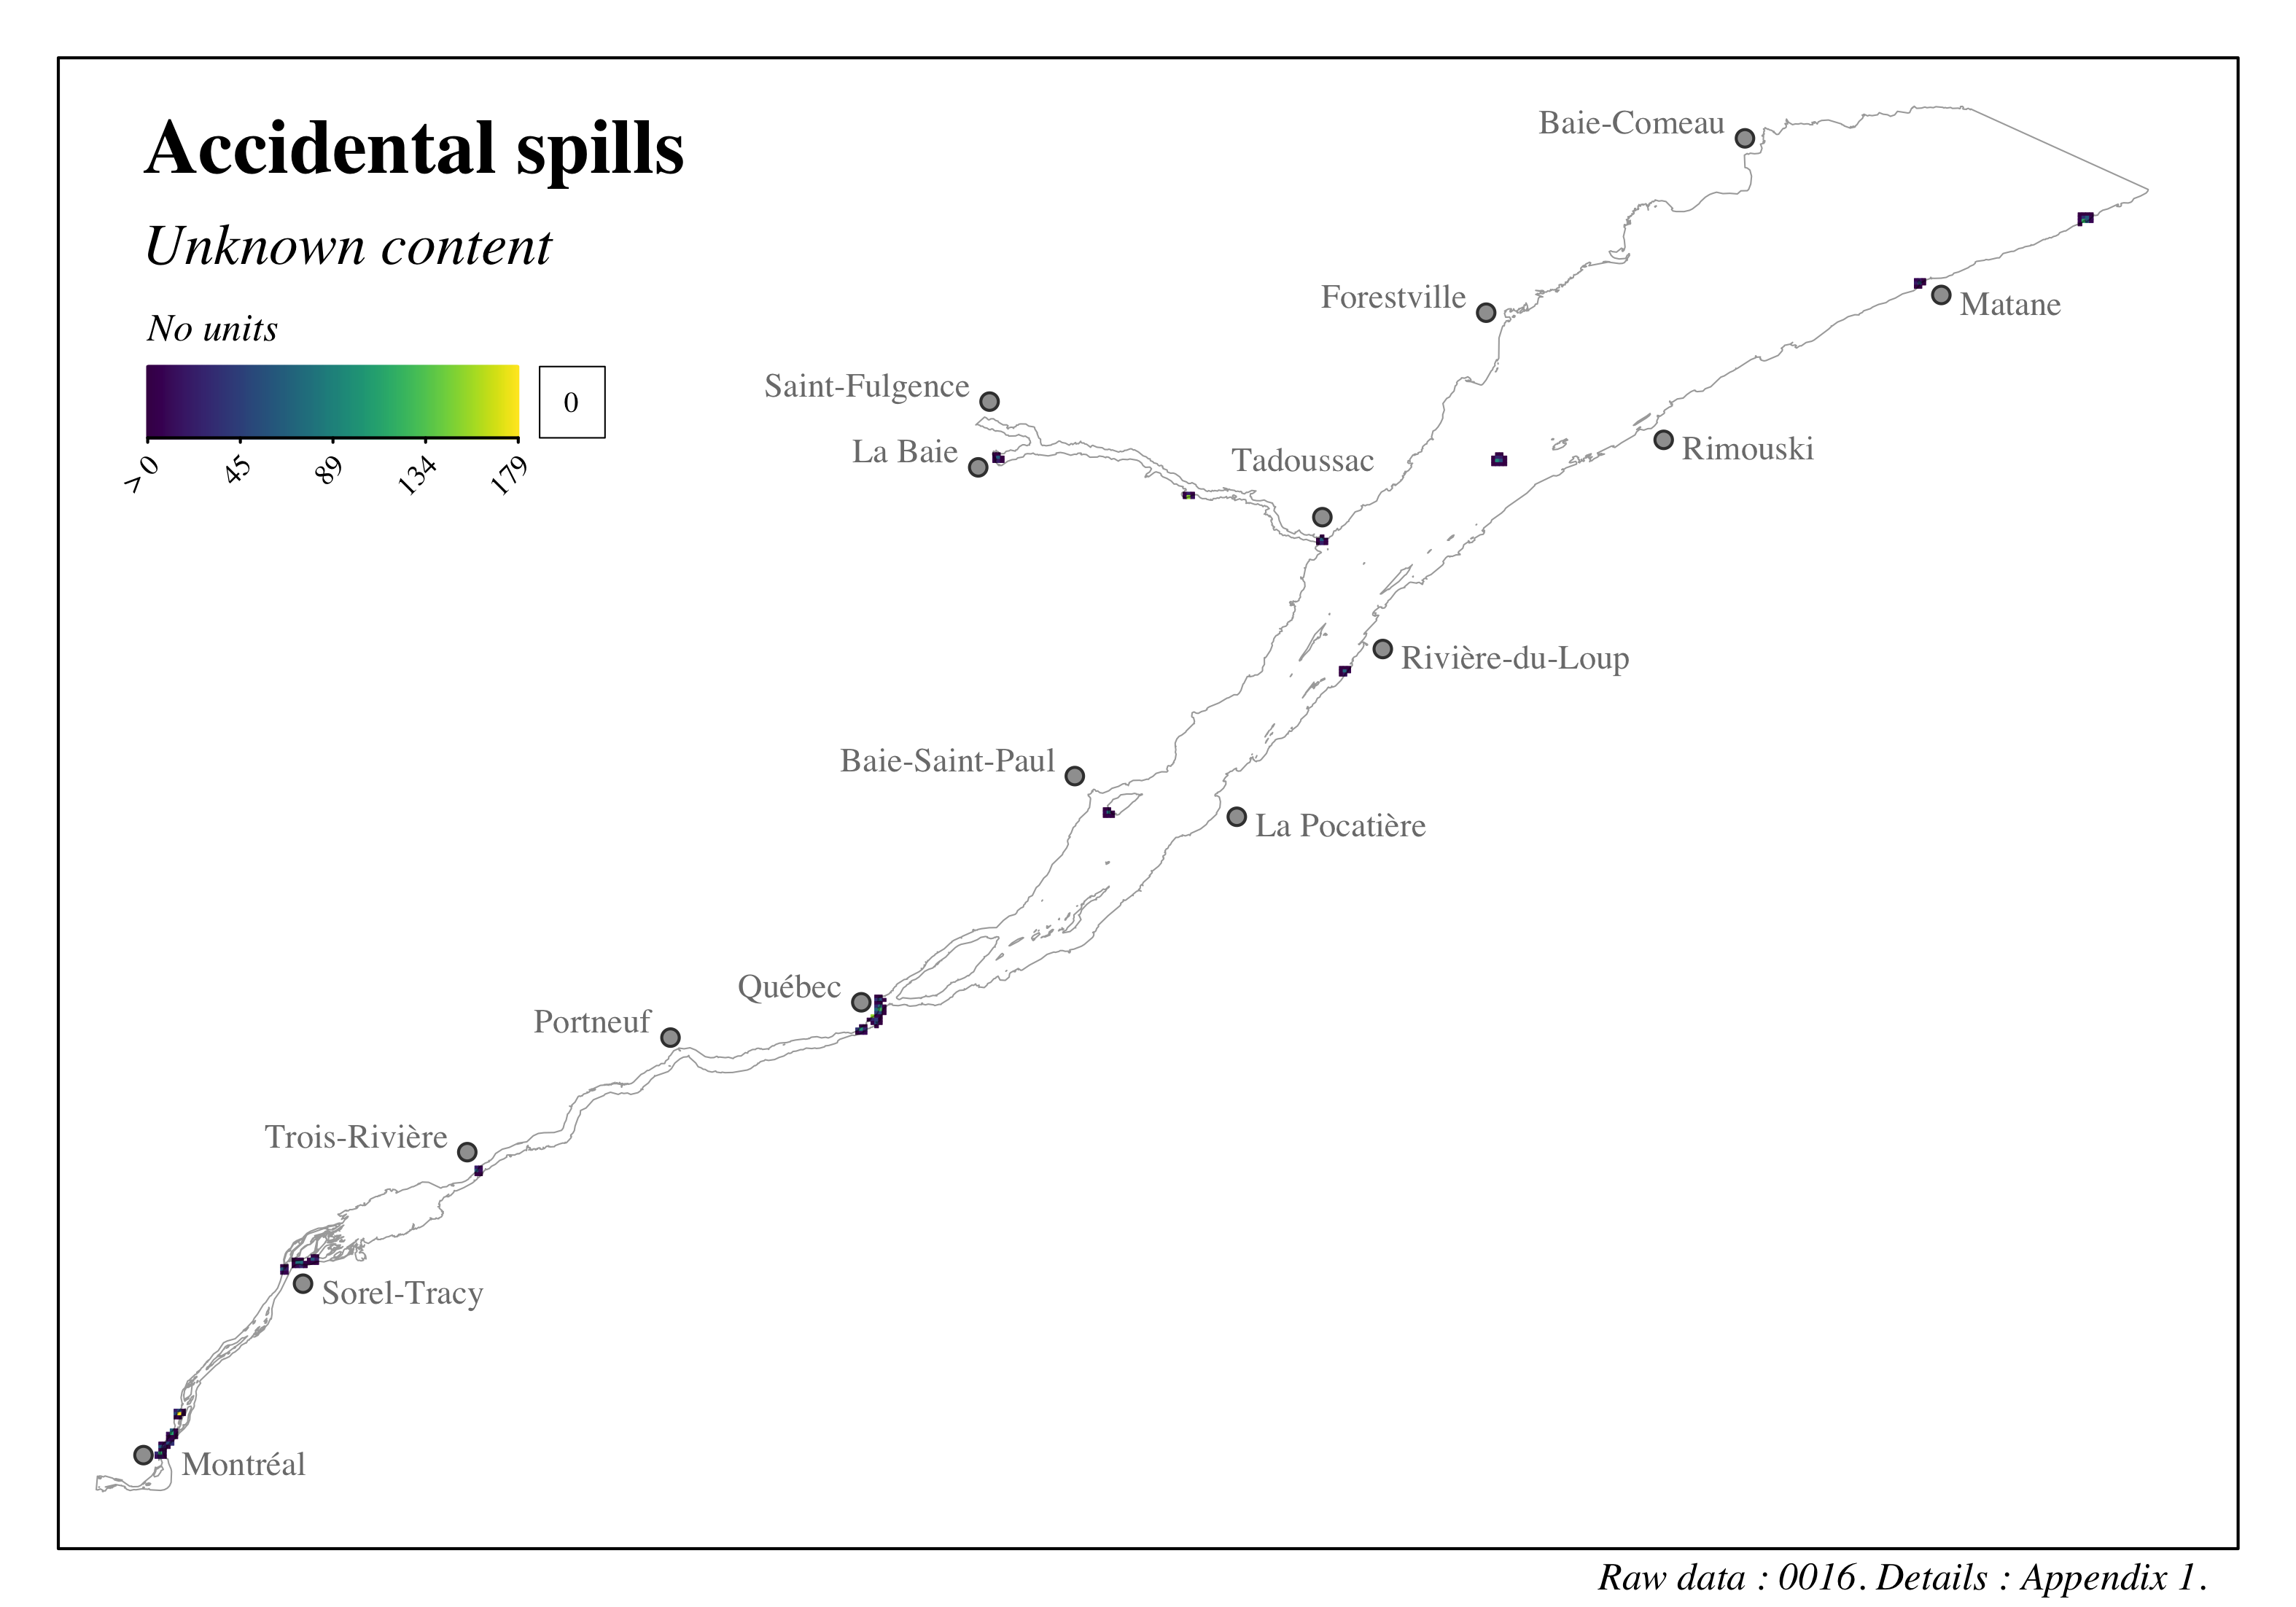
Figure 4.4: Distribution and intensity of accidental spills in the St. Lawrence and the Saguenay river - Unknown content
4.2.3 Dredging
We thank Simon Blais of Environment and Climate Change Canada and Pierre Michon of the Quebec Ministry of the Environment and the Fight Against Climate Change for the discussions and support.
The unique identifiers given to the data presented in this section are: 0018, 0019, 0046, 0048, 0049, 0050, 0052, 0069. Refer to the following section and to Appendix 1 for more details on these data.
The St. Lawrence Seaway has historically been dredged wherever the natural depth would not allow boats to pass safely. Between Montreal and Cap Gribane, which is located downstream from Cap Tourmente, about 30 \(km\) from Île d’Orléans, the navigable waterway is approximately 340 km long and artificial banks have added over a distance of about 210 km to ensure safe navigation (GHD, 2019). The waterway has been deepened and widened over time, mainly due to increases in the size of vessels and marine traffic. A historic characterization of capitalization dredging activities – i.e. dredging to deepen and widen the waterway – of the St. Lawrence Seaway is described by Côté and Morin (2007a) and Côté and Morin (2007b). Some portions of the waterway must also be dredged at regular intervals – i.e. maintenance dredging – due to the sediment dynamics of the environments. The same is true for certain port facilities along the St. Lawrence and Saguenay rivers, which must ensure the ability of their vessel facilities to operate safely.
In this study, contemporary dredging activities for the period 2001 to 2020 were characterized. Most of the data on dredged and deposited volumes come from a compilation exercise of dredging activities throughout the St. Lawrence (Environnement et Changement Climatique Canada, 2020; Ministère des Transports du Québec, 2016, 2017). Dredging data available in a report assessing the environmental impacts of dredging in the St. Lawrence Seaway completed these data (GHD, 2019). Dredging activities for the Port of Quebec were characterized through discussions with a representative of the Port of Quebec City (Marie-Ève Lemieux, personal communication). Various reports were used to characterize maintenance dredging activities for Port Alfred (Englobe, 2016, 2017; Ministère de l’Environnement et de la Lutte contre les changements climatiques, 2019c), and capitalization dredging activities planned for the Port of Montreal at Contrecoeur (Agence d’évaluation d’impact du Canada, 2021; Lavalin, 2017a, 2017b) and for the Port of Trois-Rivières (Stantec, 2015). Lastly, data on dredging and disposal sites were transmitted by the Essipit Innu First Nation (Bouchard, 2022).
The volumes recorded were then plotted for the dredging and disposal sites. Where provided within the reports, coordinates delineating the sites considered were used. Where a single coordinate representing the geometric centre of the sites where dredging would take place was available without additional information on the exact location of the activity, an area with a radius of 100 \(m\) was drawn to represent the dredging or disposal area. Where the location was described, or a figure was available in the detailed reports, the dredged and disposal areas were georeferenced manually. The St. Lawrence Seaway dredging and disposal site locations were taken from a database provided by the Canadian Coast Guard (Garde côtière canadienne, 2021b).
Dredging sites and dredged sediment disposal sites were characterized based on the total volume dredged in \(m^3\) during the period considered (Table 4.4). A total of 37 dredging sites (Table 4.5) and 29 disposal sites (Table 4.6) were characterized in the study area. It should be noted that the total volumes dredged do not correspond to the total volumes deposited since some of the disposal sites are on land and accordingly, were not included in this study.
Port expansion projects for the Port of Montreal at Contrecoeur (Agence d’évaluation d’impact du Canada, 2021; Lavalin, 2017a, 2017b) and for the Port of Trois-Rivières (Stantec, 2015) provided plans for capitalization dredging in the coming years. These plans were therefore identified (Table 4.4; Table 4.7).
| Category | Number of sites | Total volumes | Average total volumes | Standard deviation |
|---|---|---|---|---|
| Dredging sites | 37 | 3793607 | 102529.9 | 193264.0 |
| Disposal sites | 29 | 3429662 | 118264.2 | 181596.1 |
| Planned capitalization dredging | 2 | 1009000 | 504500.0 |
| Region | Site name | Total volumes |
|---|---|---|
| Baie-Comeau | Havre de Baie-comeau | 8428 |
| Baie-Comeau | Quai Société Alcoa | 56000 |
| Baie-Comeau | Quai de Cargill | 2240 |
| Baie-Trinité | Havre de Baie-Trinité | 3000 |
| Berthier-sur-Mer | Havre de Berthier-sur-Mer | 45000 |
| Bécancour | Port de Bécancour | 83624 |
| Cacouna | Port de Gros-Cacouna | 69250 |
| Chenal de navigation du fleuve Saint-Laurent | Bécancour à Batiscan | 137728 |
| Chenal de navigation du fleuve Saint-Laurent | Champlain à Deschaillons | 53284 |
| Chenal de navigation du fleuve Saint-Laurent | Lac Saint-Pierre | 171439 |
| Chenal de navigation du fleuve Saint-Laurent | Sorel | 880 |
| Chenal de navigation du fleuve Saint-Laurent | Traverse Cap Santé | 41122 |
| Chenal de navigation du fleuve Saint-Laurent | Traverse Nord I.O. | 1041219 |
| Chenal de navigation du fleuve Saint-Laurent | Trois-Rivière à Bécancour | 284820 |
| Godbout | Quai de Godbout | 4932 |
| Ile-aux-Coudres | Desserte | 338885 |
| Ile-aux-Grues | Desserte | 78628 |
| Les Bergeronnes | Première Nation des Innus d’Essipit | 7725 |
| Les Méchins | Quai de Les Méchins | 4000 |
| Matane | Marina de Matane | 21000 |
| Matane | Port de Matane | 25393 |
| Québec | Port de Québec - Secteur Anse au Foulon | 500 |
| Québec | Port de Québec - Secteur Beauport | 500 |
| Rimouski | Marina de Rimouski | 3500 |
| Rimouski | Port de Rimouski - Bassin est | 269483 |
| Rivière-du-Loup | Desserte | 488843 |
| Rivière-du-Loup | Parc maritime de Rivière-du-Loup | 175834 |
| Saguenay | Port Alfred | 5086 |
| Saint-Jean-Port-Joli | Parc nautique de Saint-Jean-Port-Joli | 138000 |
| Saint-Joseph-de-Sorel | zone portuaire QIT-Fer et Titane inc. | 4930 |
| Saint-Joseph-de-la-Rive | Desserte | 18552 |
| Saint-Laurent-de-L’Île-D’Orléans | Port de refuge de St-Laurent-de-L’Île-D’Orléans | 26675 |
| Saint-Michel-de-Bellechasse | Halte nautique de Saint-Michel-de-Bellechasse | 40000 |
| Sorel-Tracy | Marina de Sorel | 30000 |
| Sorel-Tracy | Port de Sorel-Tracy | 104815 |
| Tadoussac | Desserte est | 2292 |
| Tadoussac | Marina de Tadoussac | 6000 |
| Region | Site name | Total volumes |
|---|---|---|
| Baie-Comeau | Havre de Baie-comeau | 8428 |
| Berthier-sur-Mer | Havre de Berthier-sur-Mer | 45000 |
| Chenal de navigation du fleuve Saint-Laurent | M-27 | 880 |
| Chenal de navigation du fleuve Saint-Laurent | S-17 | 171439 |
| Chenal de navigation du fleuve Saint-Laurent | T-02 | 142410 |
| Chenal de navigation du fleuve Saint-Laurent | T-06 | 142410 |
| Chenal de navigation du fleuve Saint-Laurent | T-11 | 164370 |
| Chenal de navigation du fleuve Saint-Laurent | T-16 | 26642 |
| Chenal de navigation du fleuve Saint-Laurent | X-02 | 180000 |
| Chenal de navigation du fleuve Saint-Laurent | X-03 | 861219 |
| Chenal de navigation du fleuve Saint-Laurent | X-04 | 41122 |
| Godbout | Quai de Godbout | 4932 |
| Ile-aux-Coudres | Desserte | 338885 |
| Ile-aux-Grues | Desserte | 78628 |
| Les Bergeronnes | Première Nation des Innus d’Essipit | 700 |
| Les Bergeronnes | Première Nation des Innus d’Essipit | 7025 |
| Matane | Marina de Matane | 21000 |
| Matane | Port de Matane | 25393 |
| Rimouski | Marina de Rimouski | 3500 |
| Rimouski | Port de Rimouski - Bassin est | 269483 |
| Rivière-du-Loup | Desserte | 36528 |
| Rivière-du-Loup | Desserte | 452315 |
| Rivière-du-Loup | Parc maritime de Rivière-du-Loup | 175834 |
| Saint-Jean-Port-Joli | Parc nautique de Saint-Jean-Port-Joli | 138000 |
| Saint-Joseph-de-la-Rive | Desserte | 18552 |
| Saint-Laurent-de-L’Île-D’Orléans | Port de refuge de St-Laurent-de-L’Île-D’Orléans | 26675 |
| Saint-Michel-de-Bellechasse | Halte nautique de Saint-Michel-de-Bellechasse | 40000 |
| Tadoussac | Desserte est | 2292 |
| Tadoussac | Marina de Tadoussac | 6000 |
| Region | Site name | Total volumes |
|---|---|---|
| Montréal | Port de Montréal à Contrecoeur | 839000 |
| Trois-Rivières | Port de Trois-Rivières | 170000 |
The intensity of dredging (Figure 4.5), sediment disposal (Figure 4.6), and planned dredging (Figure 4.7) activities was characterized by distributing the total volumes dredged within our 1 \(km^2\) grid. For example, imagine a dredging activity that resulted in the extraction of 100 \(m^3\) of sediment over a total area of 2 \(km^2\) and that this site covers exactly 2 cells of our study grid. This means that the values assigned to the 1 \(km^2\) cells would be 50 \(m^3\) each.
To do so, we multiplied the total volumes in each \(j\) cell of the study grid by the proportion of the area where dredging would take place covering cell \(j\):
\[I_{dredging,j} = \sum_{k=1}^{n_j} V_{tot, k} * \frac{A_{j,k}}{A_{tot,k}}\]
where \(j\) is a study grid cell, \(k\) is a dredging or disposal activity, \(V_{tot}\) is the total volume dredged or deposited during the dredging or disposal activity, \(A\) is the dredging area where dredging would take place \(k\) that intersects a \(j\) cell, and \(A_{tot}\) is the total area where the \(k\) dredging or disposal occurs. This formula calculates an assessment of the dredging intensity in \(m^3\). Since we have calculated the intensity in cells of 1 \(km^2\), the units of this formula are in \(m^3 * km^{-2}\).
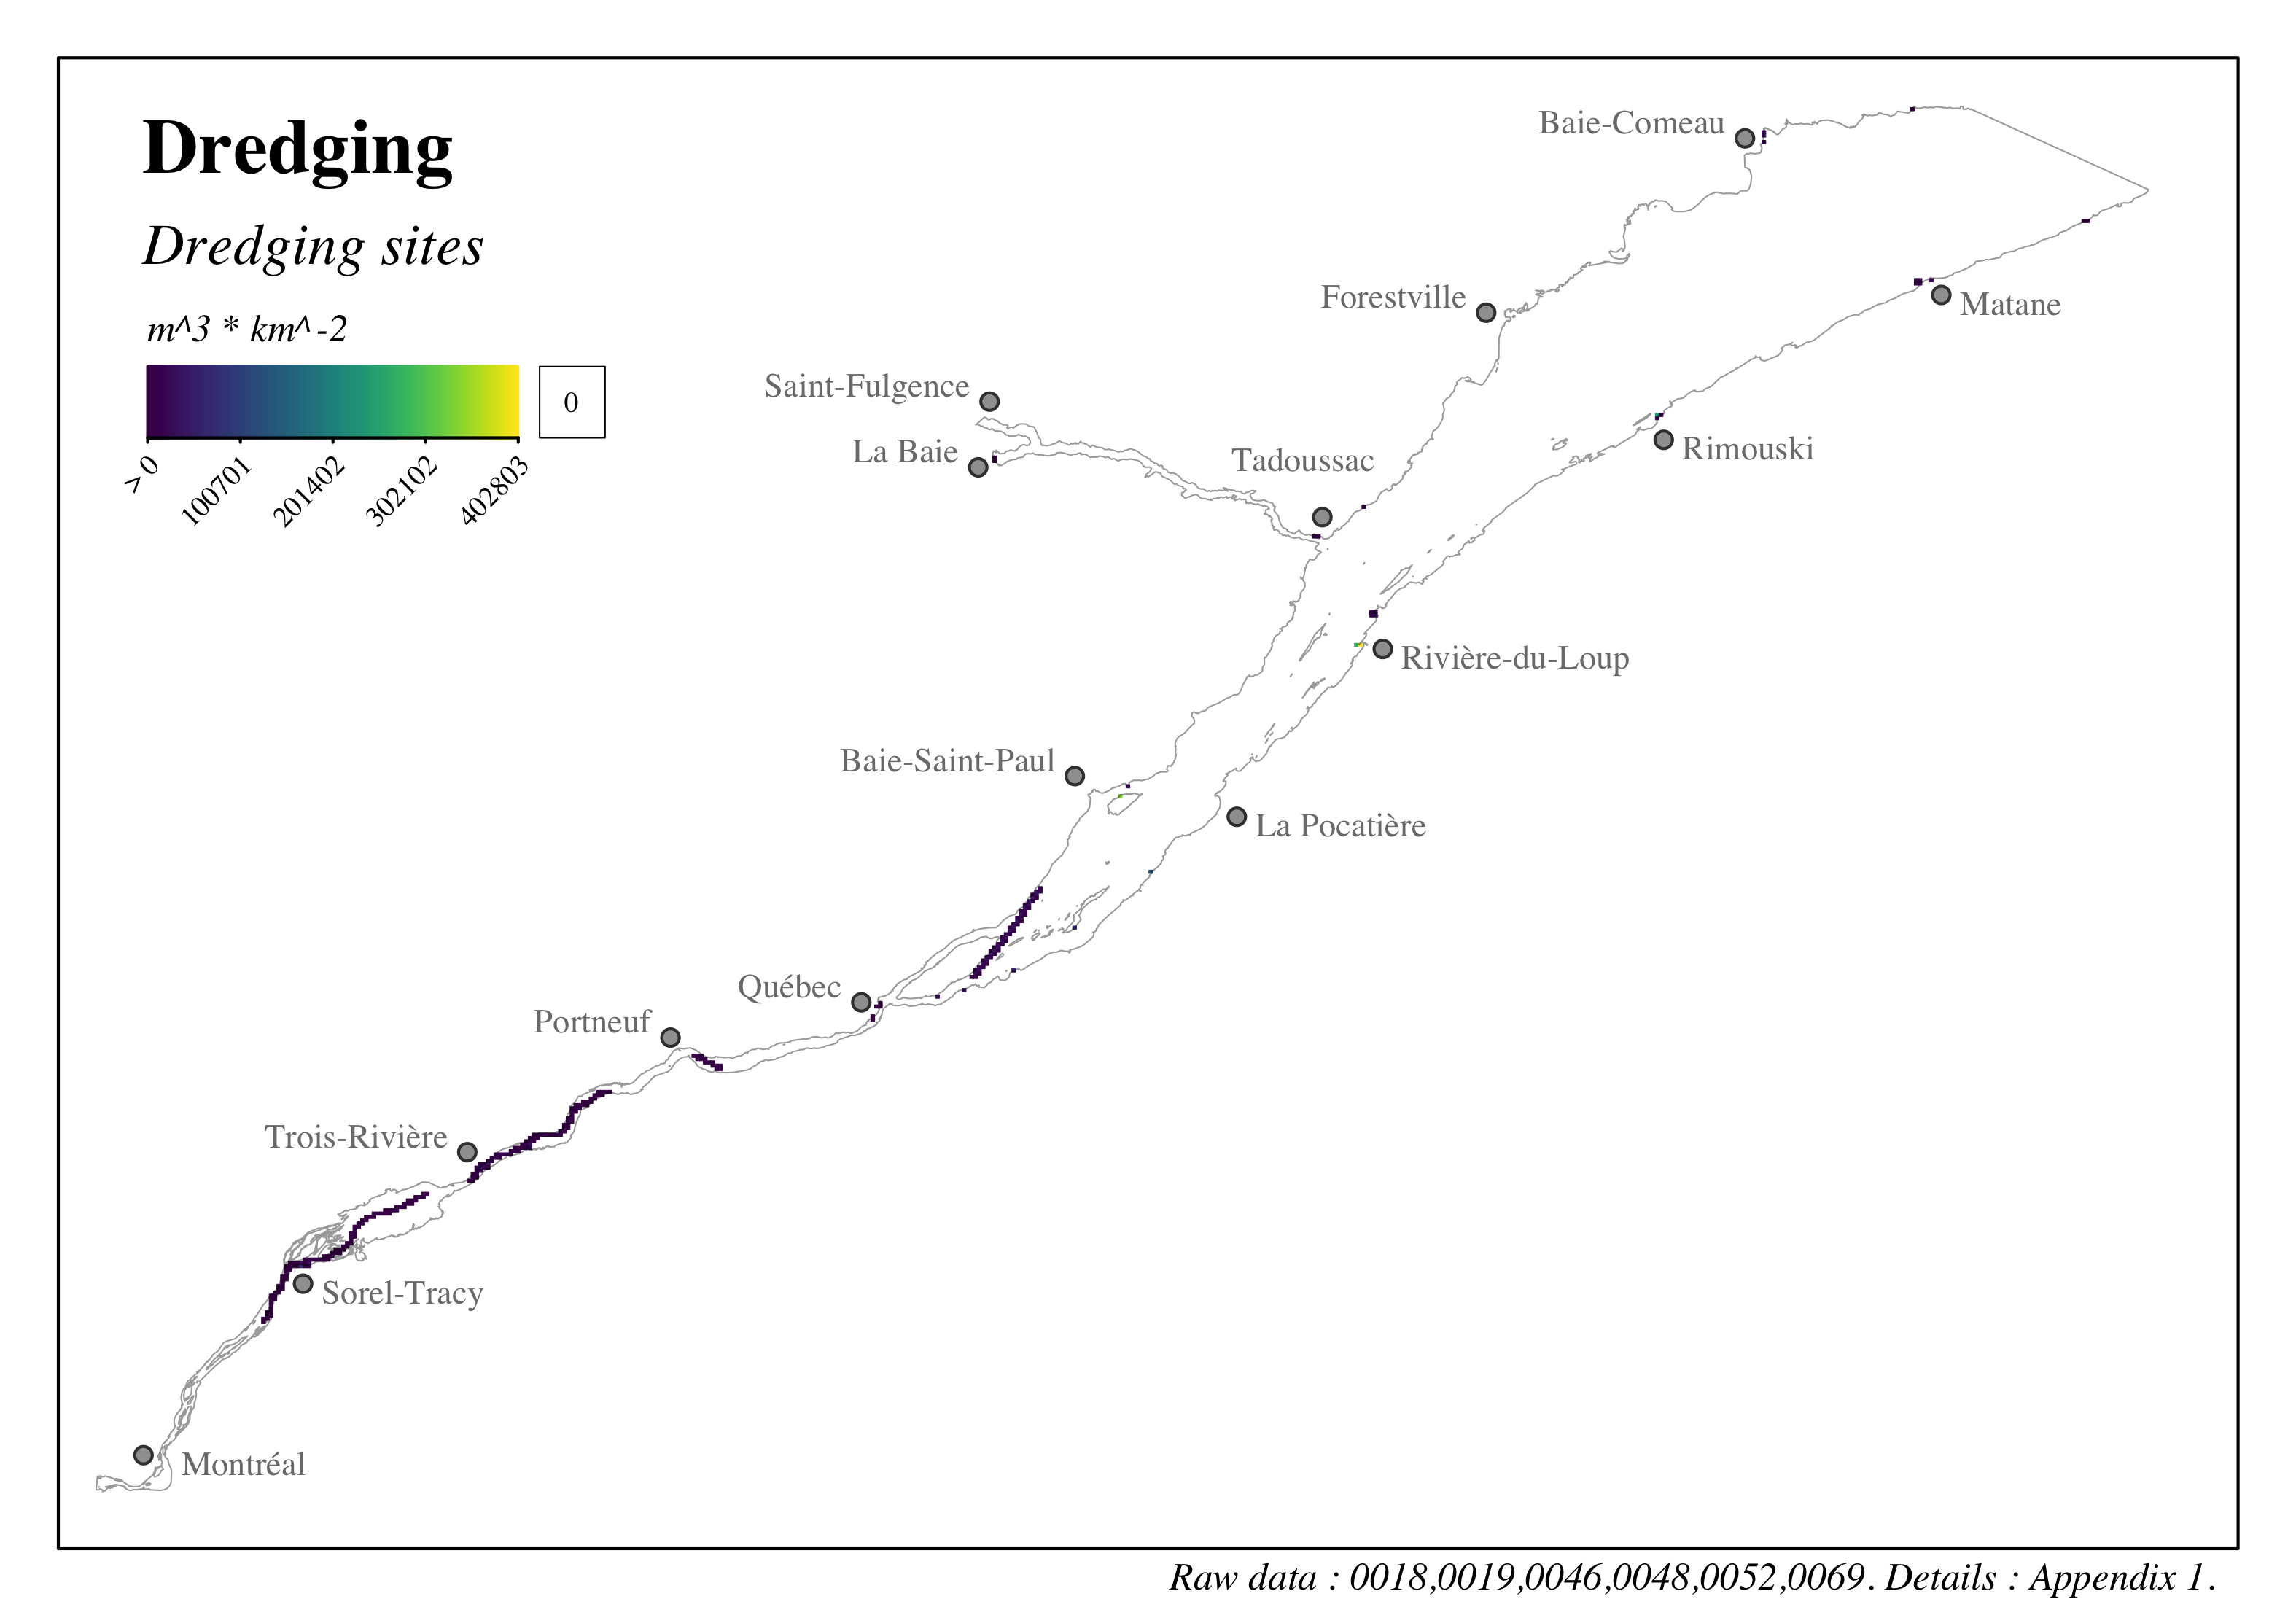
Figure 4.5: Distribution of dredging and disposal sites in the St. Lawrence and the Saguenay river - Dredging sites
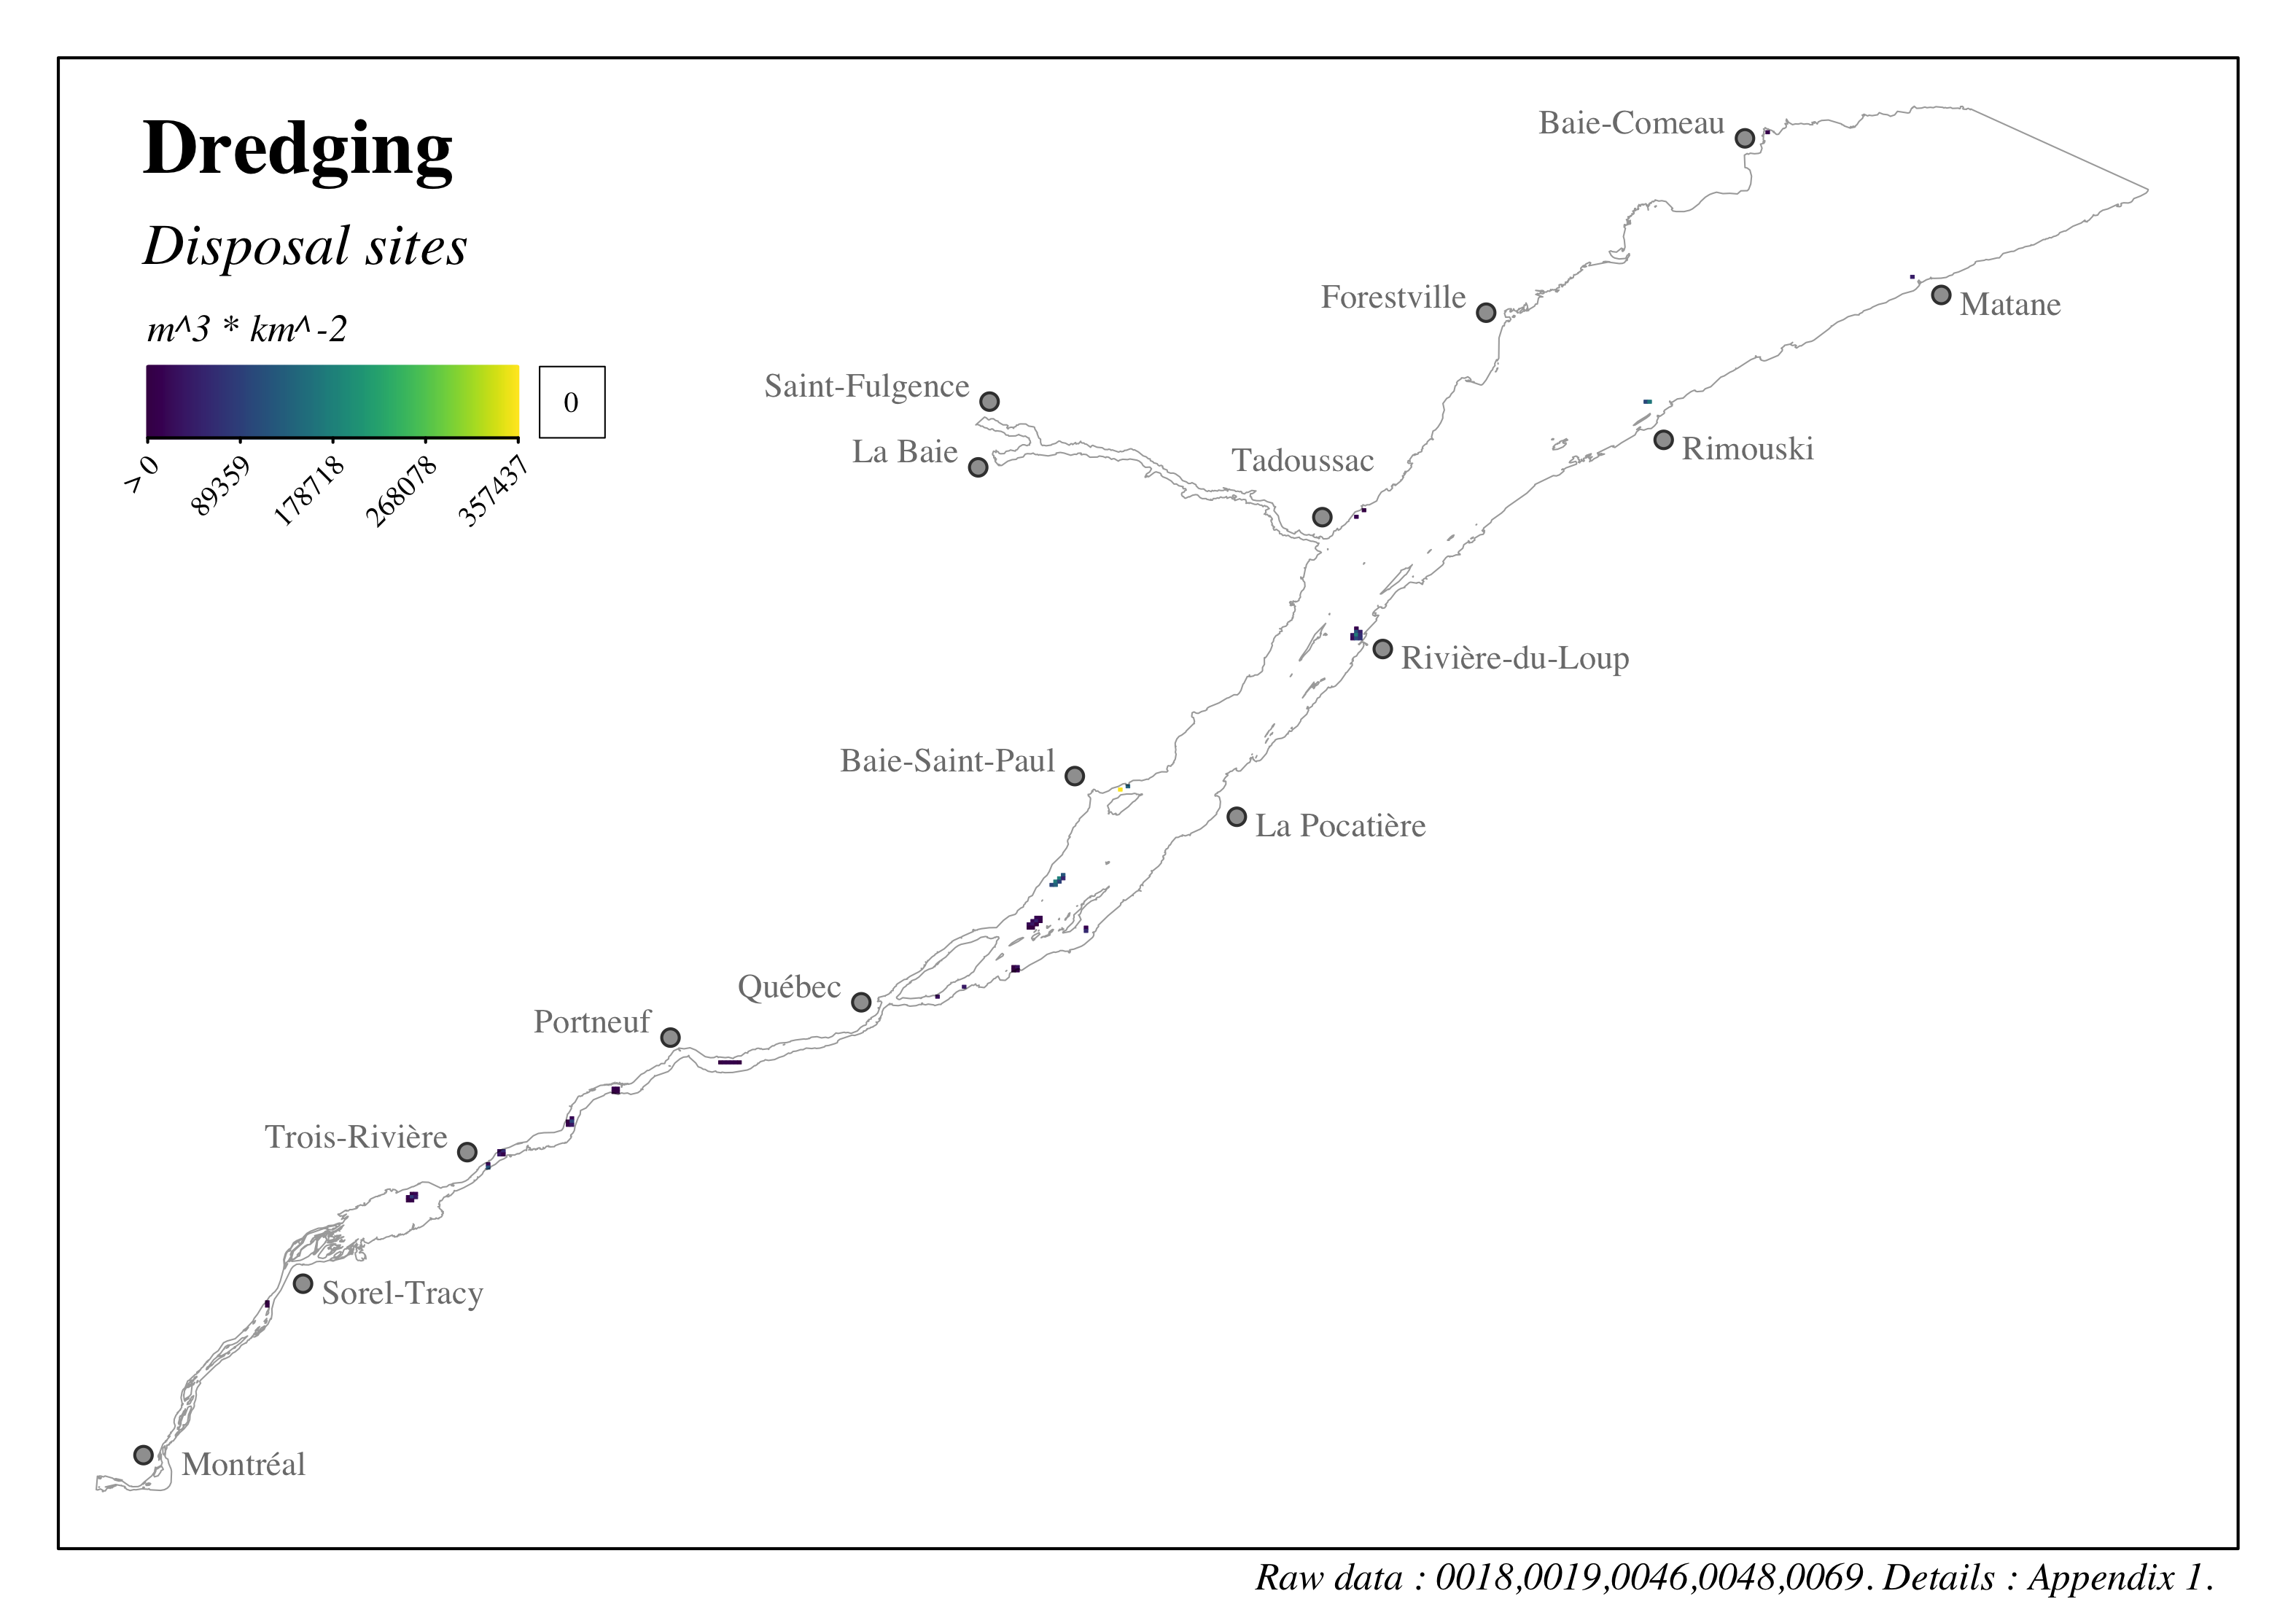
Figure 4.6: Distribution of dredging and disposal sites in the St. Lawrence and the Saguenay river - Disposal sites
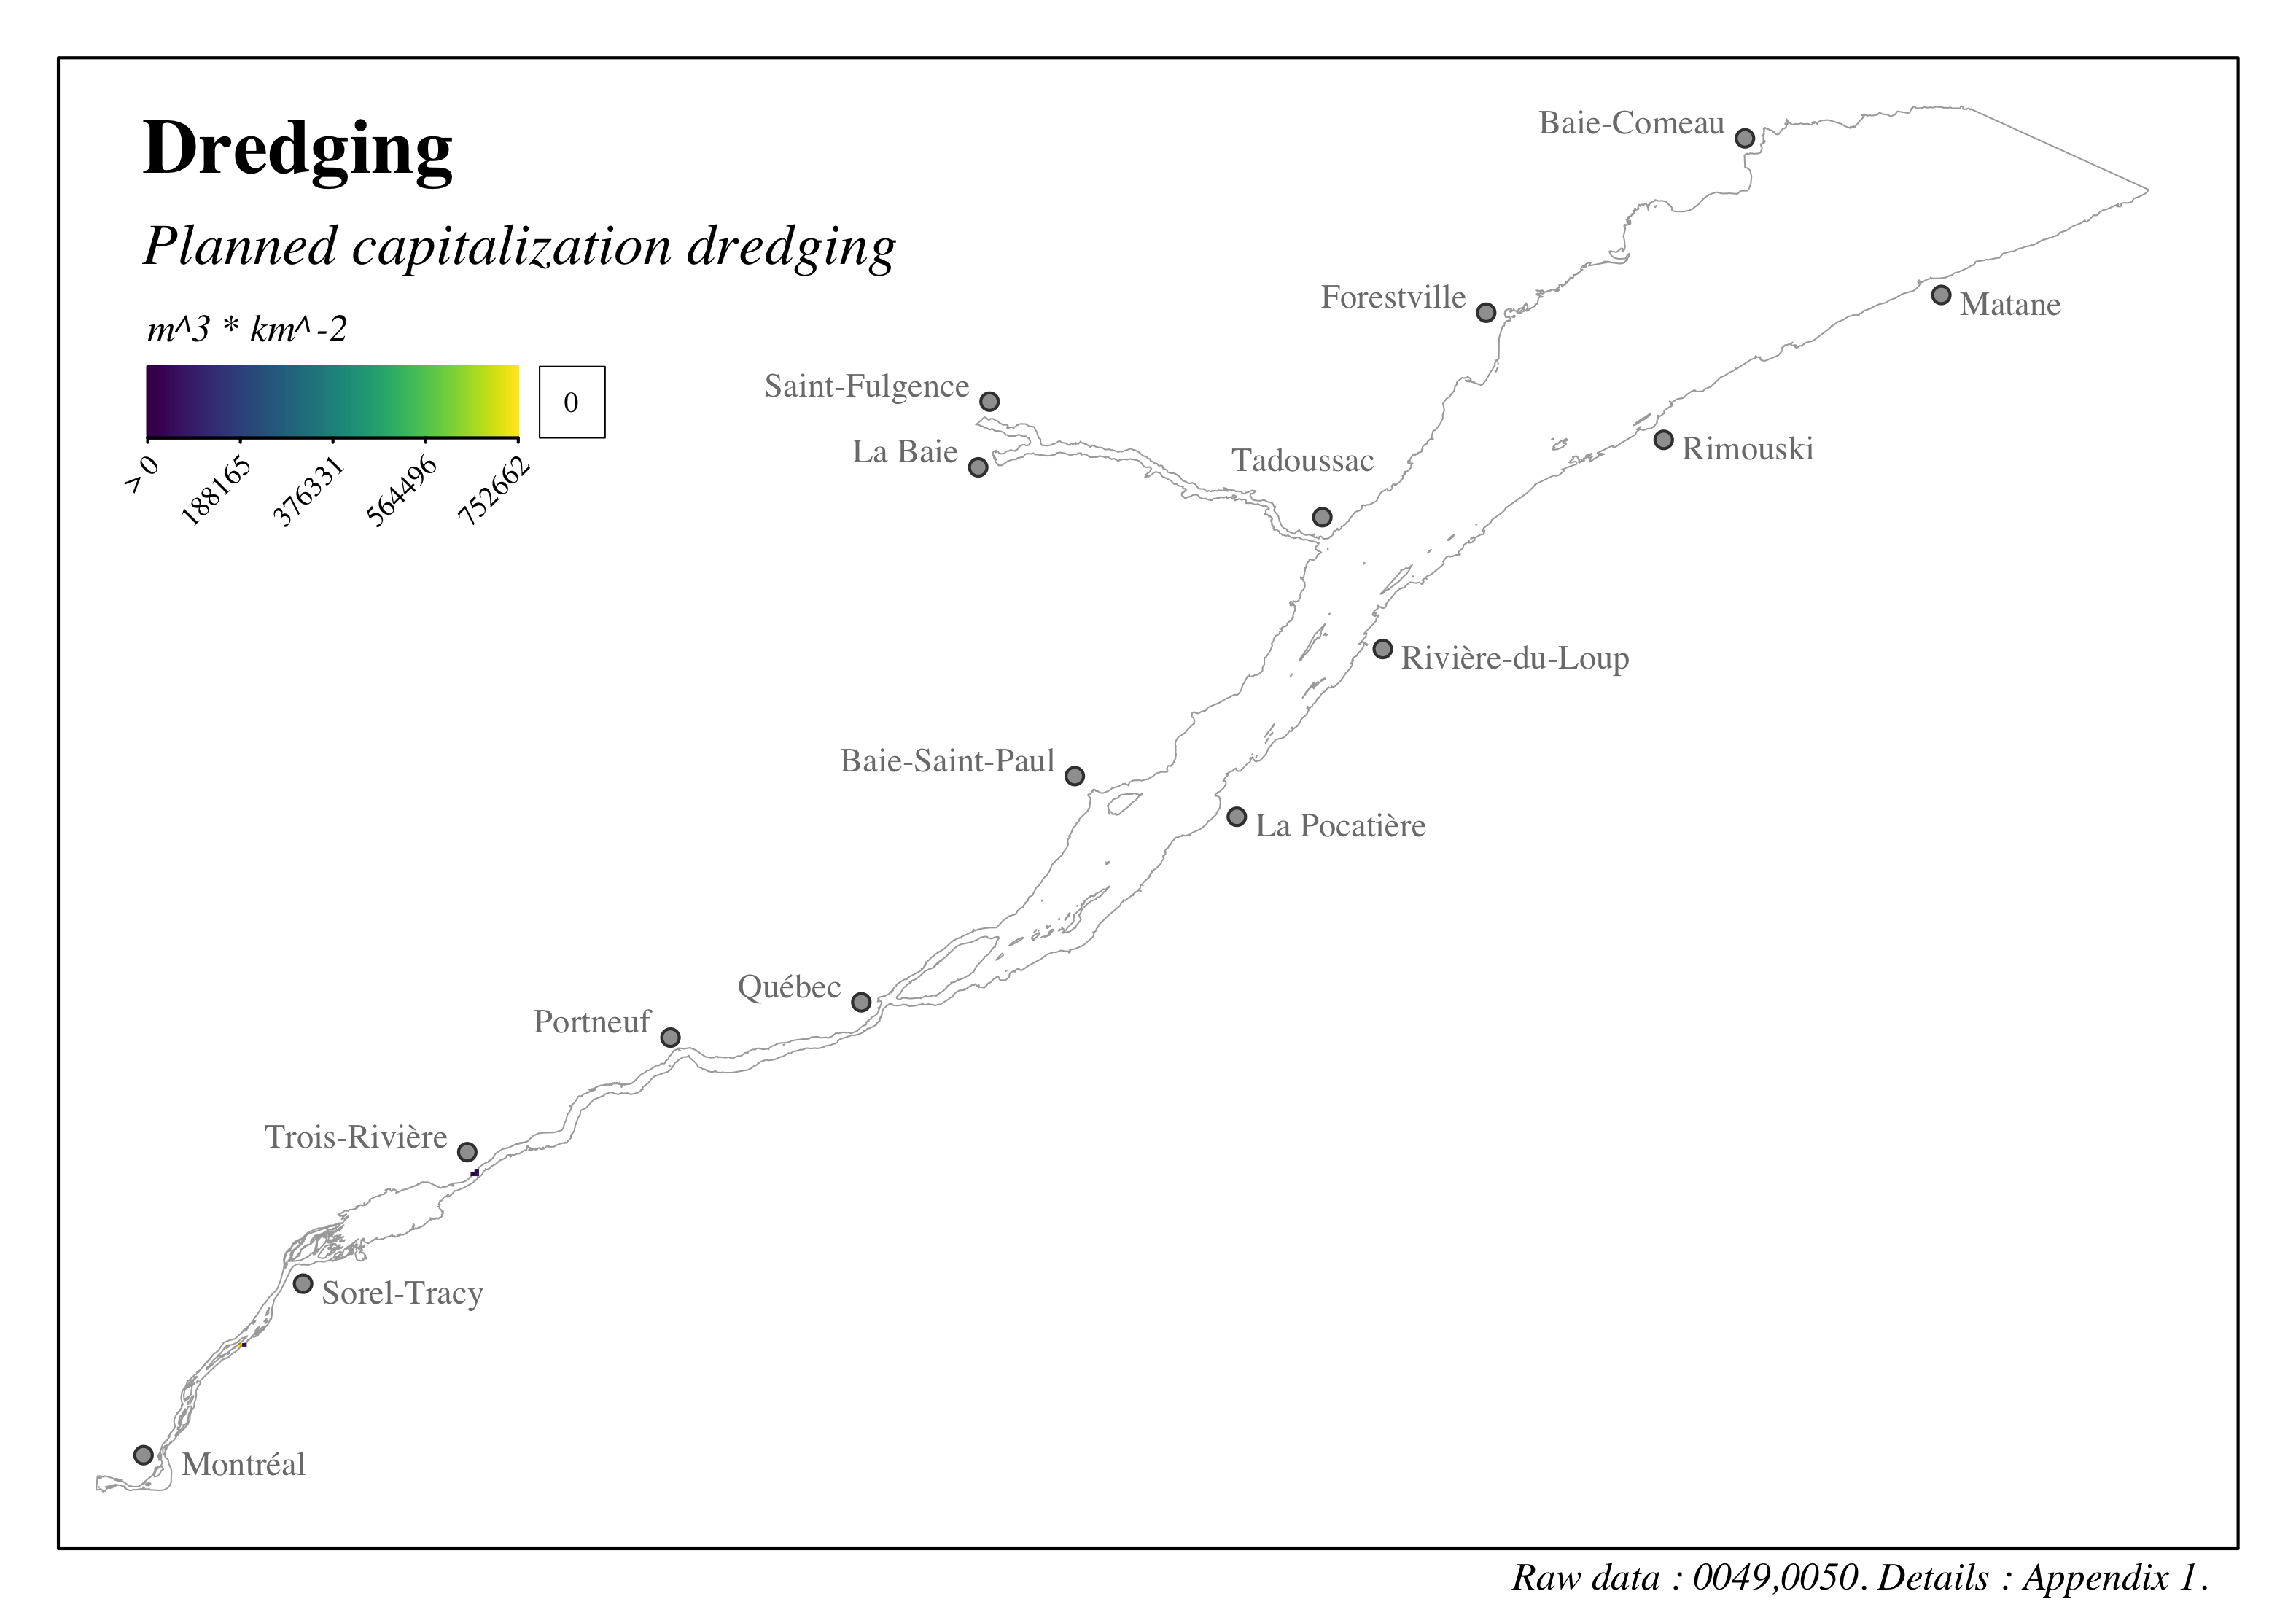
Figure 4.7: Distribution of dredging and disposal sites in the St. Lawrence and the Saguenay river - Planned capitalization dredging
4.2.4 Shipwrecks
We thank Sohaib Gabsis at Fisheries and Oceans Canada for the discussions and support.
The unique identifier given to the data presented in this section is: 0062. Refer to the following section and to Appendix 1 for more details on these data.
Environmental stress related to shipwrecks was characterized using a Canadian Coast Guard database on the distribution of vessels of concern (Garde côtière canadienne, 2021a). Most of the vessel data still need to be validated by the Canadian Coast Guard and the accuracy of the coordinates cannot be guaranteed; however, this database is the best available source of information and as such is used for the cumulative effects assessment. It will be possible to update the assessment once the data is validated by the Canadian Coast Guard. This database identifies 104 shipwrecks within the study area. The intensity of this environmental stressor was characterized using Gaussian smoothing – i.e. an interpolation method based on a normal distribution – of 3 \(km\) in order to identify areas potentially affected by shipwrecks and to account for the uncertainty of the shipwreck coordinates recorded by the Canadian Coast Guard.
It is important to note that shipwrecks may be protected when they are considered archeological sites; in this context, shipwrecks posing no risk to the environment should instead be considered archeological areas of interest within areas of cultural, heritage and archeological interest valued components. A characterization of the archeological areas of interest is available through the Inventory of Archeological Sites in Quebec (Inventaire des sites archéologiques du Québec) of the Ministry of Culture and Communications (Ministère de la Culture et des Communications). However, we were not able to access this inventory during our assessment.
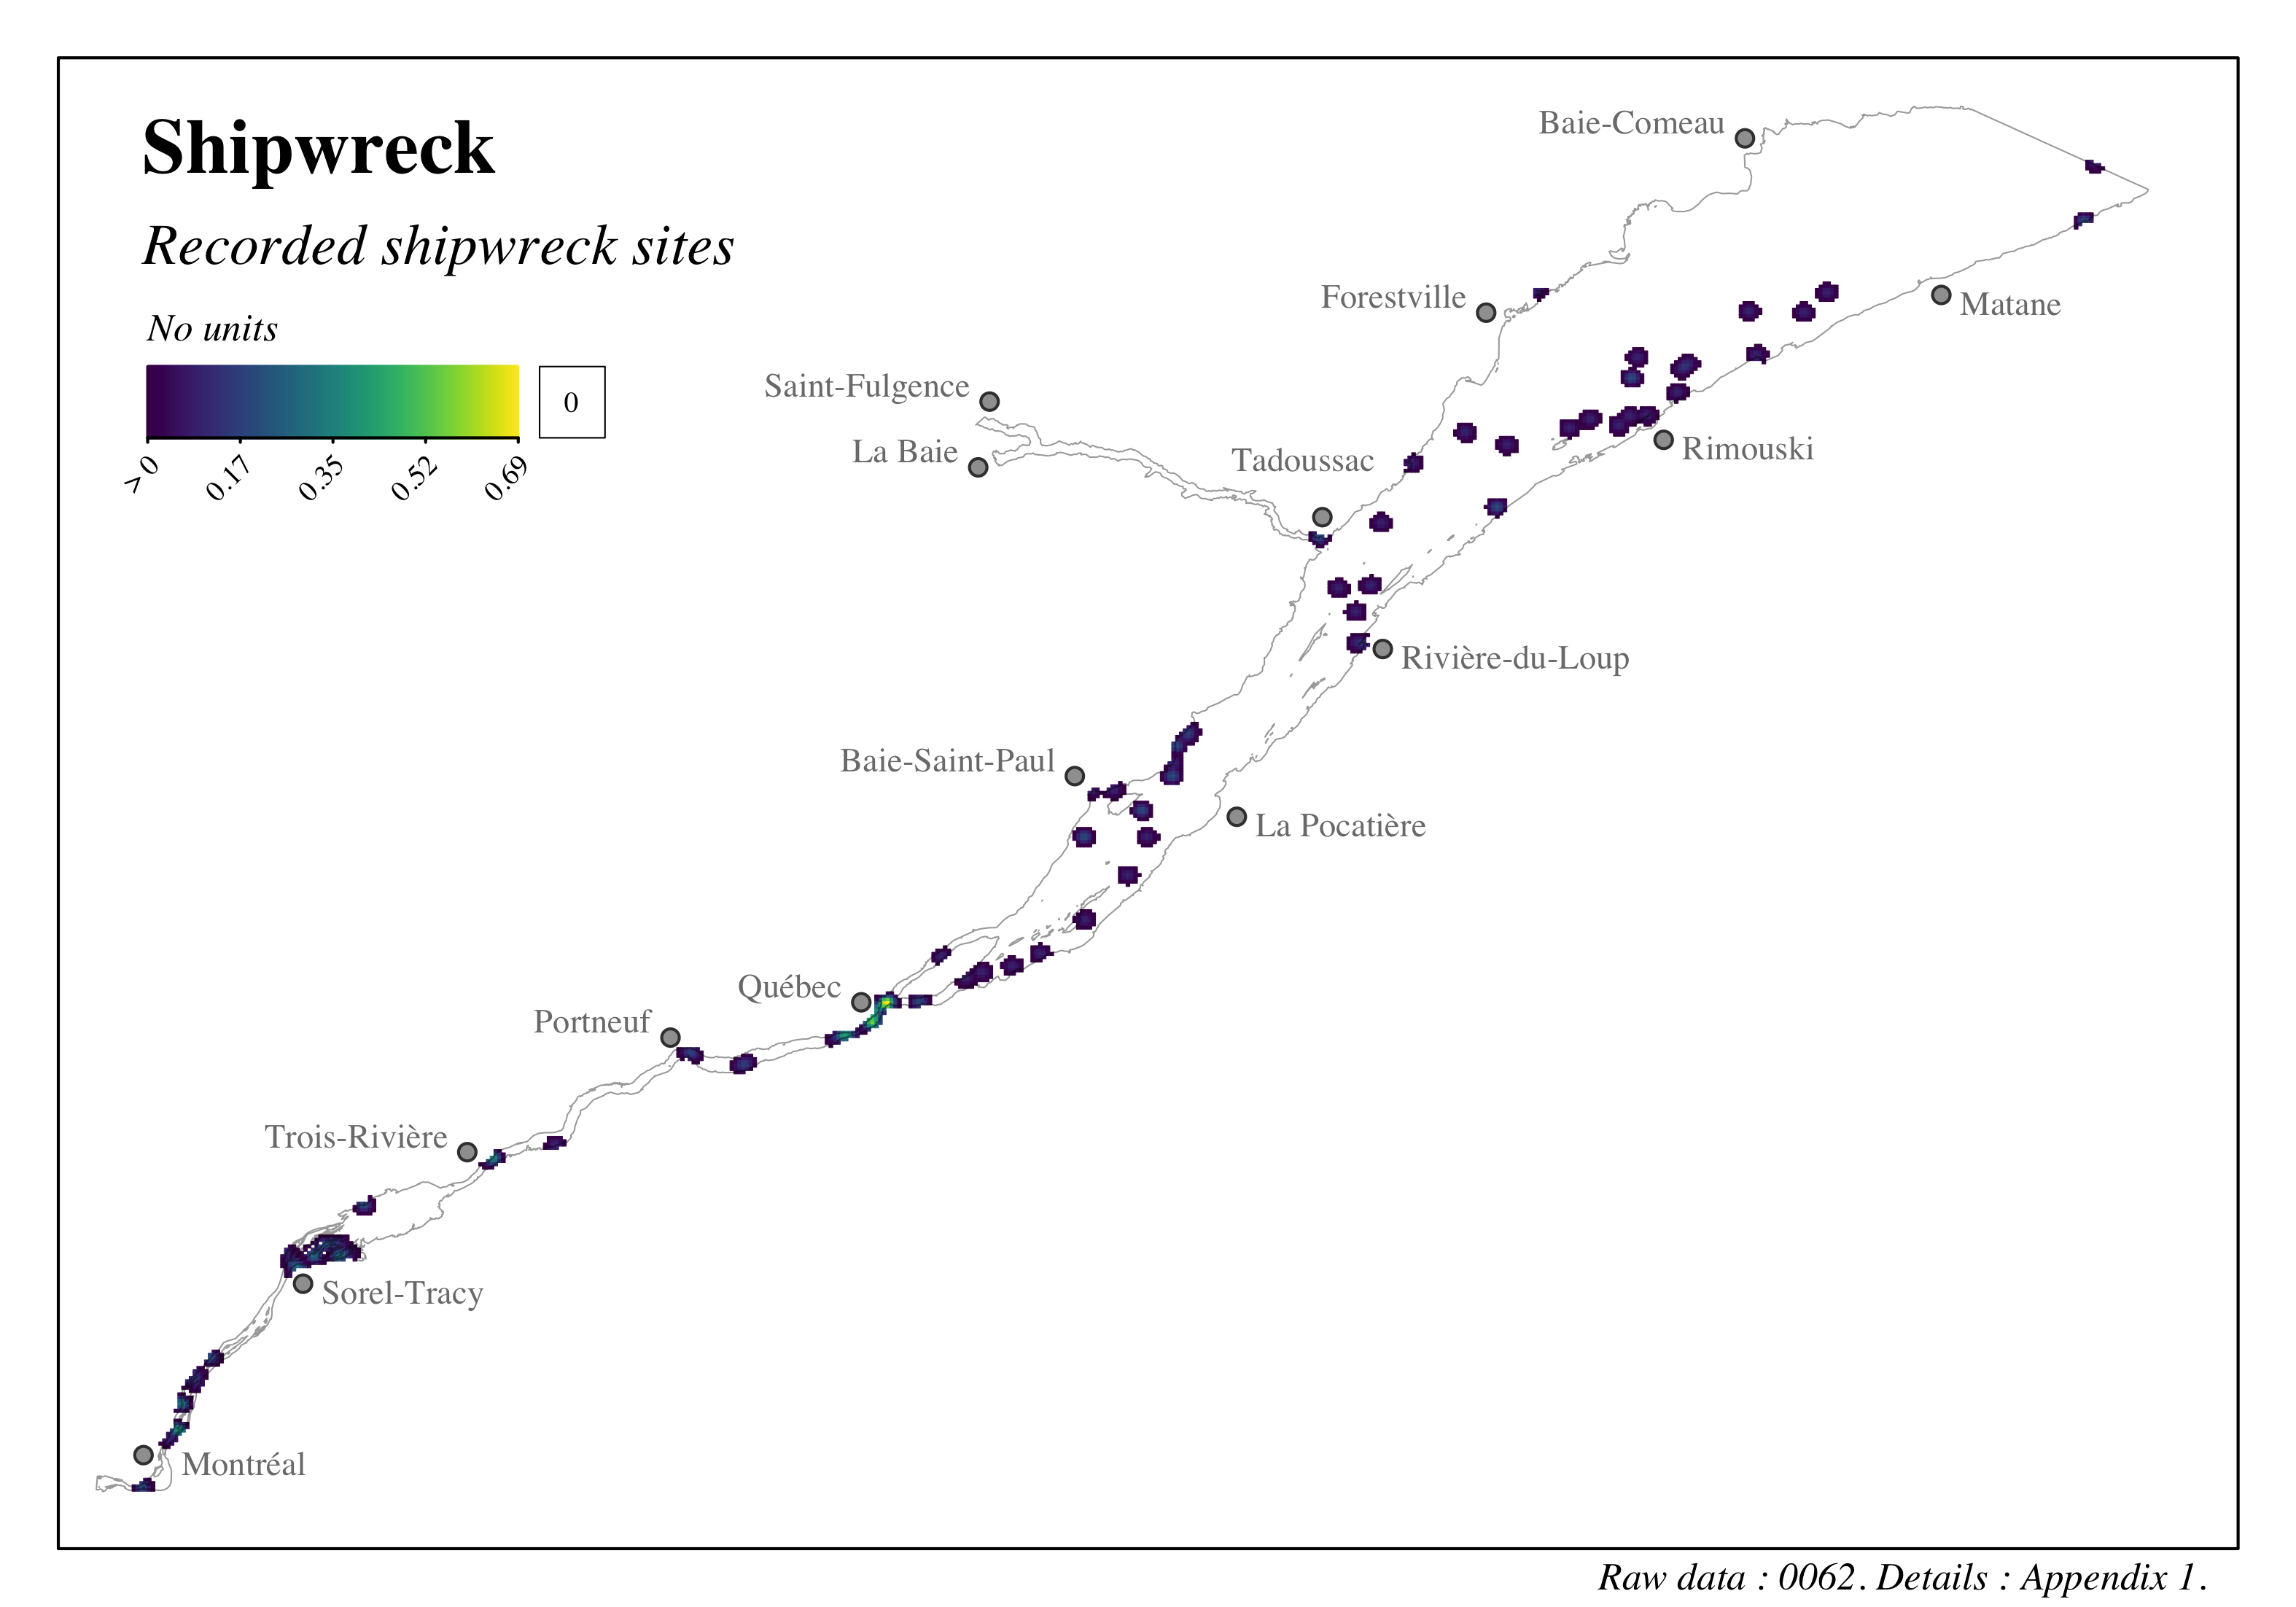
Figure 4.8: Distribution of known shipwreck sites in the St. Lawrence and the Saguenay river
4.2.5 Shipping
We thank Clément Chion and Jean-François Sénécal of the Université du Québec en Outaouais, Jeff Campagnola of Transport Canada and Samuel Turgeon of the Saguenay-St. Lawrence Marine Park for the discussions and support.
The unique identifiers given to the data presented in this section are: 0020, 0021, 0028, 0041, 0047. Refer to the following section and to Appendix 1 for more details on these data.
The intensity of shipping within the study area was assessed using satellite data from the Automatic Identification System (AIS) developed by Maerospace Corporation and acquired for the Canadian Space Agency (Canada, 2020b, 2020a). This database contains 10729683 vessel locations (3576561 \(\pm\) 1379216 observations per year) for 3347 vessels between 2017 and 2019. It is important to note that this number does not indicate the number of transits, but rather the number of geographic locations identified by the AIS.
Individual location data were transformed into linear shipping segments representing individual and continuous vessel transits, assuming a straight line transit between successive locations. Vessels were identified by their Maritime Mobile Service Identity (MMSI) number. All available locations were used for each vessel to plot their movements within the study area. Since vessels may enter and exit the study area, or stay in berth for longer periods of time, vessel movements were segmented into a number of individual linear segments. Segmentation was performed when two consecutive locations were over 5 hours or more than 80.5 km apart. Linear segments overlapping the land environment at a distance of over 2 km were removed from the database. This arbitrary distance of 2 km was used to remove outlier segments from the database, while still keeping segments describing coastal shipping or vessels frequenting port facilities. This segmentation resulted in 93056 linear shipping segments. Since a number of vessel types navigate the waters of the St. Lawrence and Saguenay rivers, we considered 9 different vessel categories to complete the characterization of shipping intensity in the study area (Table 4.8). Among the available categories, we removed the Other category due to its lack of specificity and the Fishing category since few transits were available in the database.
To characterize shipping, we used an intensity index characterizing shipping in terms of single use – or transits. For each vessel category, we assessed shipping intensity within the study area by the number of shipping segments that intersect each 1 \(km^2\) cell of the study grid between 2017 and 2019. This index results in an assessment of shipping intensity expressed as number of vessels (\(n\)) per \(km^2\) (\(n\) \(vessels\) \(*\) \(km^{-2}\))
Despite the effort to segment and remove impossible transits, some impossible transits may still remain. For example, a very small number of transits is observed north of Île d’Orléans for cargo shipping (Figure 4.10); these transits could not be removed by the automatic segmentation that was done and the total number of transits makes it impractical to remove them manually. However, there are very few of the impossible transits in the database, so this does not affect the final results of the cumulative effects assessment of marine vessel activities in the study area.
| Ship type | Ships | Locations | Tracks |
|---|---|---|---|
| Cargo | 385 | 588245 | 7729 |
| Containers | 156 | 583621 | 4087 |
| Dry bulk | 1424 | 2169379 | 22143 |
| Government / research | 91 | 770295 | 10766 |
| Passenger / ferry / ro-ro | 178 | 2675841 | 27223 |
| Pleasure vessels | 67 | 86338 | 613 |
| Special ships | 17 | 73796 | 941 |
| Tanker | 880 | 1188739 | 11793 |
| Tugboat / port | 149 | 3331817 | 14445 |
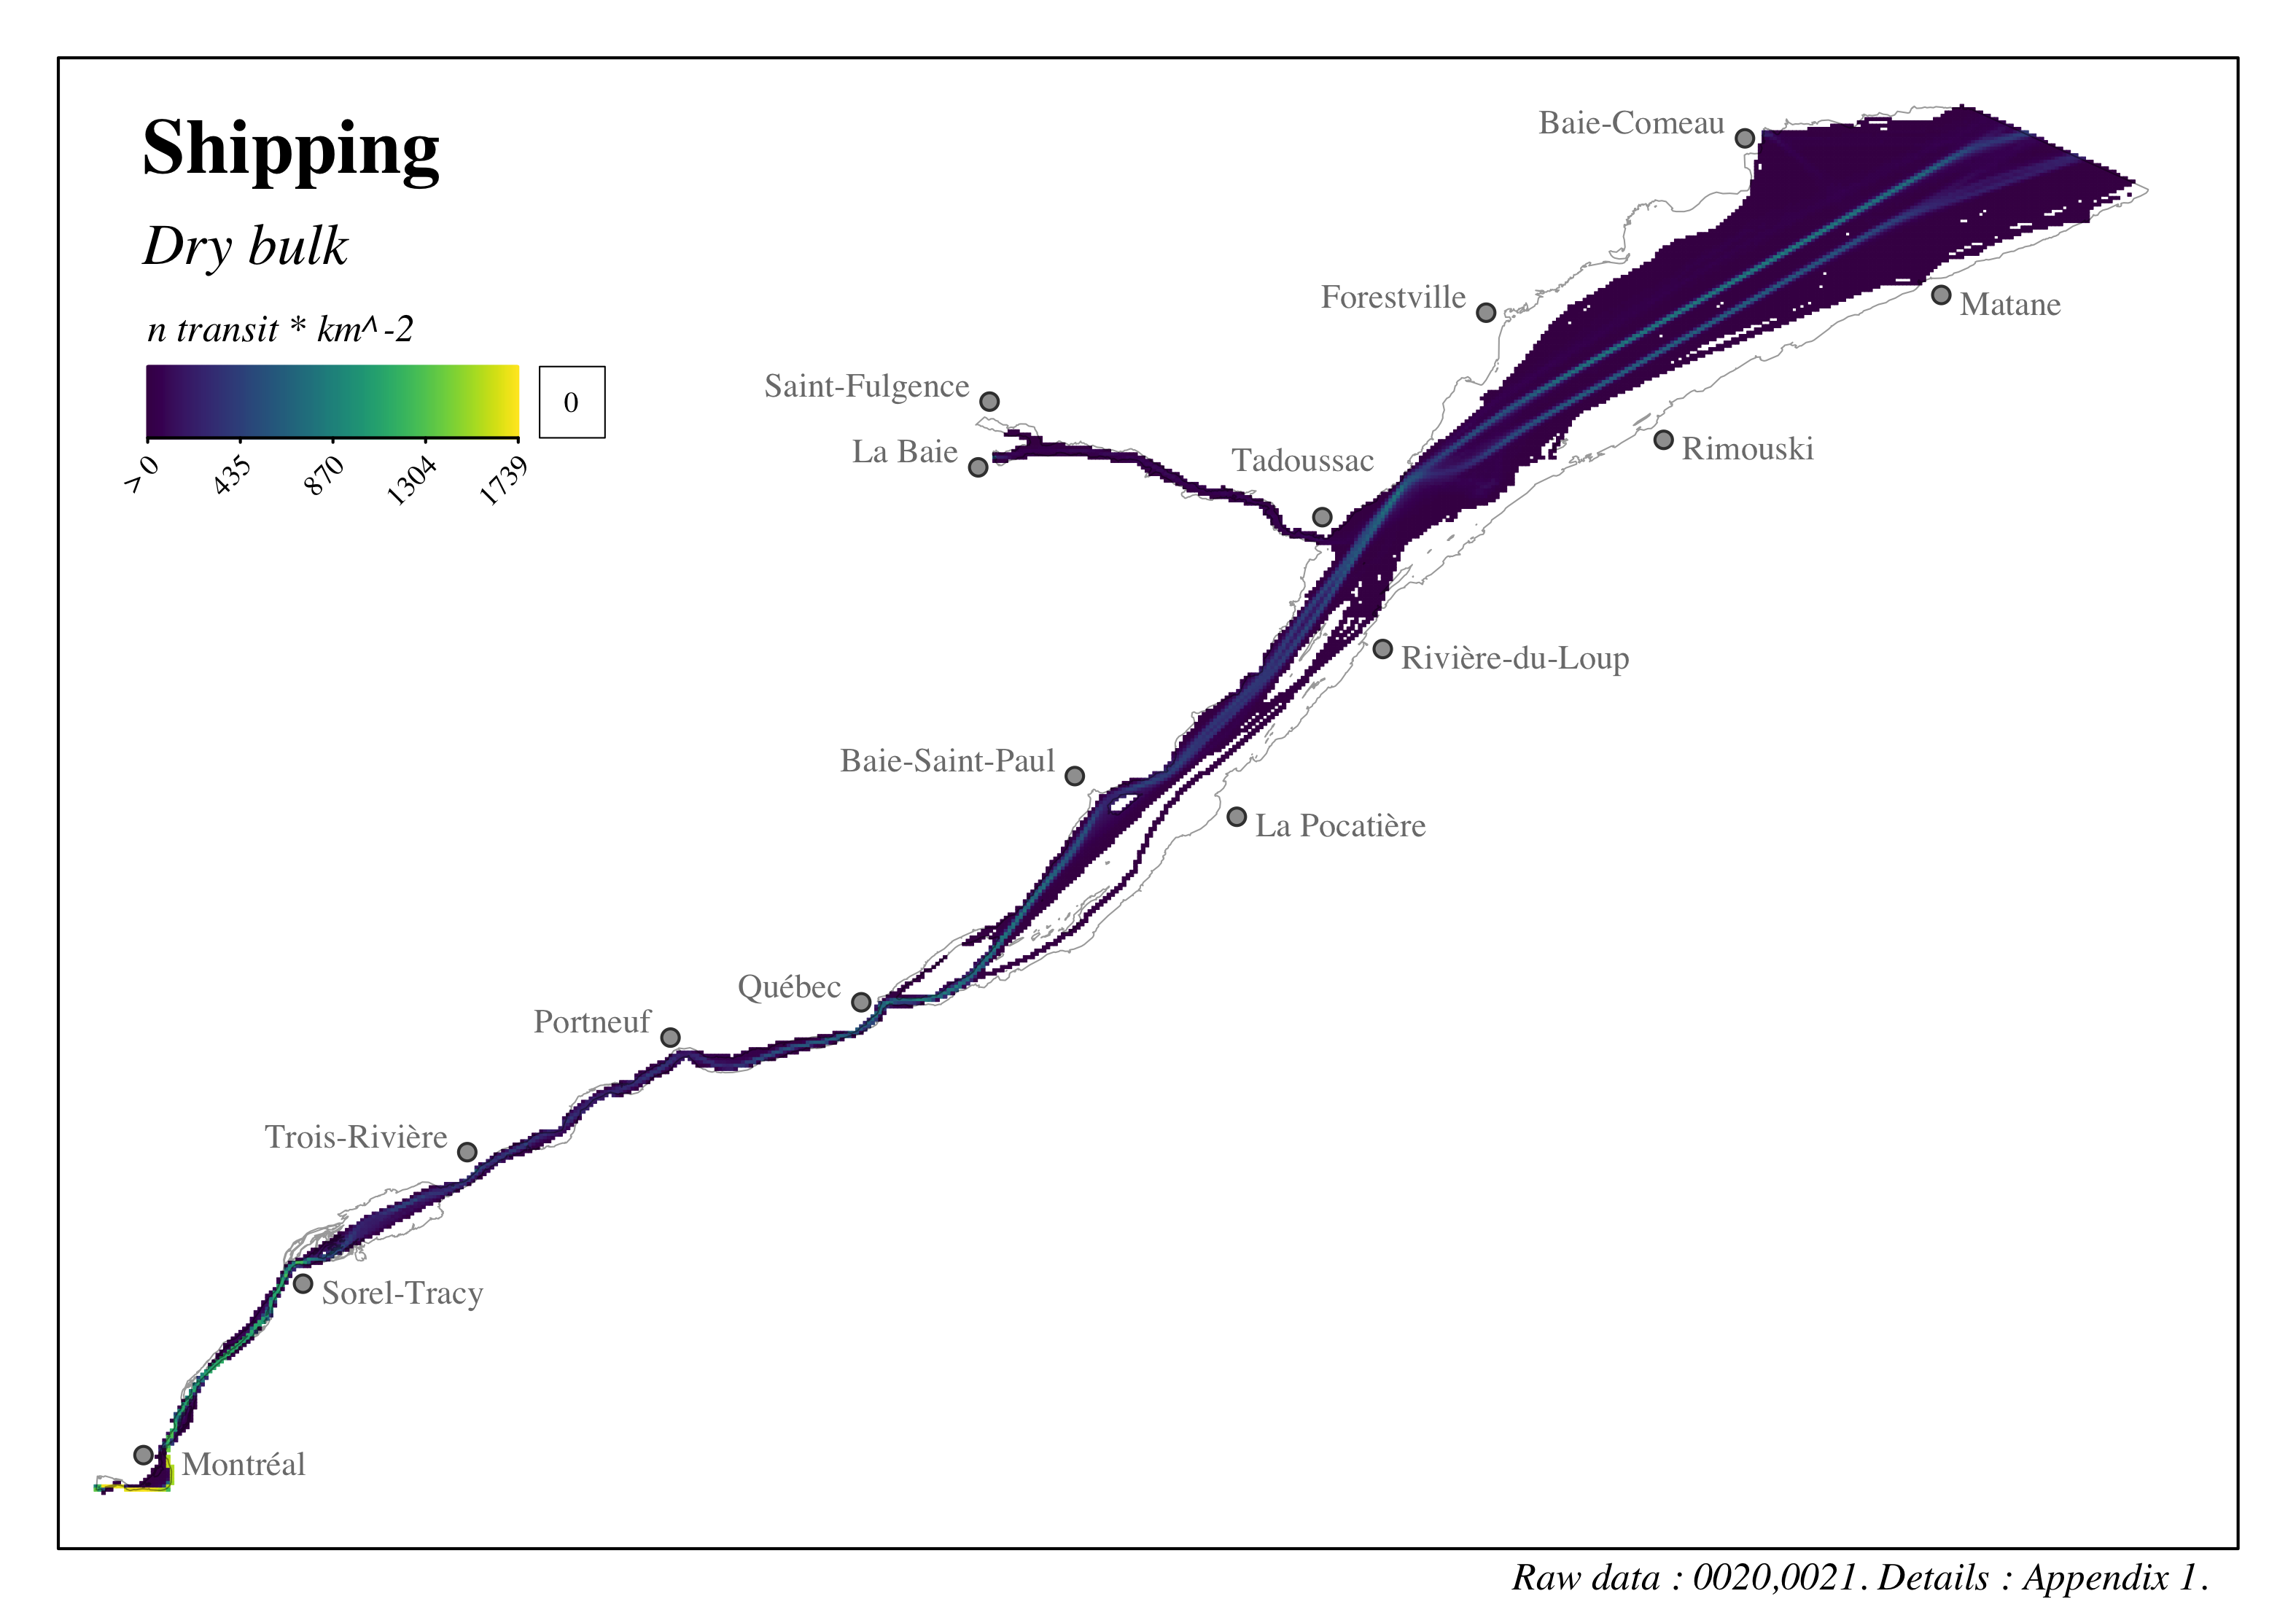
Figure 4.9: Distribution and intensity of shipping in the St. Lawrence and the Saguenay river - Dry cargo

Figure 4.10: Distribution and intensity of shipping in the St. Lawrence and the Saguenay river - Cargo
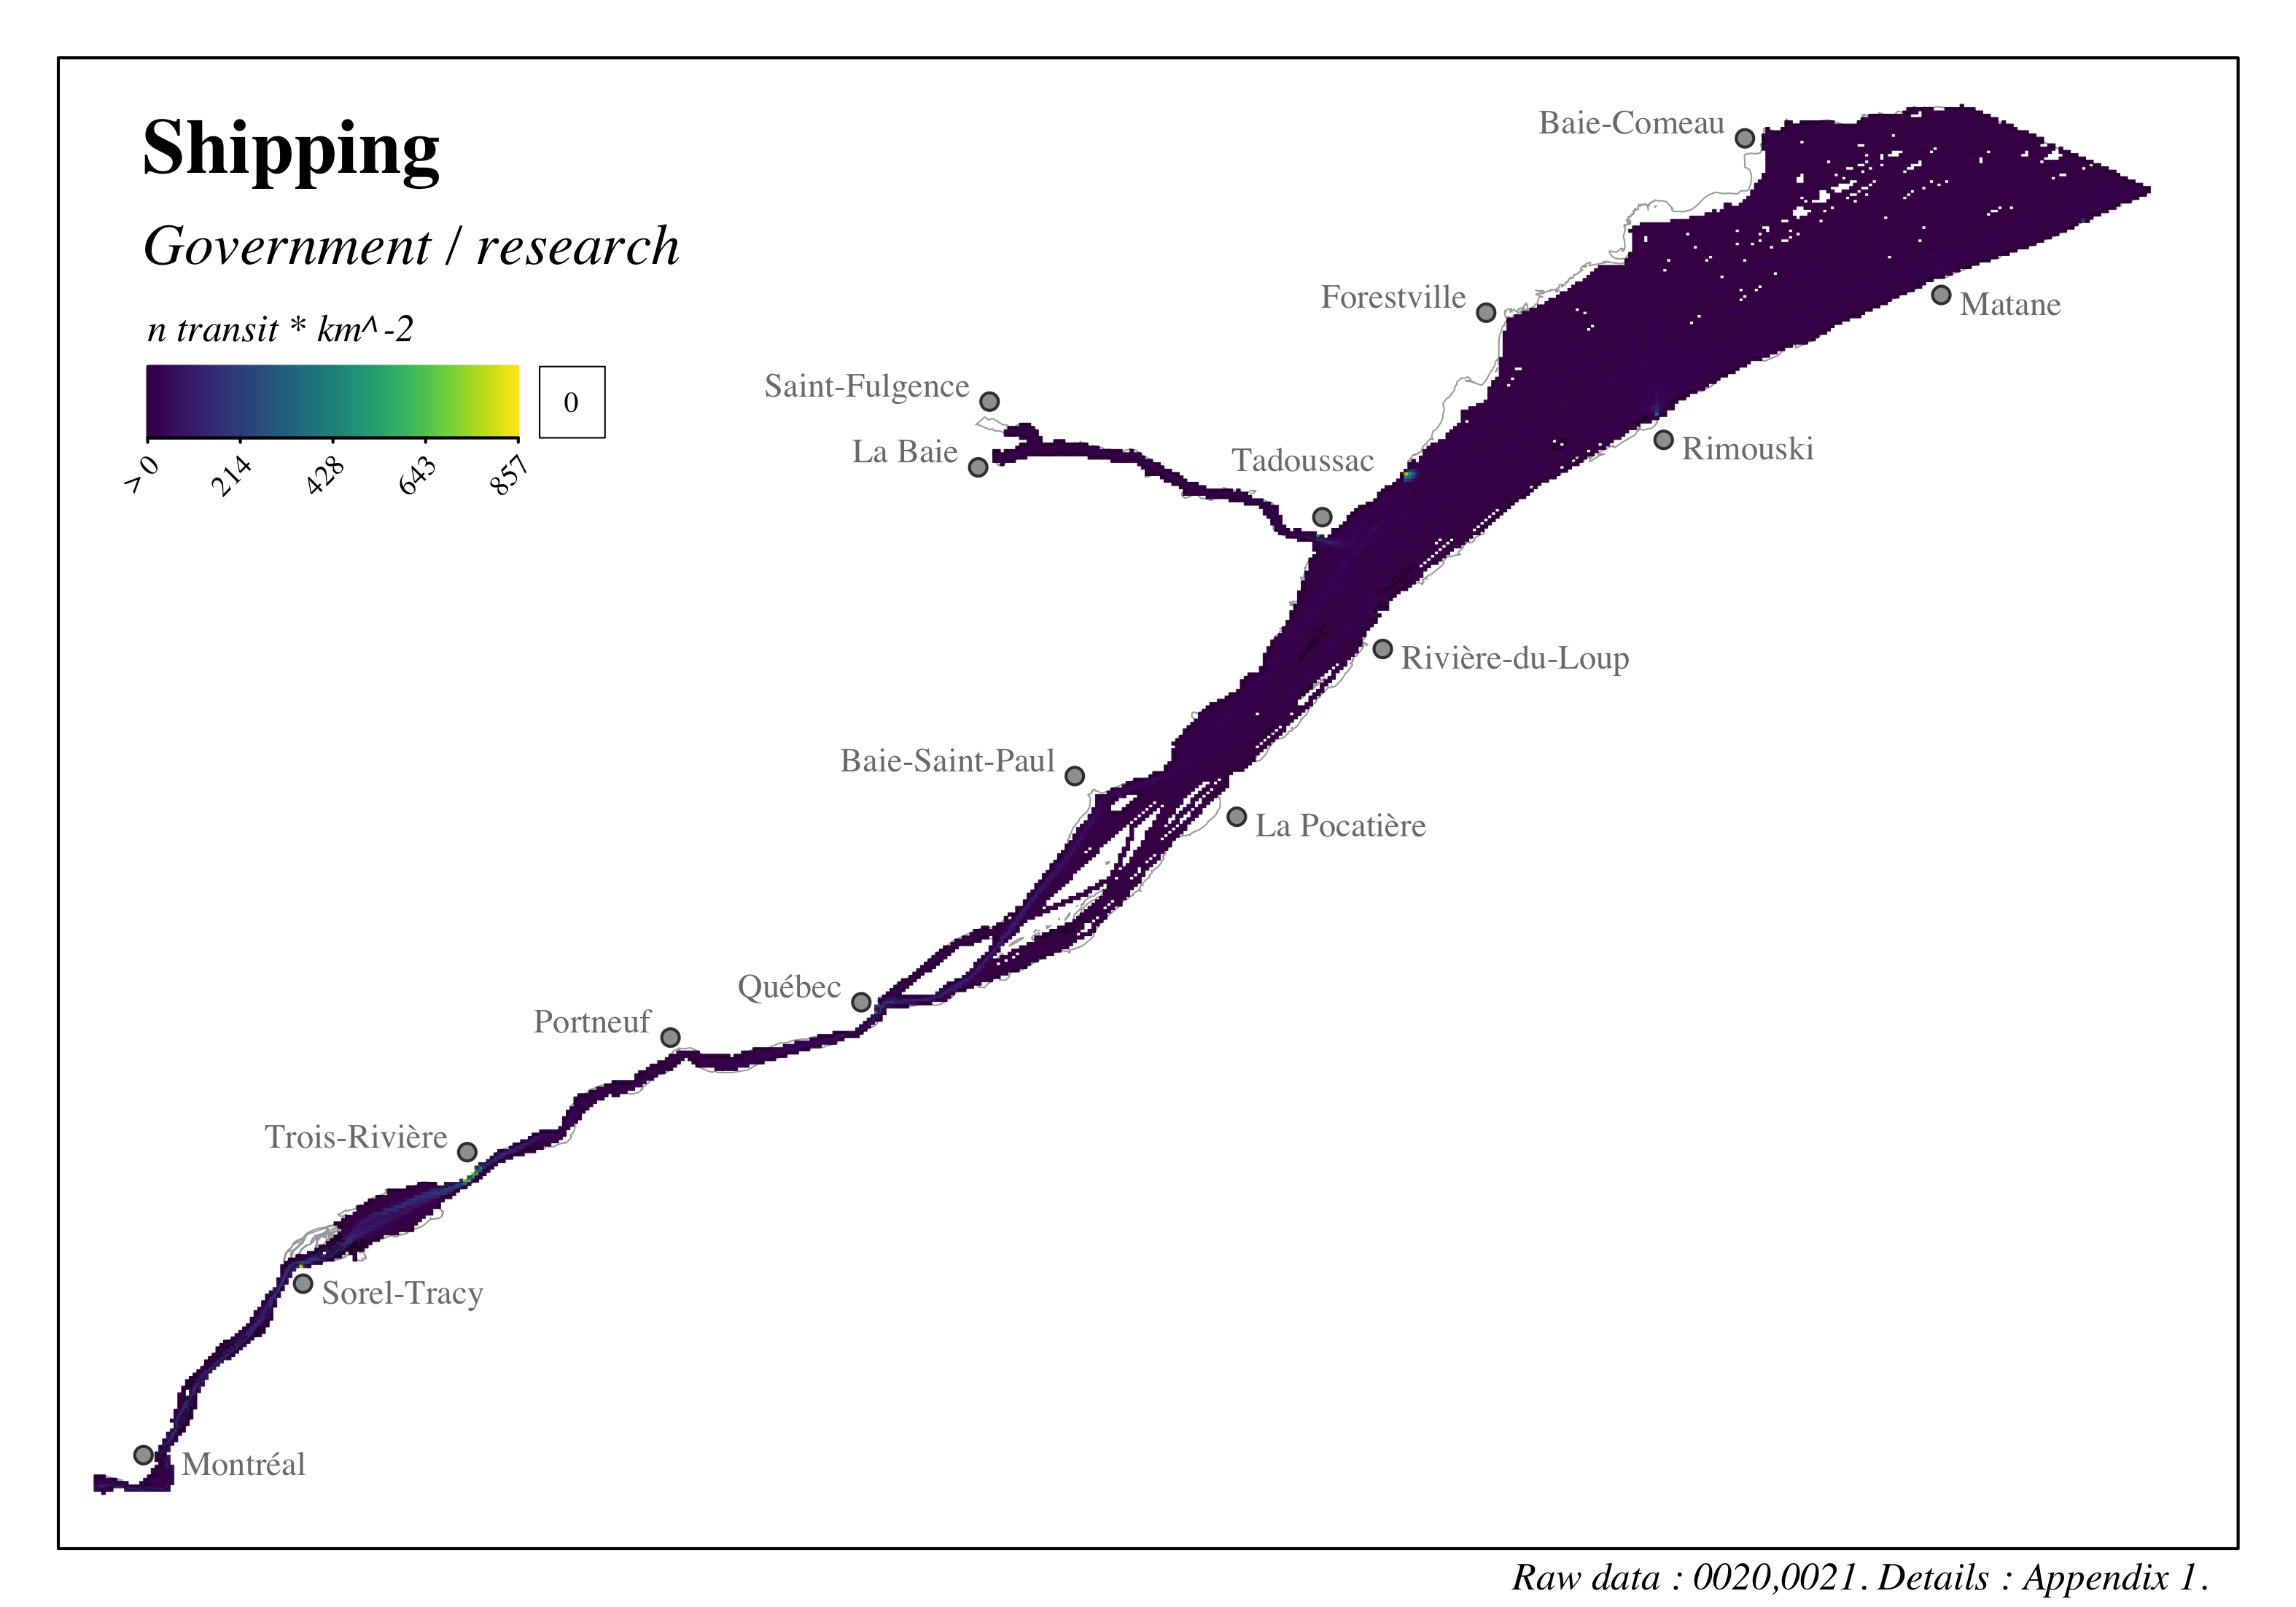
Figure 4.11: Distribution and intensity of shipping in the St. Lawrence and the Saguenay river - Government / research
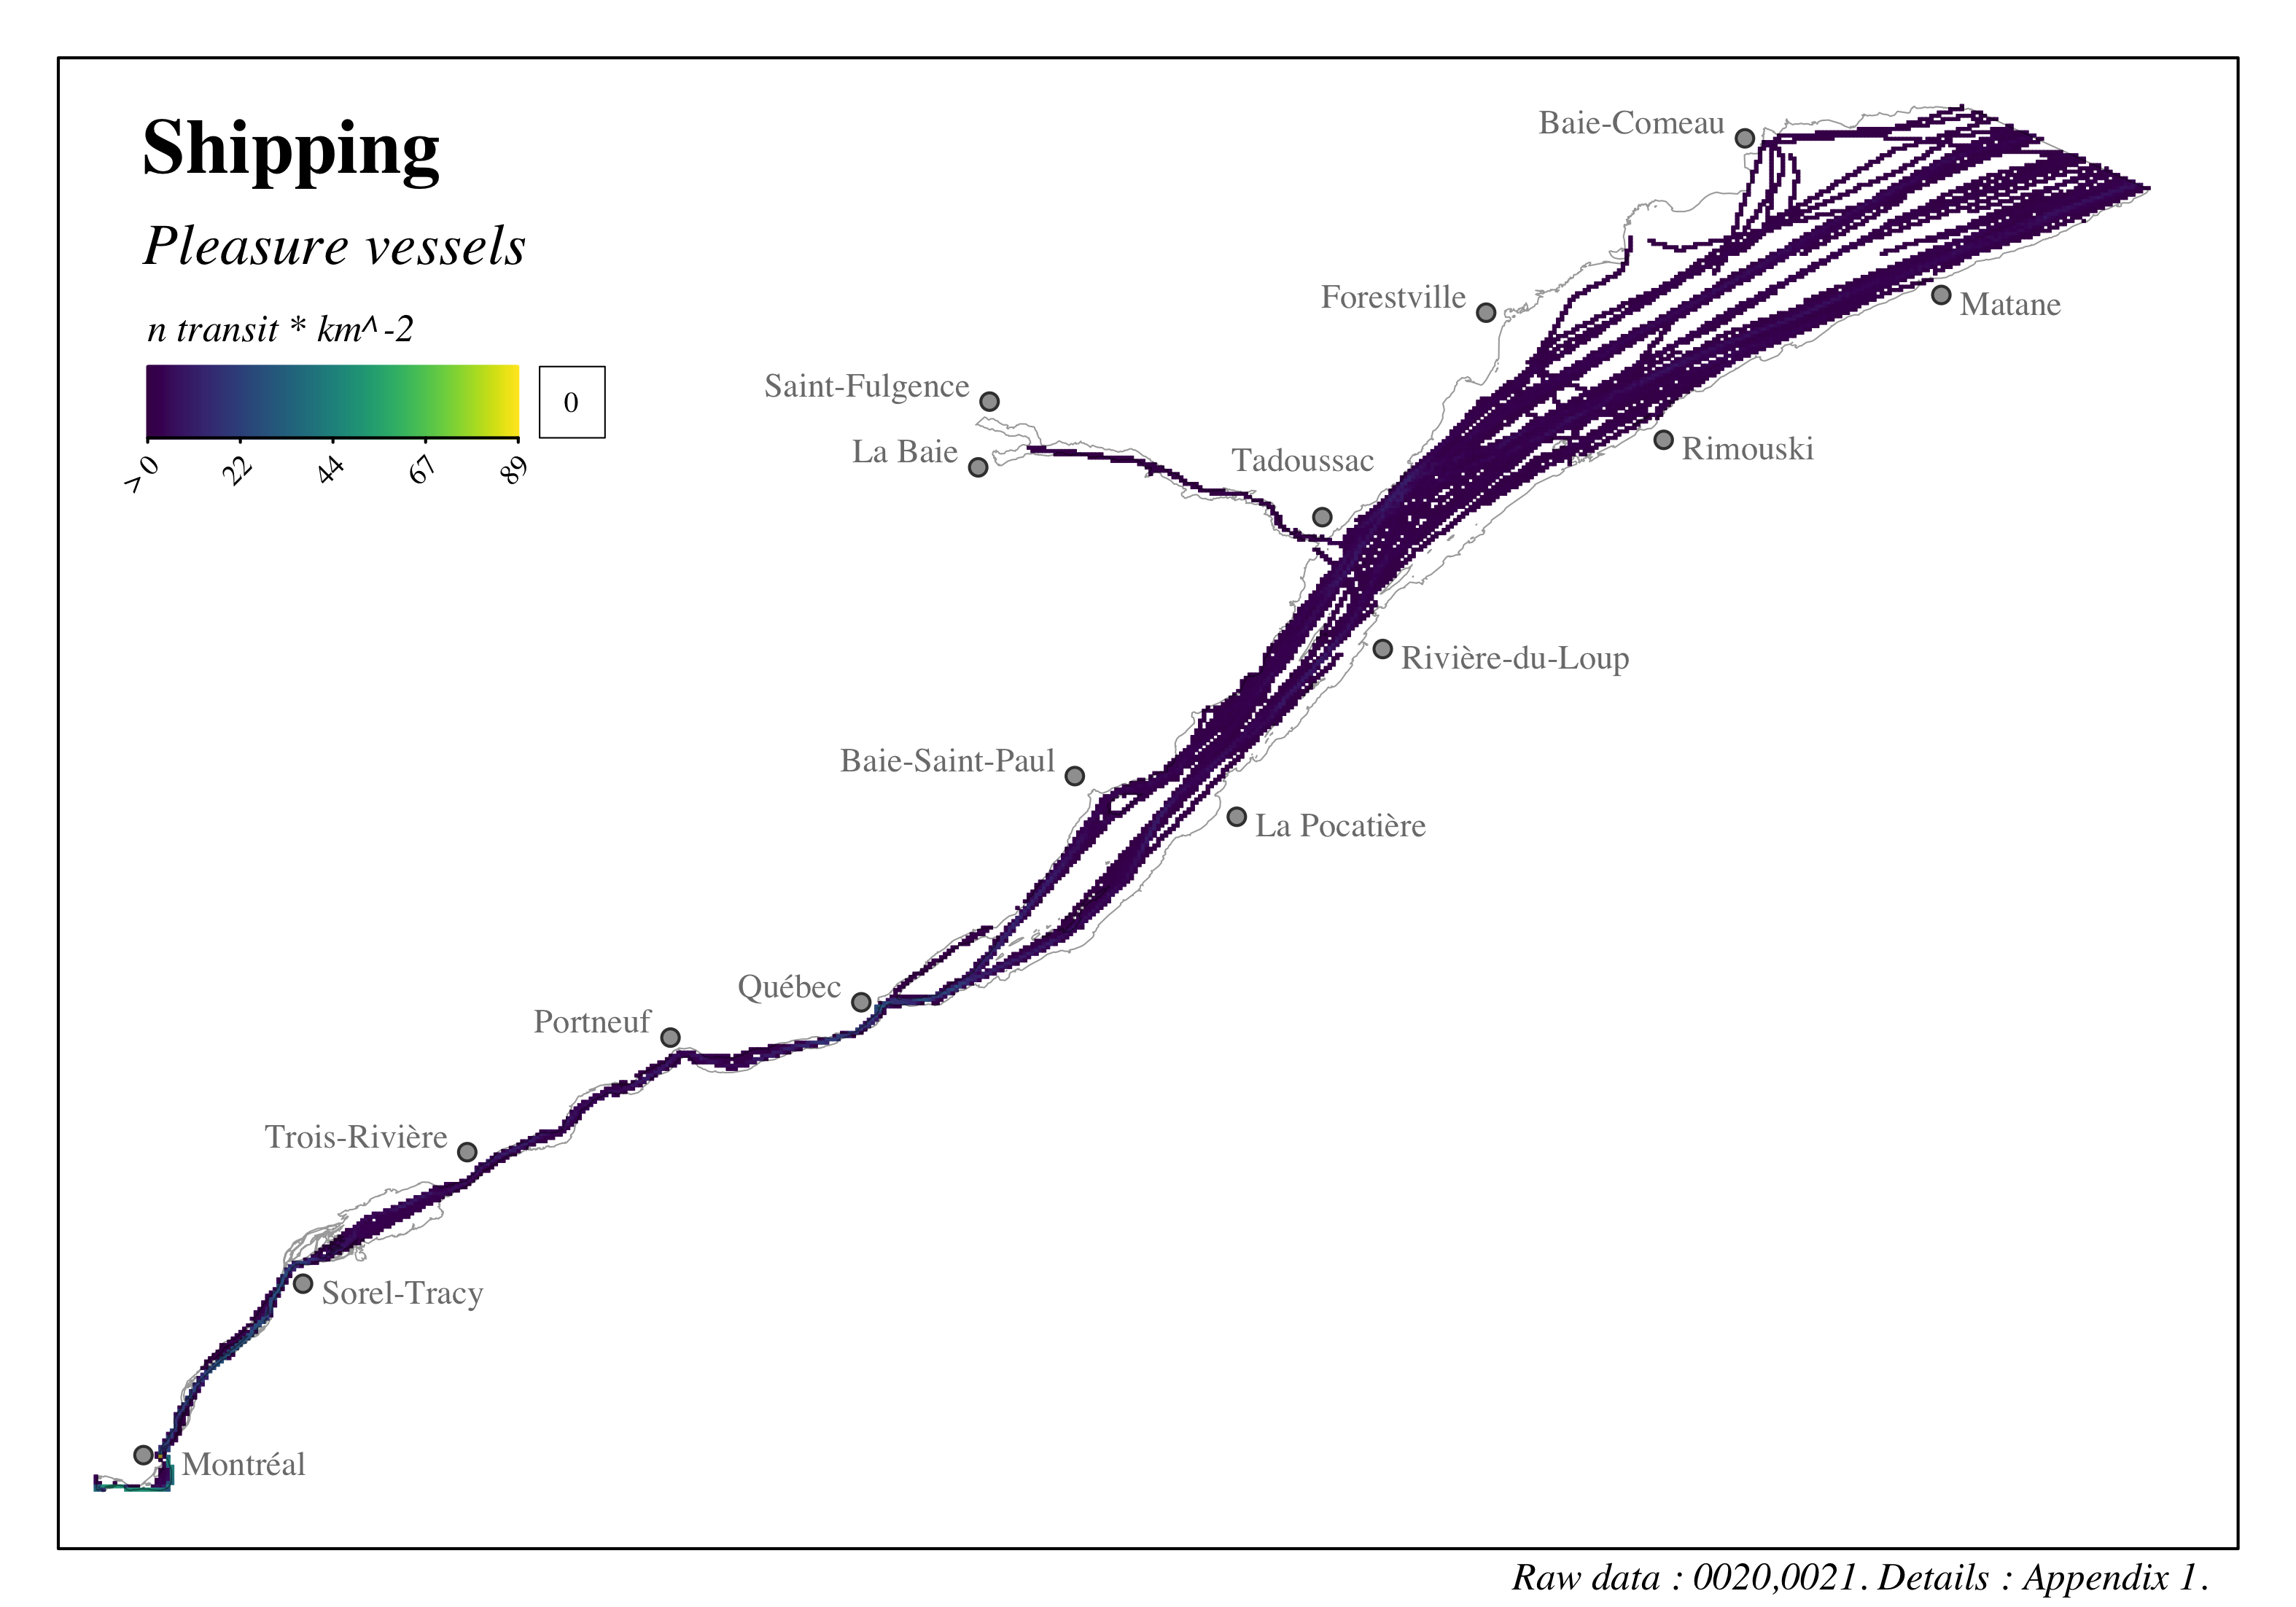
Figure 4.12: Distribution and intensity of shipping in the St. Lawrence and the Saguenay river - Pleasure craft
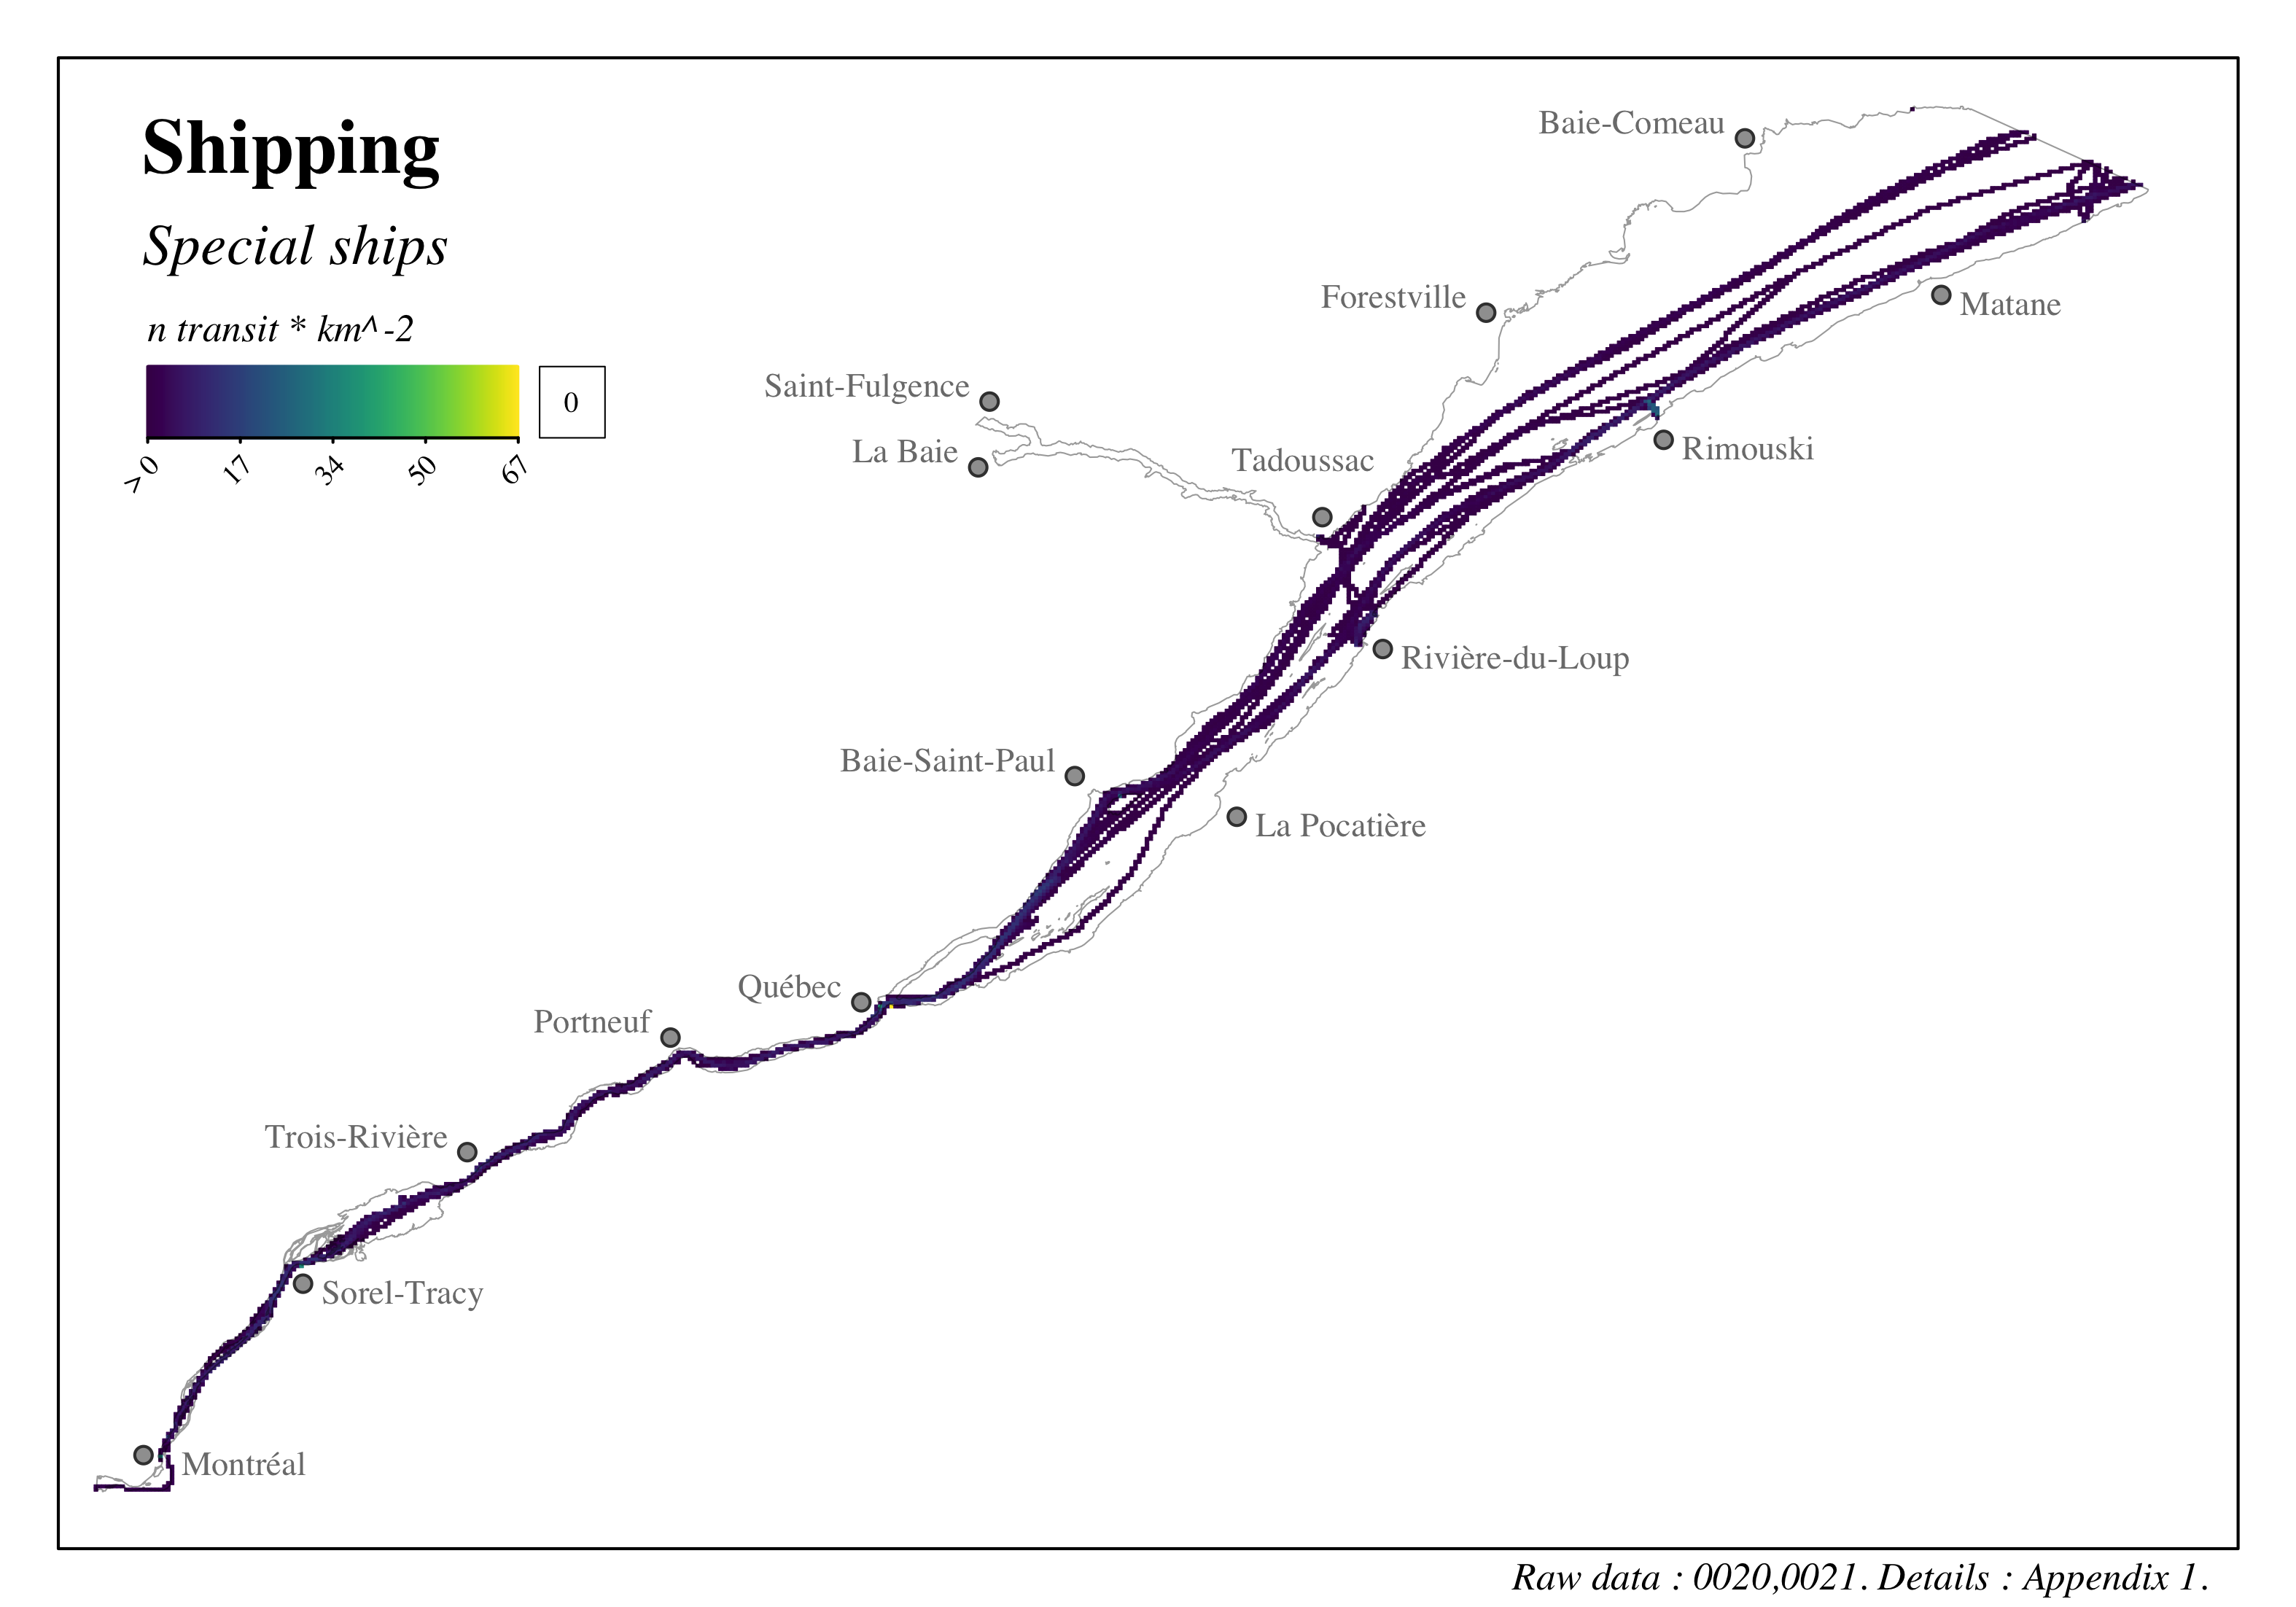
Figure 4.13: Distribution and intensity of shipping in the St. Lawrence and the Saguenay river - Special vessels

Figure 4.14: Distribution and intensity of shipping in the St. Lawrence and the Saguenay river - Passenger / ferry / Ro-Ro
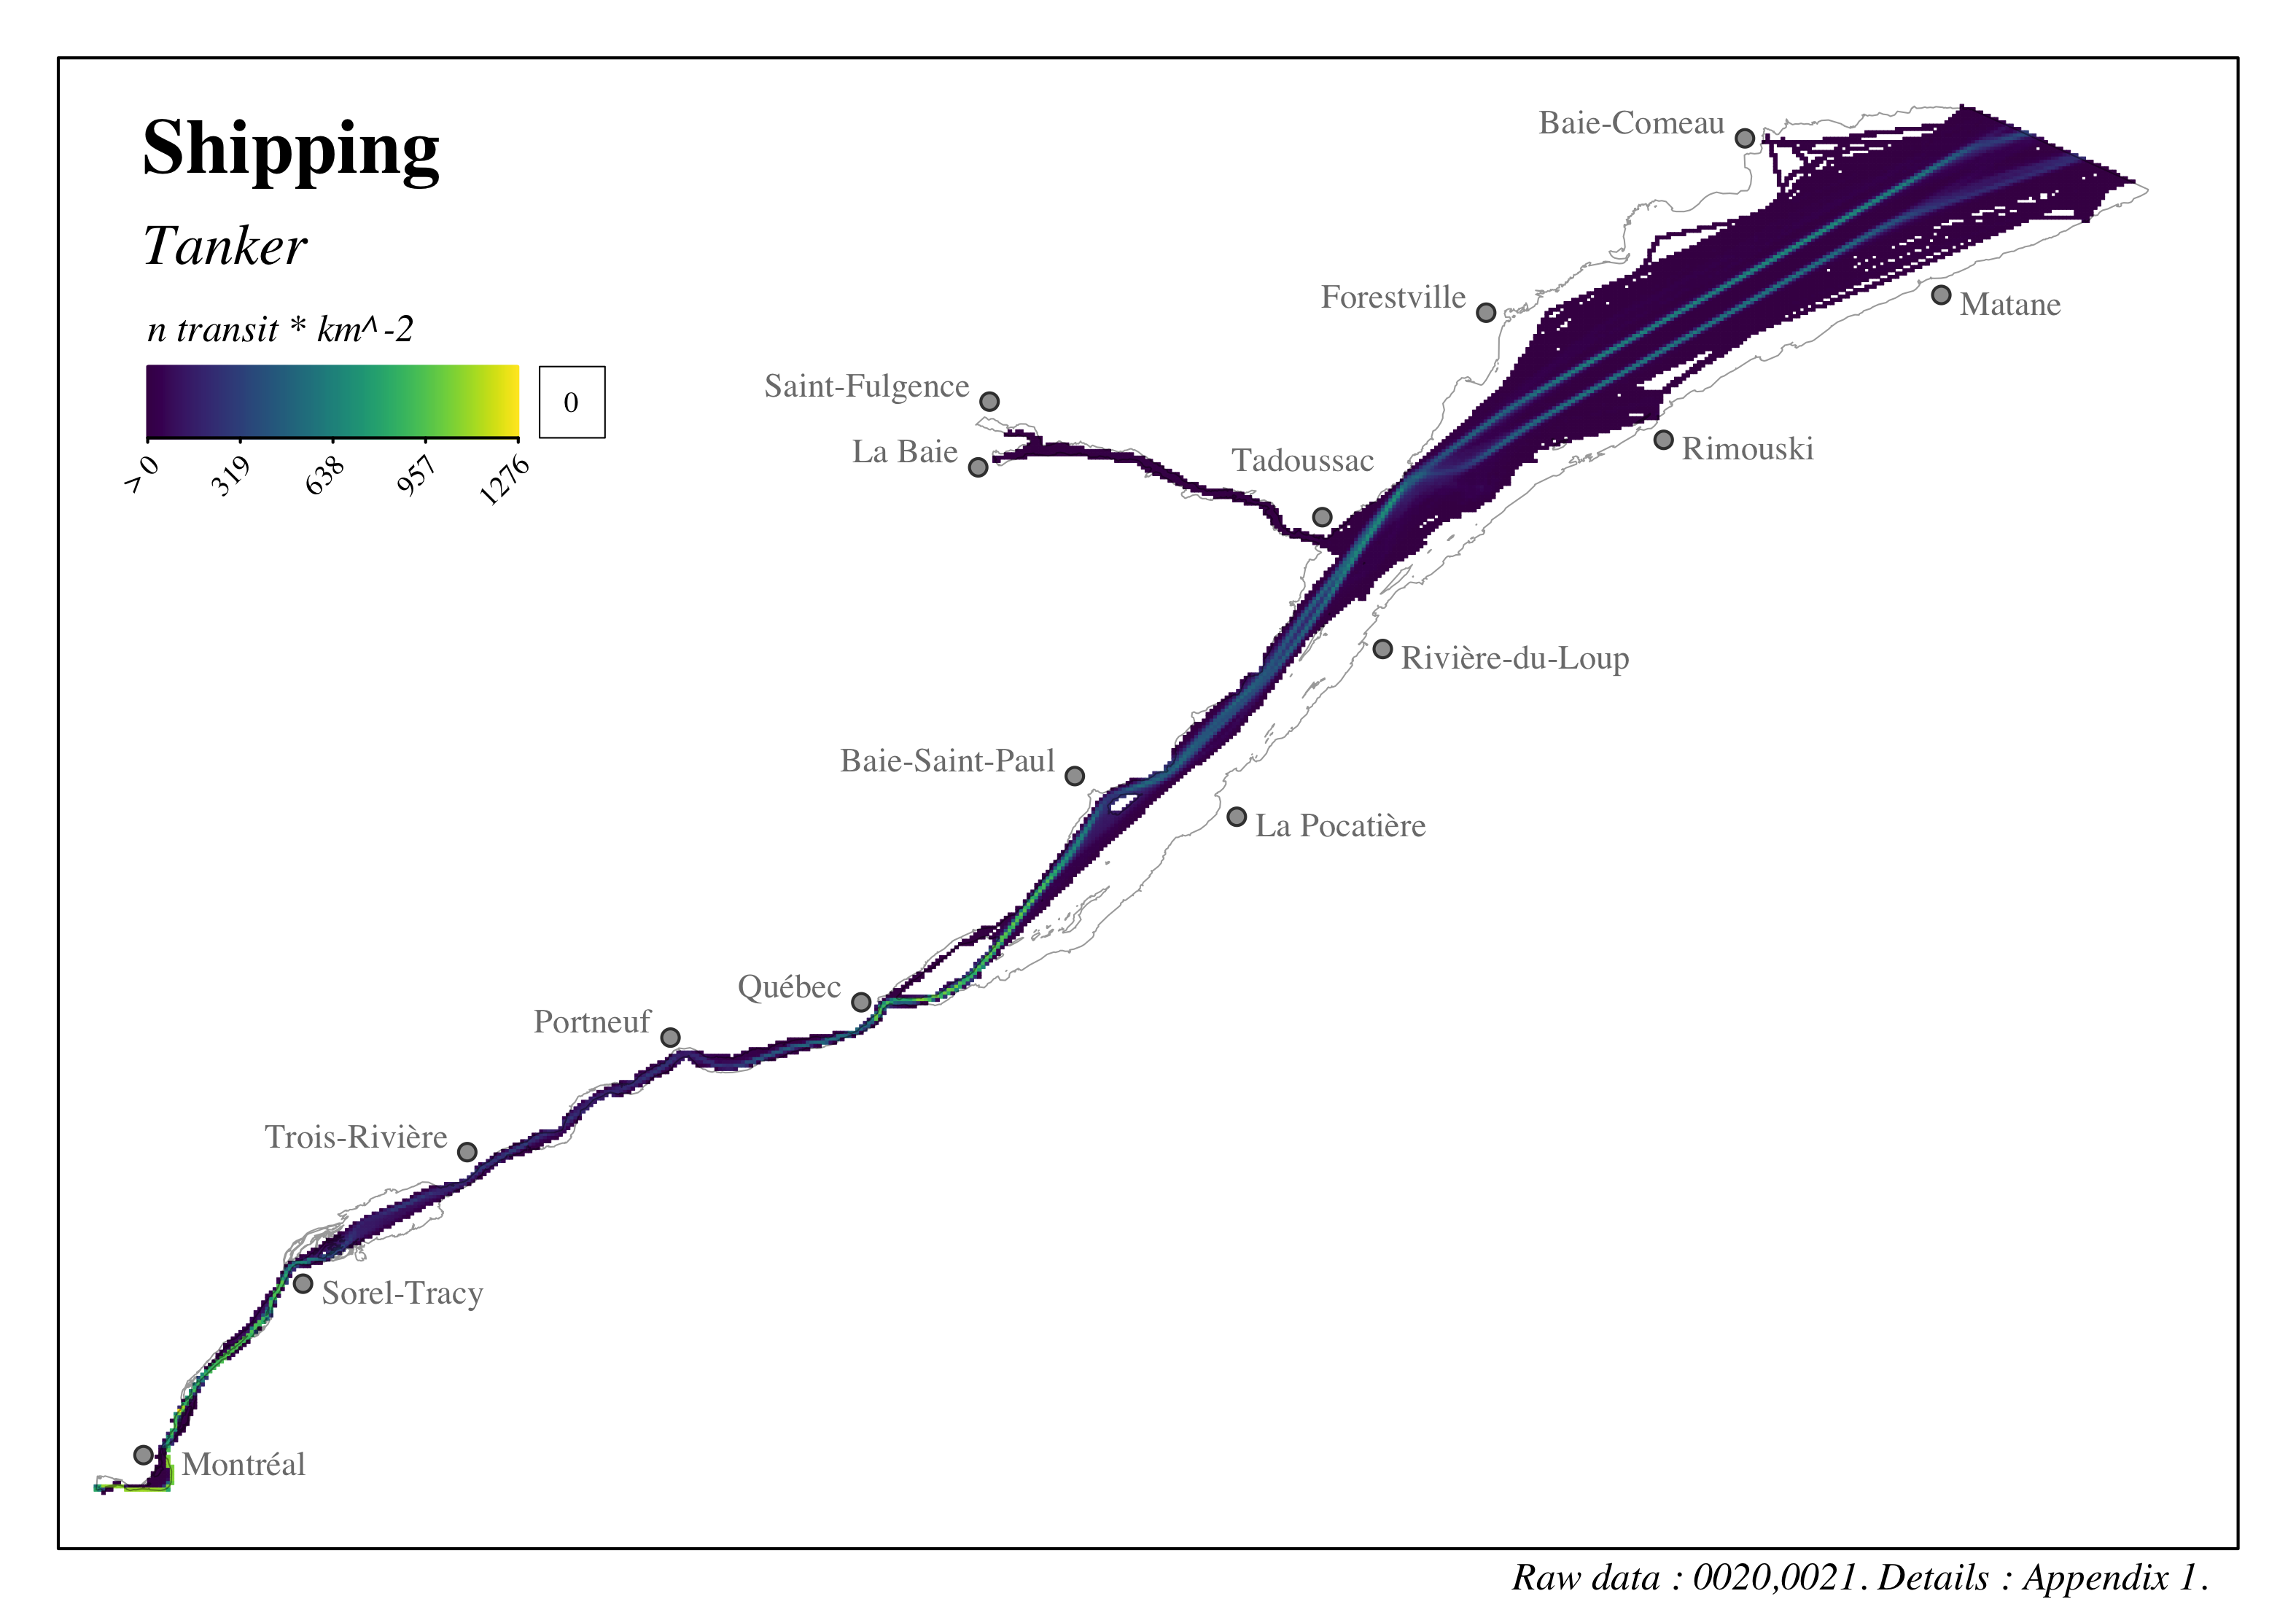
Figure 4.15: Distribution and intensity of shipping in the St. Lawrence and the Saguenay river - Oil tanker
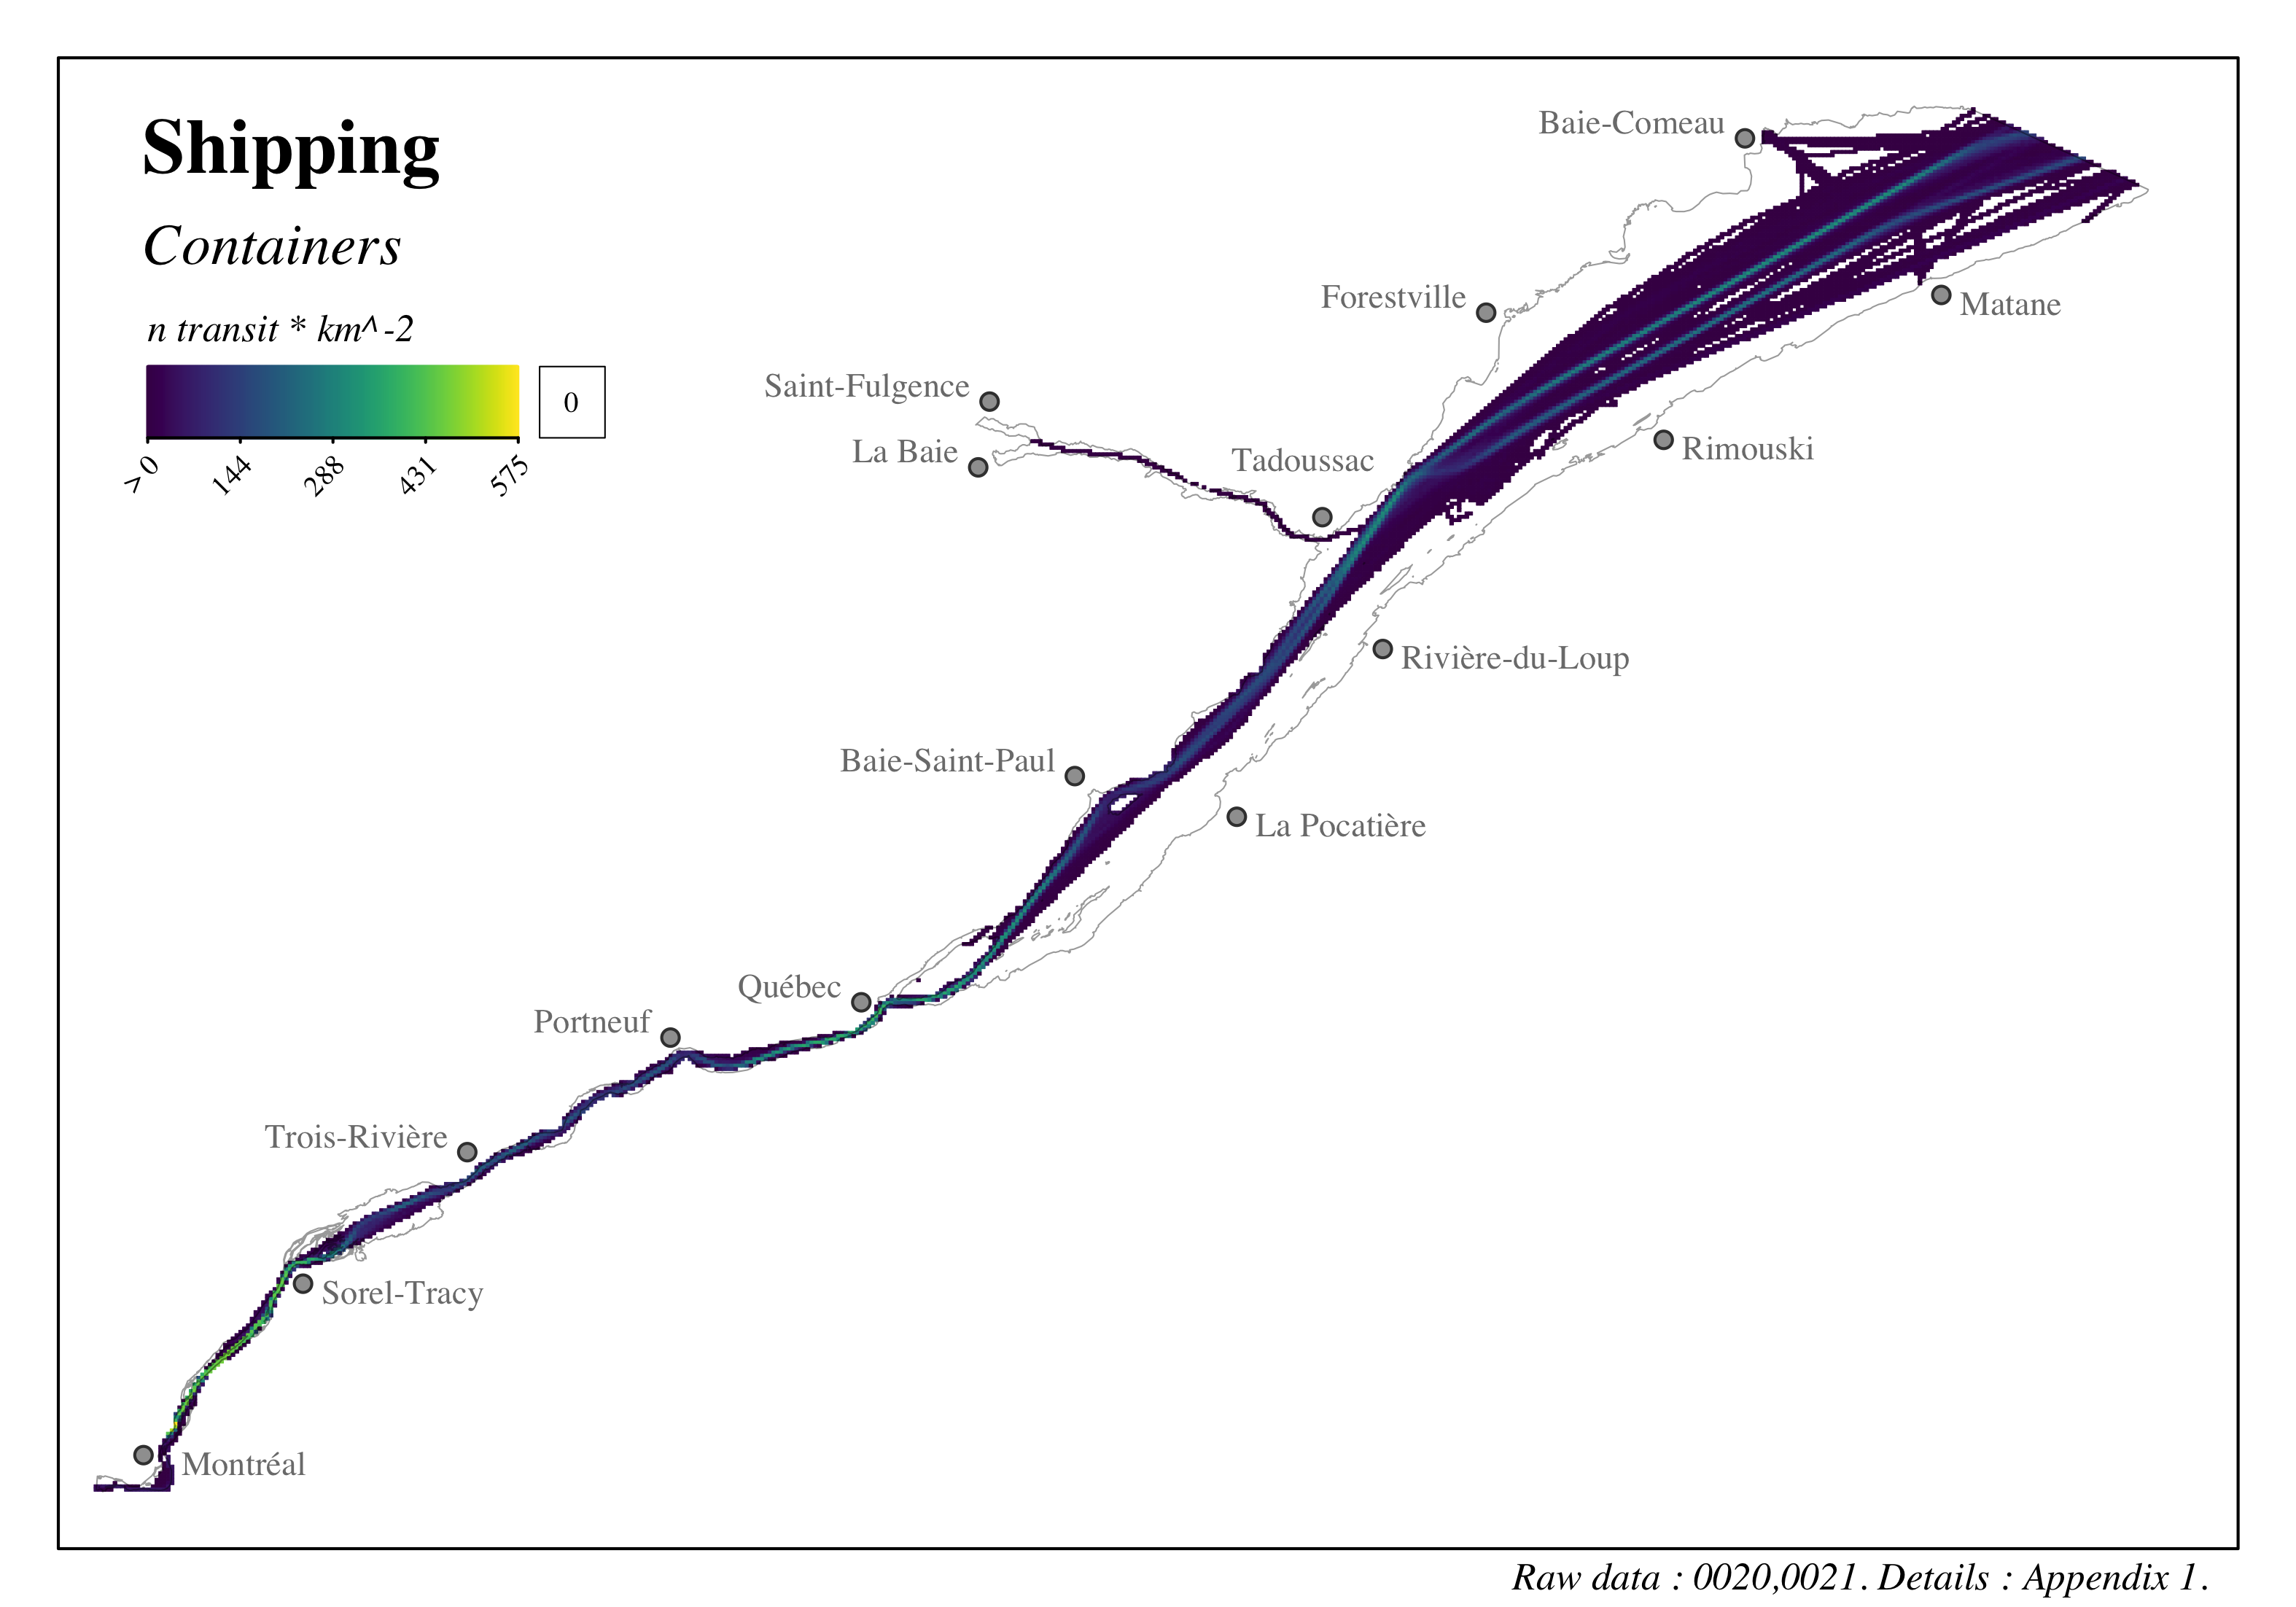
Figure 4.16: Distribution and intensity of shipping in the St. Lawrence and the Saguenay river - Container ships
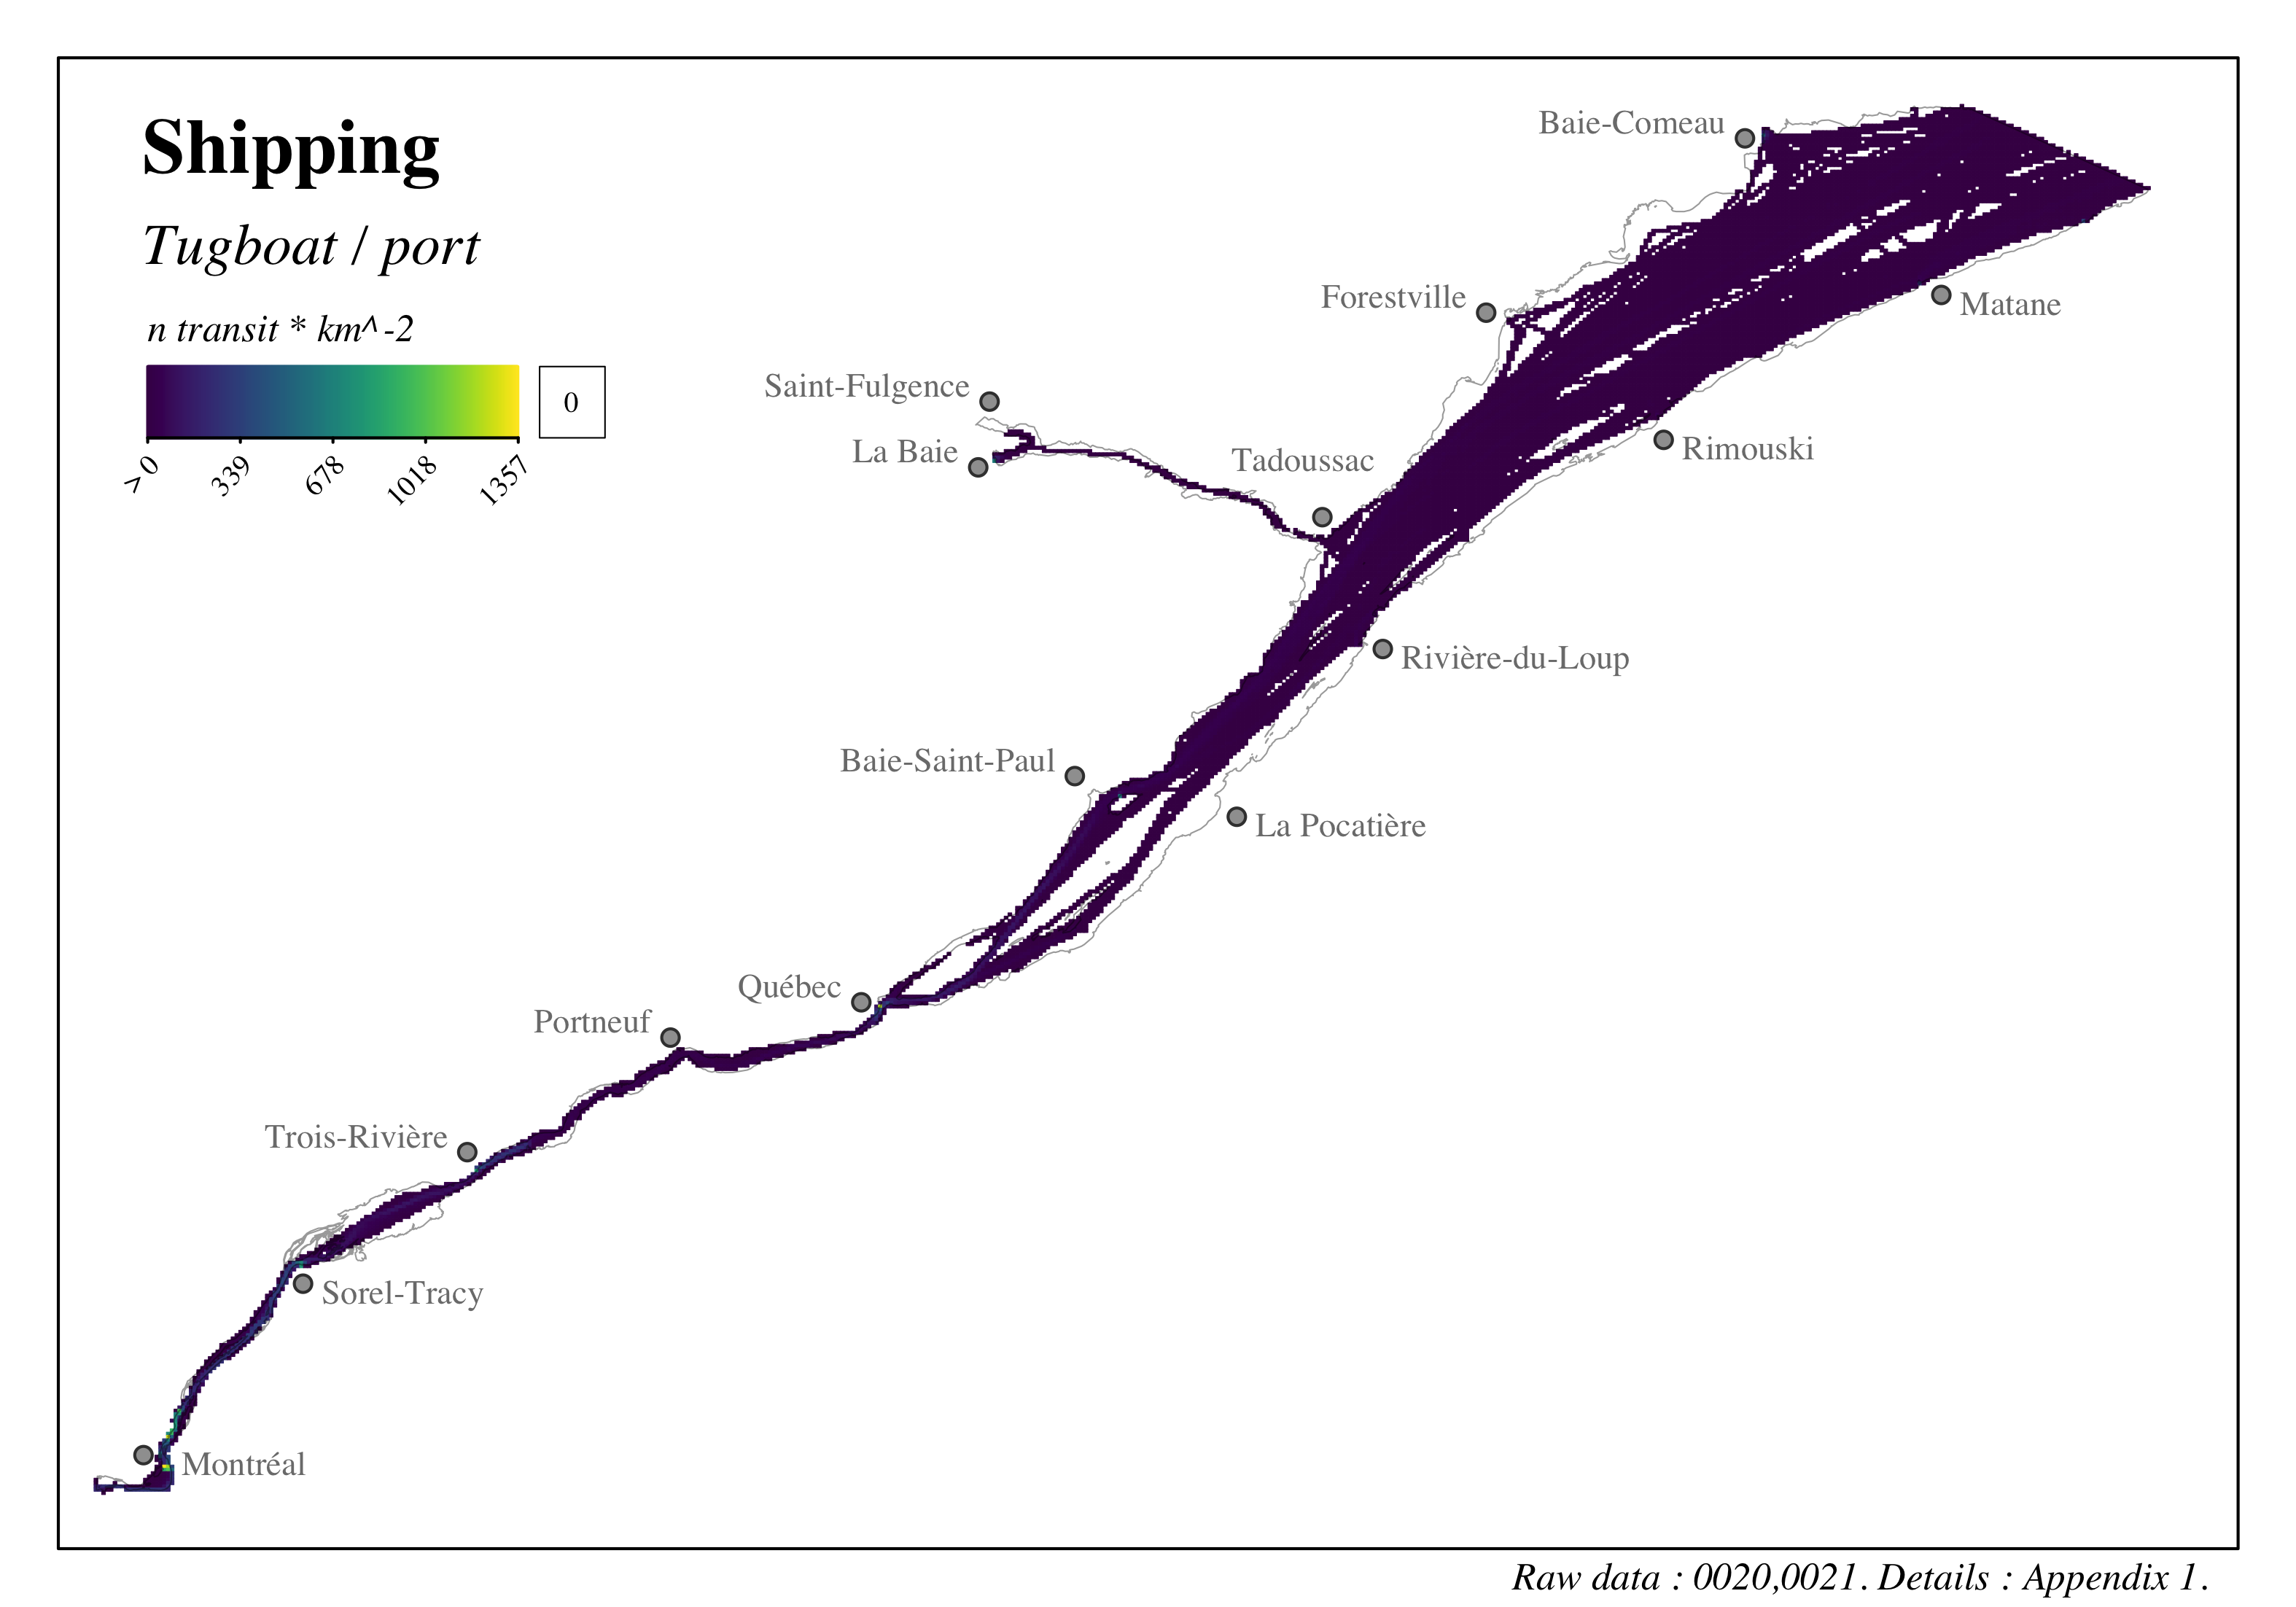
Figure 4.17: Distribution and intensity of shipping in the St. Lawrence and the Saguenay river - Tugboat / port
We have completed the description of shipping intensity with two additional shipping categories. The first deals with the intensity of marine mammal watching activities at sea on craft with a class 1 permit in 2017 (Turgeon, 2019). The data available from Turgeon (2019) provides a characterization of the number of observation vessels that went through a regular 500m x 500m grid. We resampled this grid to distribute the number of transits recorded in it within our 1 \(km^2\) study grid. Although this exercise is limited to the Saguenay-St. Lawrence Marine Park, this is where most of the marine mammal watching excursions take place in the study area.
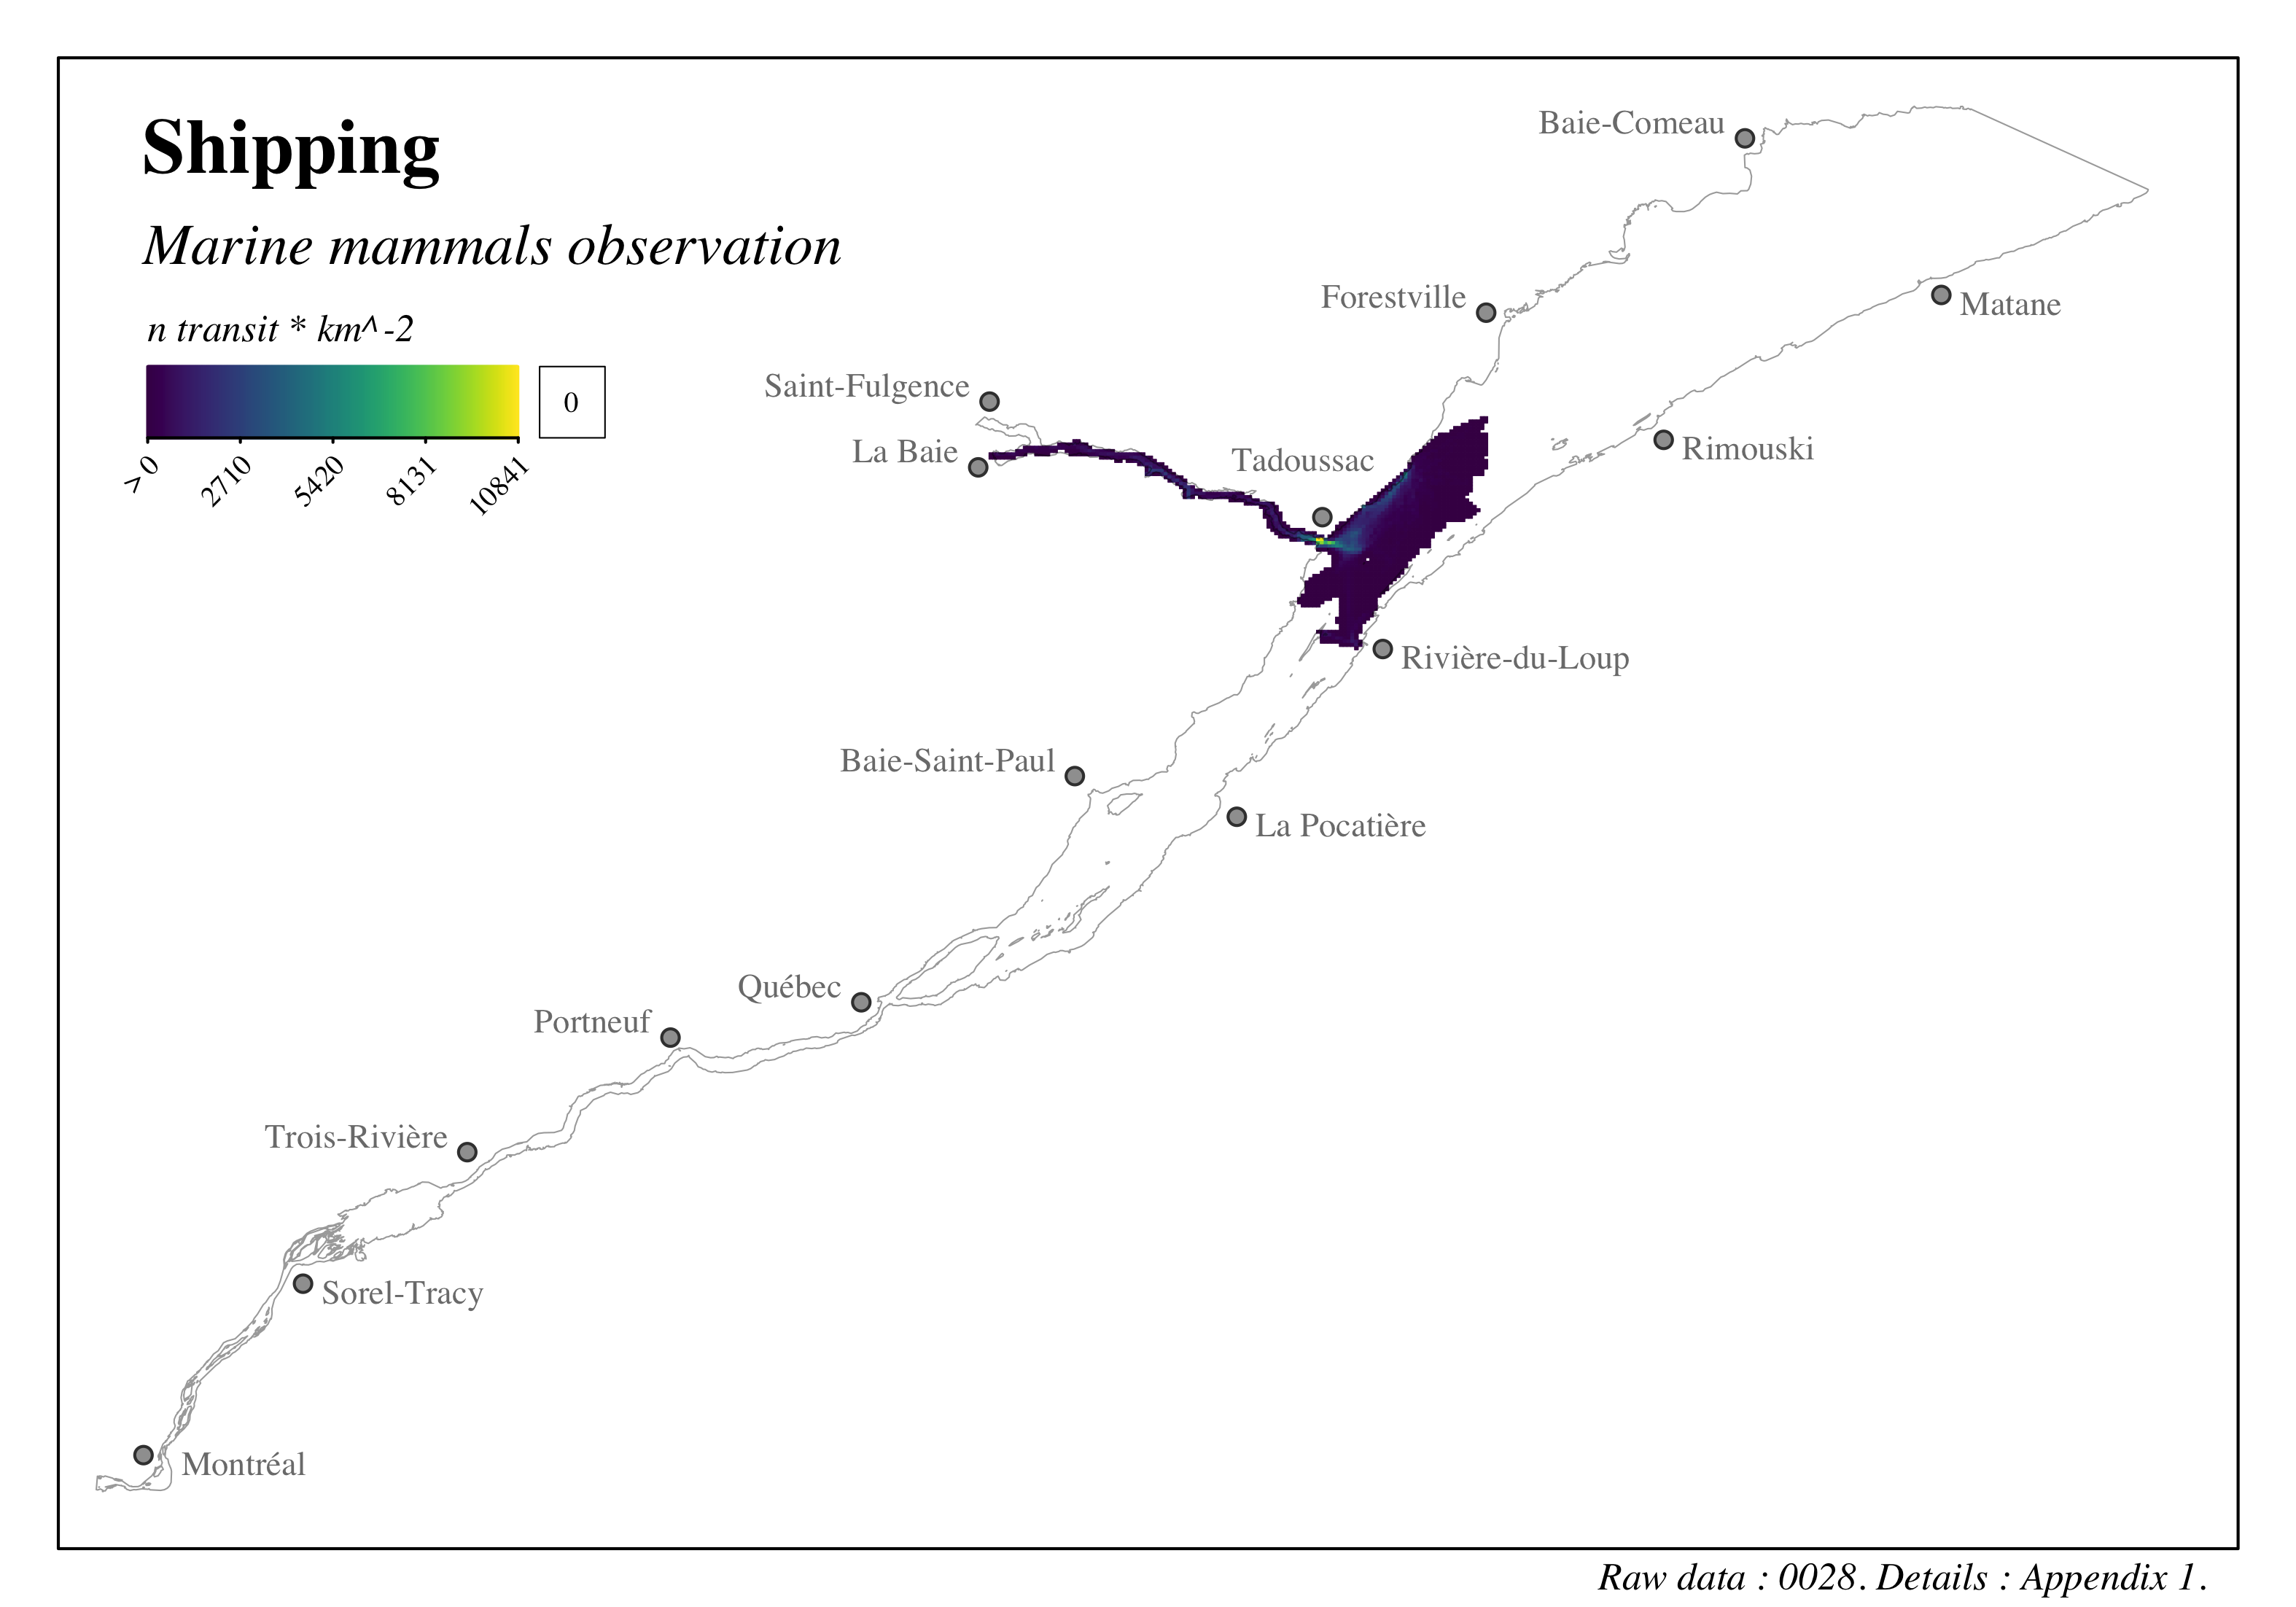
Figure 4.18: Distribution and intensity of shipping in the St. Lawrence and the Saguenay river - Marine mammal observation
The second category deals with shipping in port areas, i.e. activities that take place near port facilities such as ports and marinas. Using the assumption that shipping activities are more prevalent in port areas, AIS data were used to quantify the number of transits through the study area port areas. The port areas were characterized using data on the location of port facilities (Ministère des Transports du Québec, 2021) and industrial port areas (Ministère de l’Économie et de l’Innovation, 2021) in Quebec. A port area zone of influence was plotted by applying a buffer zone of 200 \(m\). This zone is deliberately narrow in order to primarily capture vessels that frequent port areas rather than vessels transiting the St. Lawrence River waterway, especially for facilities in the fluvial environment. The number of transits through these port areas was then calculated using the AIS data. According to this approach, a total of 53386 transits were identified in port areas between 2017 and 2019. These transits were then plotted in the 1 \(km^2\) study grid by assigning to each cell the number of transits of the most heavily frequented overlapping port area. For example, if a grid cell was affected by a first port area with 100 transits and a second area with 200 transits, that cell was assigned a value of 200.
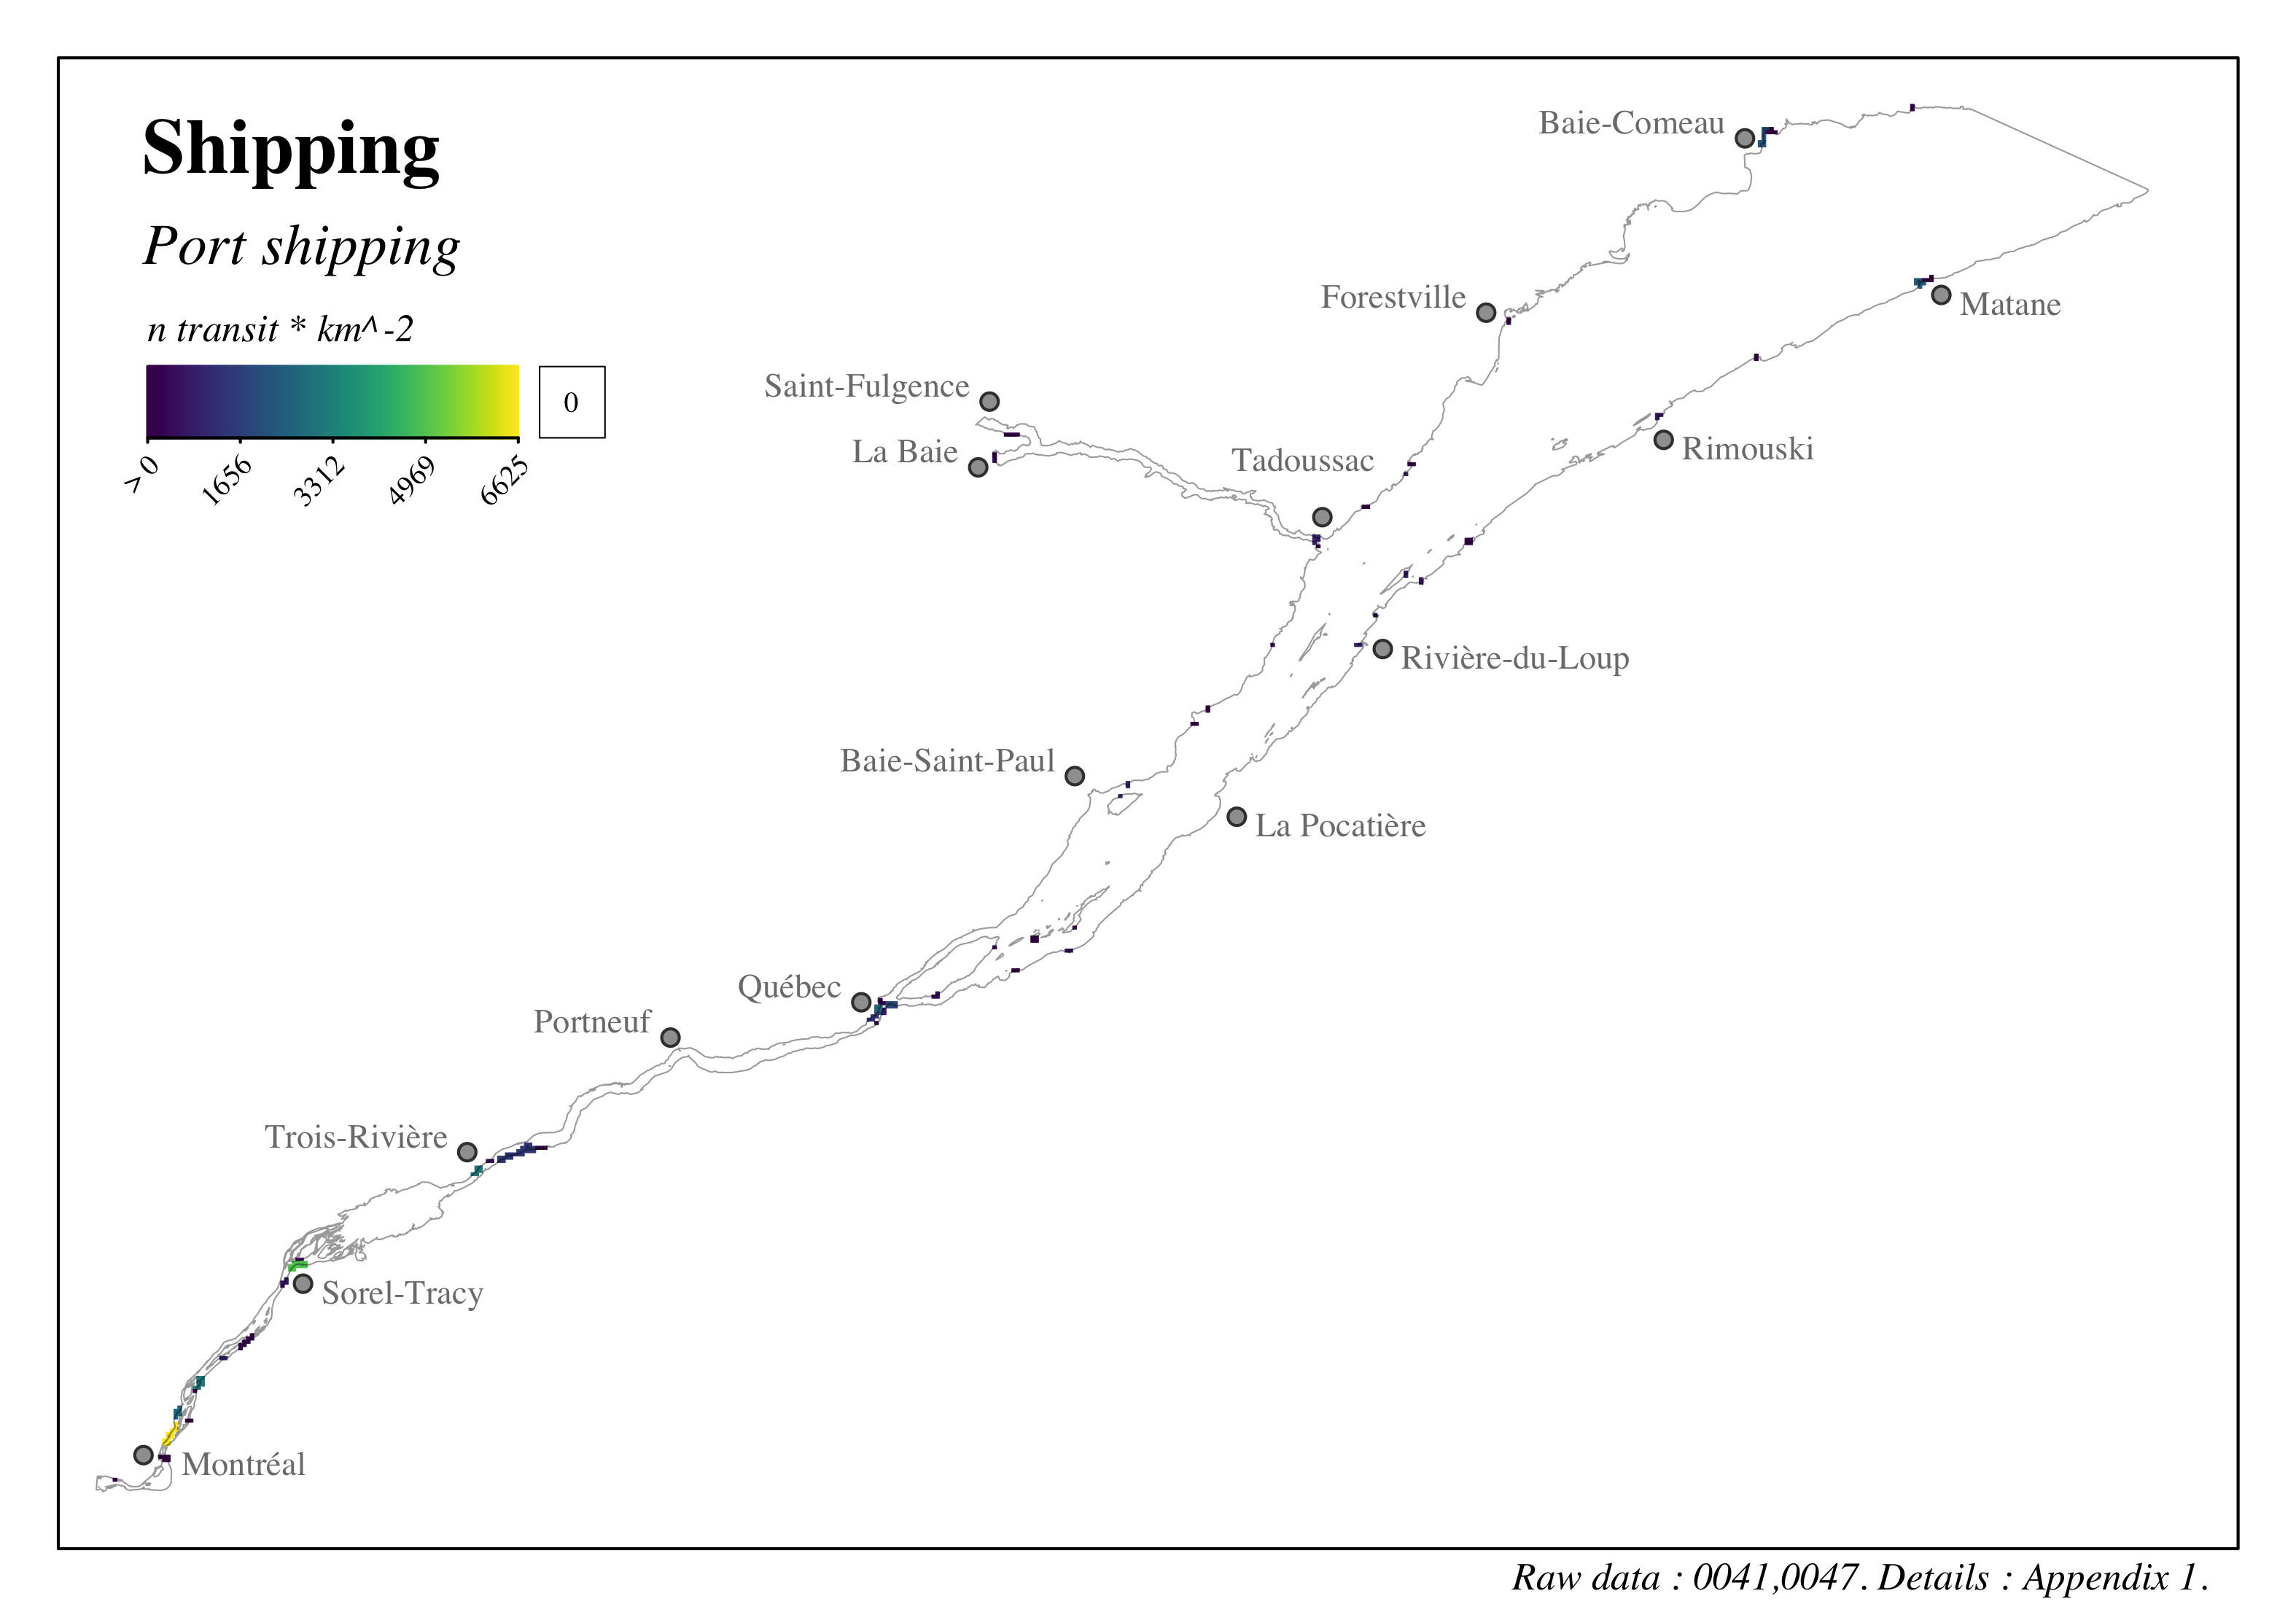
Figure 4.19: Distribution and intensity of shipping in the St. Lawrence and the Saguenay river - Port shipping
4.2.6 Commercial fishing
We thank Marc Mingelbier, Paschale Noël Bégin et Marie-Josée Gagnon from the Ministère de l’Environnement, de la Lutte contre les changements climatiques, de la Faune et des Parcs for the discussions and support in characterizing commercial fisheries in the fluvial sector.
The unique identifiers given to the data presented in this section are: 0033, 0034, 0035, 0083. Refer to the following section and to Appendix 1 for more details on these data.
4.2.6.1 Marine sector
The intensity of commercial fishing activity within the study area was assessed using data from the Fisheries and Oceans Canada logbook program (Pêches et Océans Canada, 2021a, 2021b, 2021c). Although logbooks are not mandatory for all fisheries, they still provide a sufficiently exhaustive assessment of commercial fishing activity distribution and intensity in the study area. Although there is a commercial fishery in the fluvial sector and in the Saguenay River, we were unable to obtain data enabling us to characterize its distribution and intensity. The lack of data in these areas should therefore not be interpreted as an absence of commercial fishing; this gap should be addressed for a future assessment.
We used data between 2010 and 2020 to characterize commercial fishing distribution and intensity in the study area. This period is characterized by 27489 fishing activities (2499 \(\pm\) 336 observations per year). During this period, a total of 14 species were targeted for commercial fishing and a total of 20 different species were caught (Table 4.9).
| Scientific name | French name | English name | Frequency |
|---|---|---|---|
| Chionoecetes opilio | Crabe des neiges | Snow crab | 13699 |
| Strongylocentrotus sp | Oursin | Sea urchins | 6399 |
| Buccinum sp | Buccin | Whelk | 4879 |
| Reinhardtius hippoglossoides | Flétan du Groenland | Greenland halibut | 3206 |
| Pandalus sp | Crevette | Shrimp | 2662 |
| Hippoglossoides platessoides | Plie canadienne | American plaice | 2310 |
| Hippoglossus hippoglossus | Flétan Atlantique | Atlantic halibut | 1621 |
| Urophycis tenuis | Merluche blanche | White hake | 464 |
| Clupea harengus | Hareng | Herring | 393 |
| Mactromeris polynyma | Mactre de Stimpson | Stimpson’s Surf clam | 212 |
| Homarus americanus | Homard | Lobster | 186 |
| Gadus morhua | Morue | Cod | 169 |
| Lophius americanus | Baudroie | Monkfish | 122 |
| Sebastes sp | Sébaste | Redfish | 98 |
| Pectinidae | Pétoncle | Scallop | 62 |
| Holothuroidea | Concombre de mer | Sea cucumber | 54 |
| Scomber scombrus | Maquereau | Mackerel | 40 |
| Raja sp | Raie | Skate | 25 |
| Cancer irroratus | Crabe commun | Rock crab | 13 |
| Glyptocephalus cynoglossus | Plie grise | Greysole (Witch) | 3 |
Commercial fishing is carried out with a wide variety of fishing gear such as traps, trawls, dragging, gillnets and longlines. Each type of fishing gear may have different effects on the ecosystems where fishing activities take place. For example, fishing with traps has very different effects from fishing with trawls. We thus divided fishing based on their environmental effects according to the categories suggested by Halpern et al. (2008) and repeated by Beauchesne et al. (2020) for the Estuary and Gulf of St. Lawrence (Tables 4.10 and 4.11): demersal, destructive, high bycatch (DD) demersal, non-destructive, high bycatch (DNH) demersal, non-destructive, low bycatch (DNL) pelagic, high bycatch (PHB) pelagic, low bycatch (PLB)
Gear can also be categorized based on its mobility. Fixed gear such as traps are left in place and have a more localized effect. Mobile gear such as trawls can be towed for several kilometres during fishing activities. We used the type of mobility to generate an area of effects for fishing activities. This approach allows for the potential uncertainty associated with fishing activity coordinates, gear mobility, and the absence of start and end coordinates for mobile gear. We used an area with a radius of 200 and 2000 metres for fixed and mobile gear fishing activities, respectively (Beauchesne et al., 2020). Types of gear were characterized using a commercial fisheries fishing gear index database together with the logbook database (Pêches et Océans Canada, 2021b).
| Category | Description | Frequency |
|---|---|---|
| Demersal, destructive, high-bycatch | Commercial fishing activities using demersal fishing gear that may damage habitats or substrate, e.g. trawling and dragging. | 2954 |
| Demersal, non-destructive, low-bycatch | Commercial fishing activities using demersal fishing gear with little or no bycatch and not causing habitat modification, e.g., deep-sea fishing. | 6452 |
| Demersal, non-destructive, high-bycatch | Commercial fishing activities using demersal fishing gear with high bycatch and not causing habitat modification, e.g., trap and seine. | 18793 |
| Pelagic, low-bycatch | Commercial fishing activities using pelagic fishing gear with little or no bycatch and not causing habitat modification, e.g., line fishing, purse seine. | 8 |
| Pelagic, high-bycatch | Commercial fishing activities using pelagic fishing gear with high bycatch and not causing habitat modification, e.g., gillnet and longline. | 8429 |
| Type of gear | Category | Mobility |
|---|---|---|
| Trap | DNH | Fixed |
| Bottom trawl | DD | Mobile |
| Drag | DD | Mobile |
| Gillnet | PHB | Fixed |
| Line fishing | PLB | Fixed |
| Longline | PHB | Fixed |
| Diving | DNL | Fixed |
| Purse seine | PLB | Fixed |
| Danish or Scottish seine | DNH | Fixed |
| Shoreline seine | DNH | Fixed |
| Trap | DNH | Fixed |
| Jigger | PLB | Fixed |
To characterize fishing intensity (\(I_{peche}\)), we assessed the total frequency of fishing activities during the period considered (2010 - 2020) overlapping each study grid cell:
\[I_{fishing,j} = \sum_{k=1}^{n_j} P_{j,k}\]
where \(j\) is a study grid cell, \(k\) is a fishing activity, and \(P_k\) is the buffer zone surrounding each \(k\) fishing activity. This formula calculates fishing intensity expressed as the number of identified fishing activities. Since we have calculated the intensity within cells of 1 \(km^2\), the units of this formula are in number of activities (\(n\)) per \(km^2\), or \(n * km^{-2}\). Since buffer zones were used around each activity, it is possible that a single fishing activity is identified for more than one cell in the study grid. The total sum of activities in the study grid will therefore not equal the actual total sum of fishing activities identified in the study area.
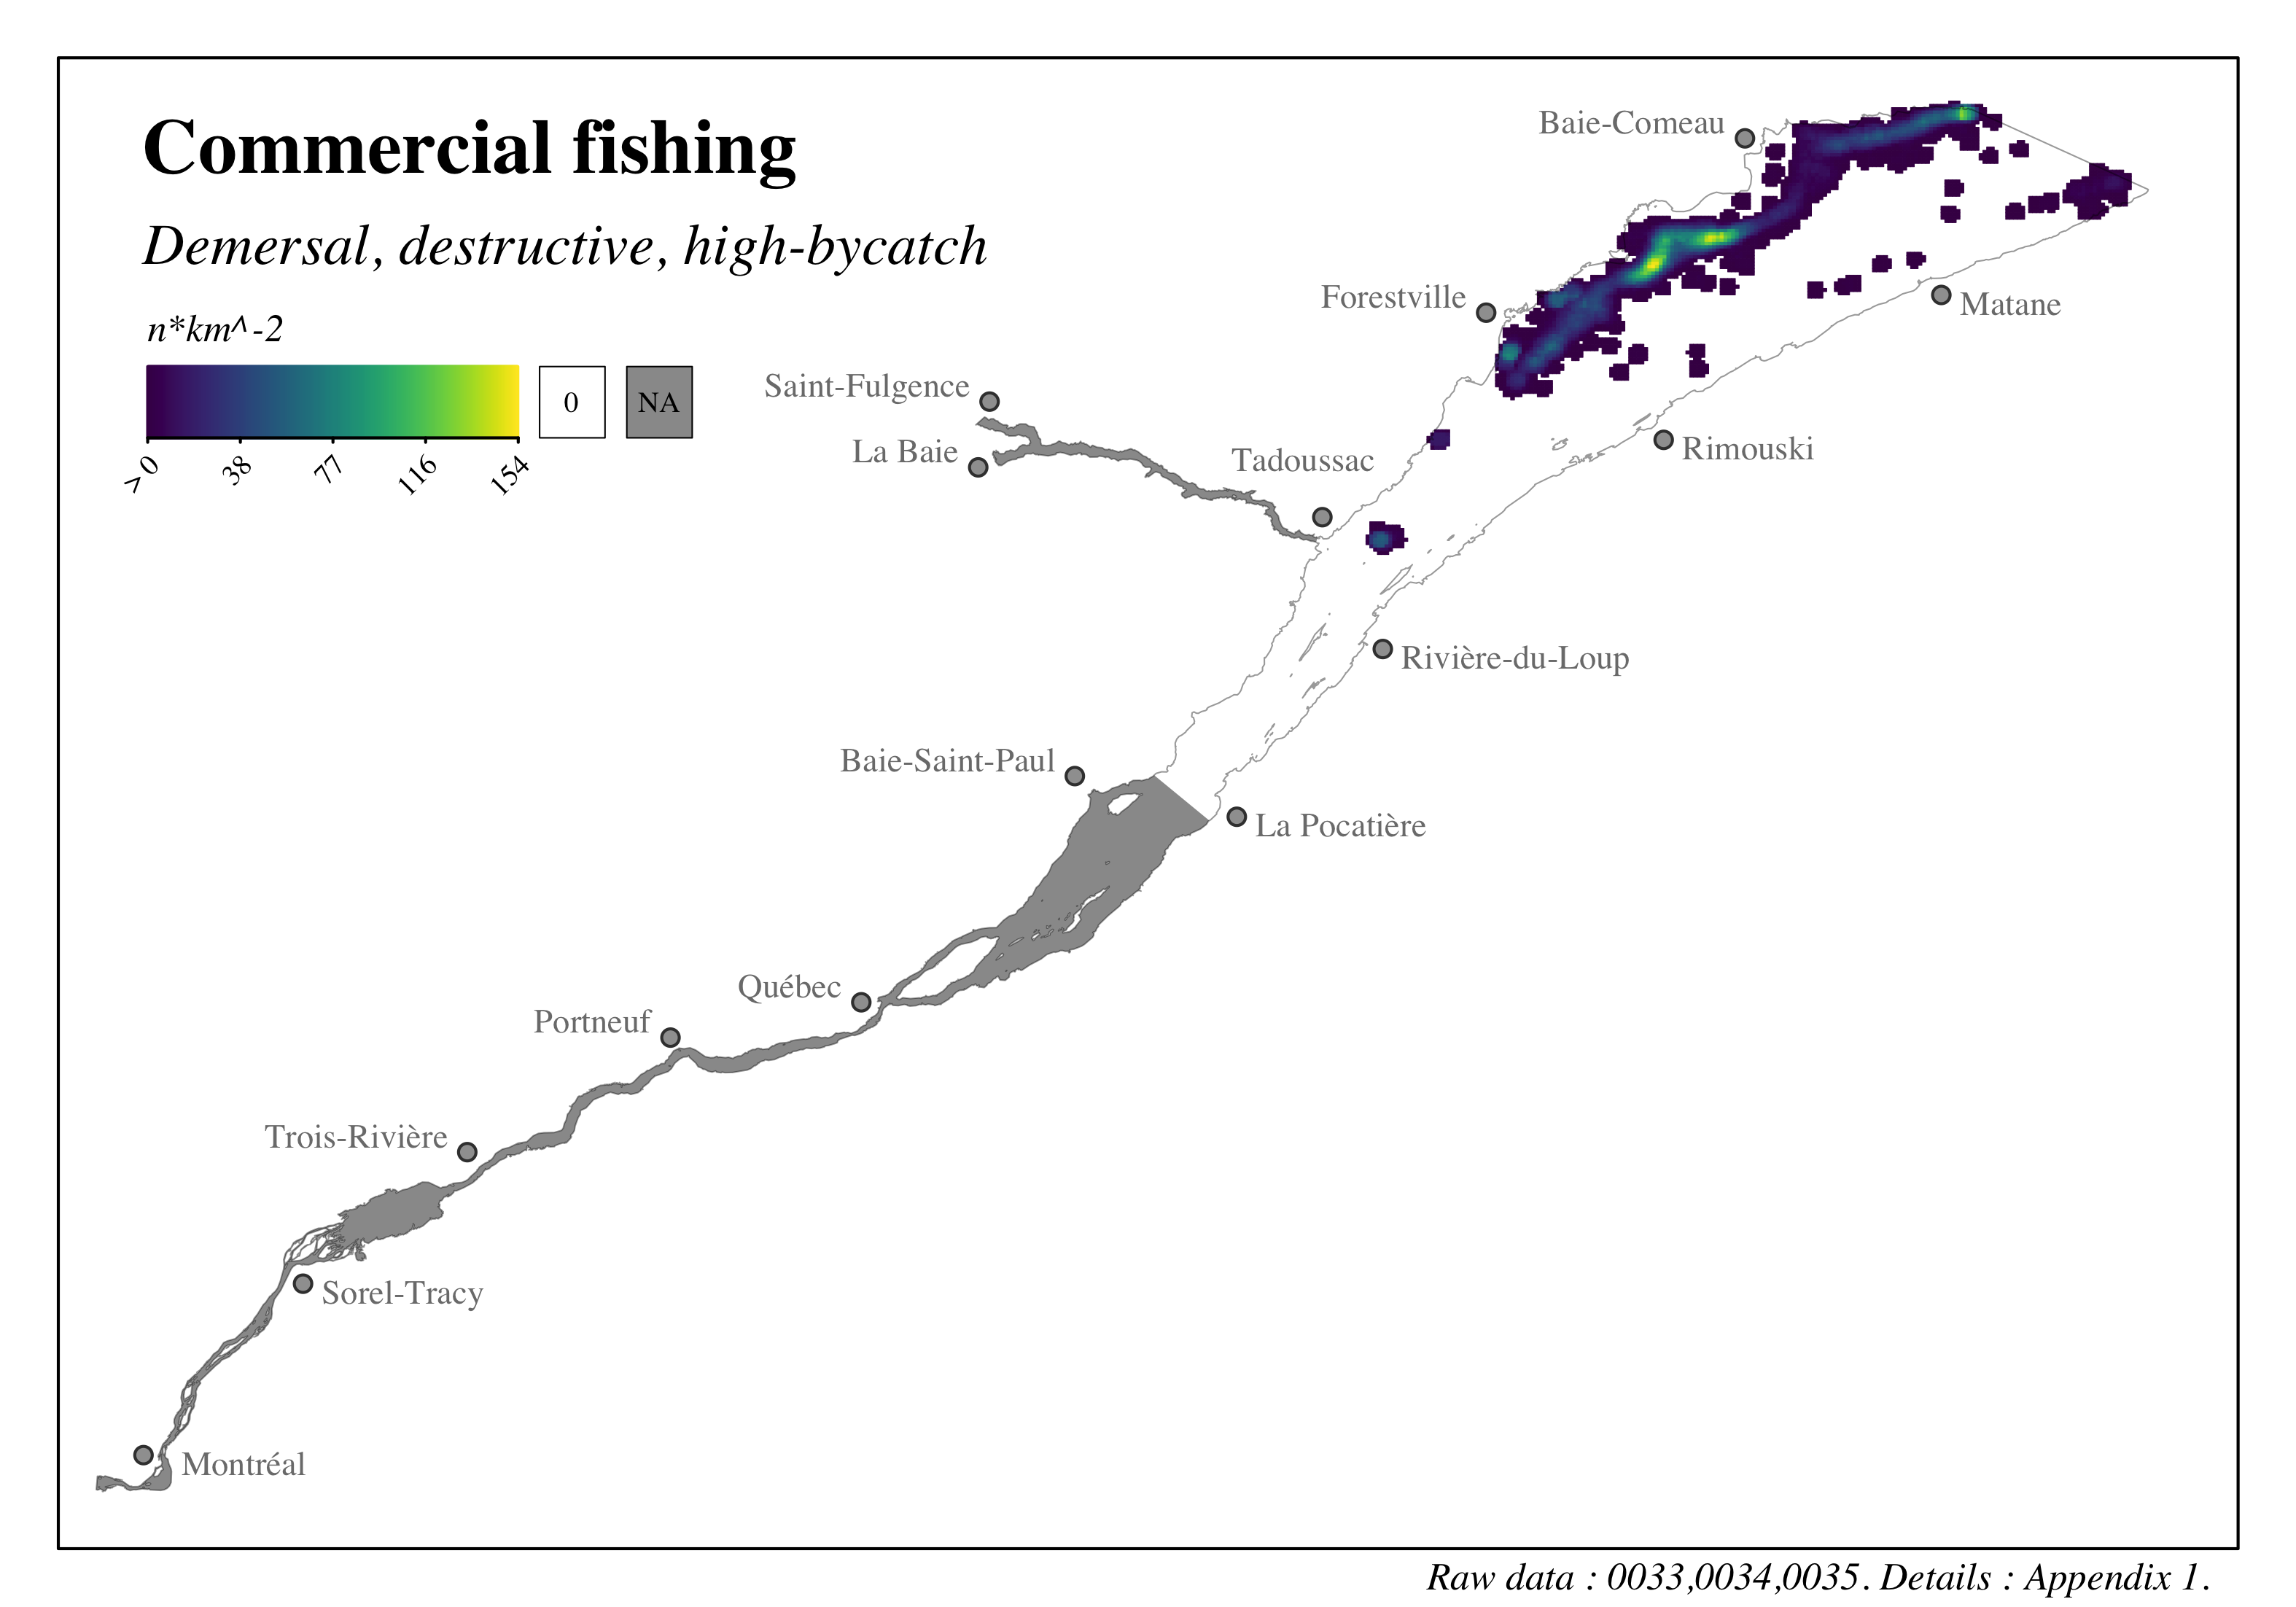
Figure 4.20: Distribution and intensity of commercial fisheries in the St. Lawrence and the Saguenay river - Demersal, destructive, high bycatch
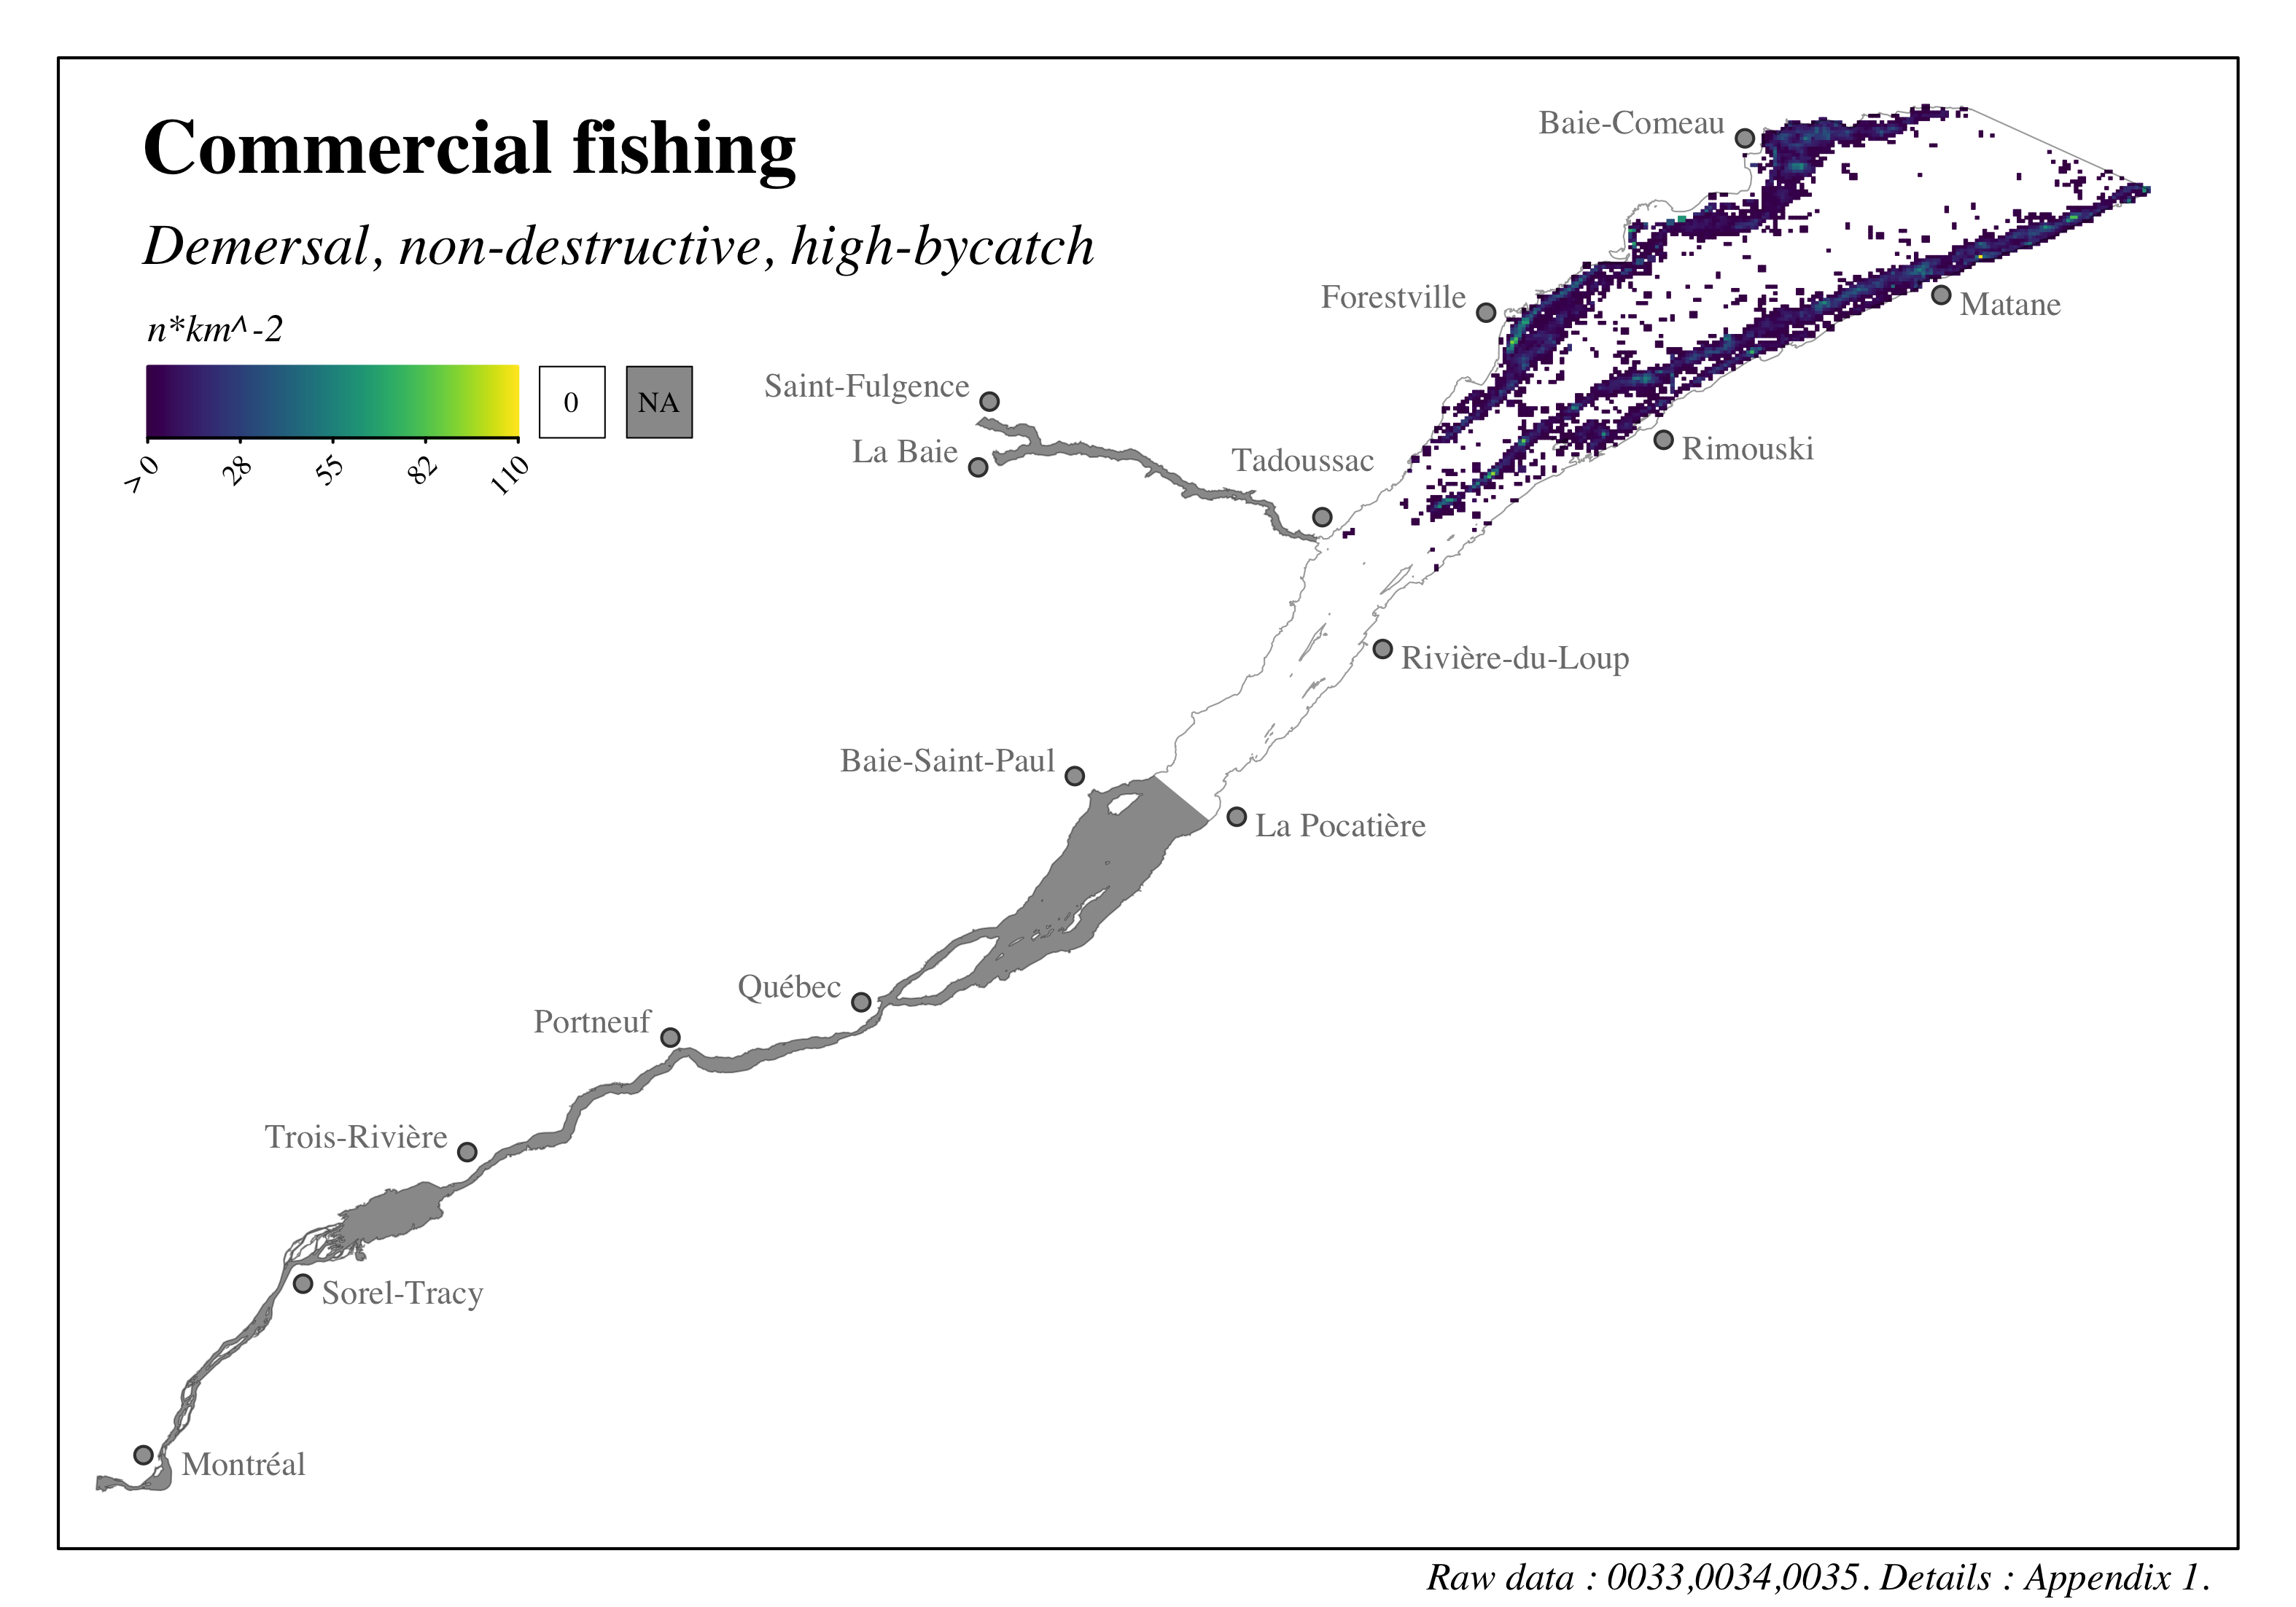
Figure 4.21: Distribution and intensity of commercial fisheries in the St. Lawrence and the Saguenay river - Demersal, non-destructive, high bycatch
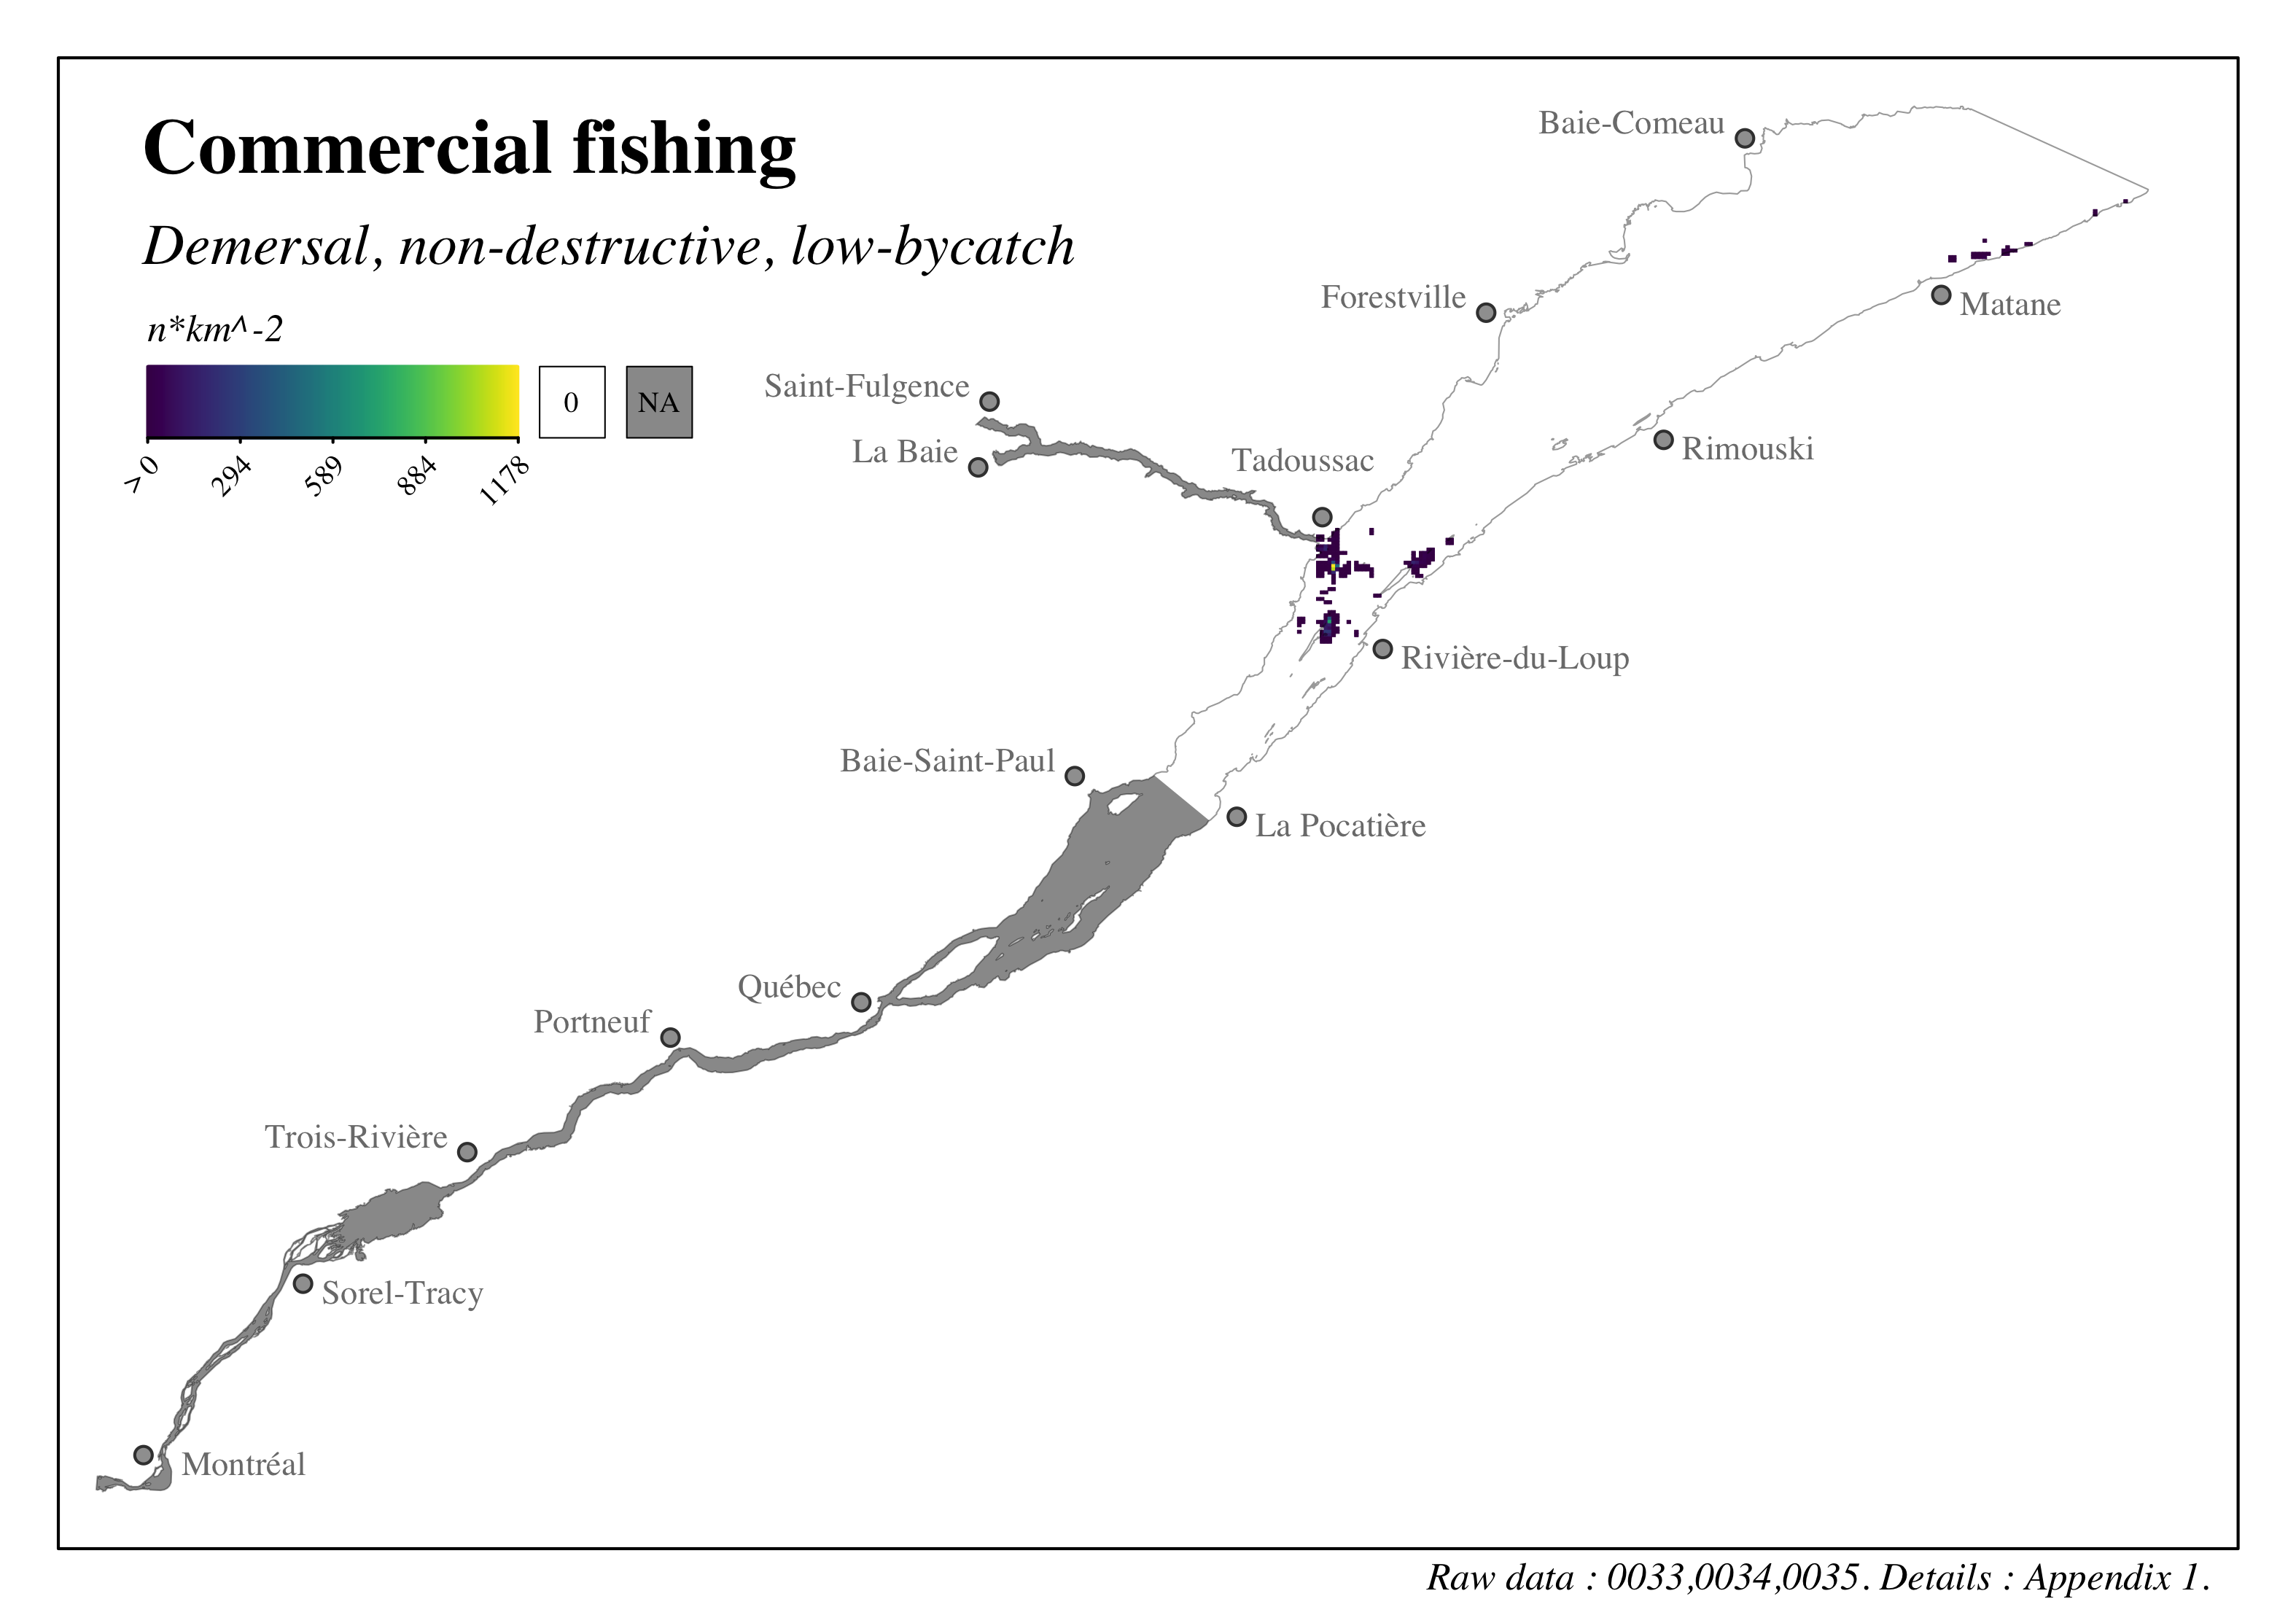
Figure 4.22: Distribution and intensity of commercial fisheries in the St. Lawrence and the Saguenay river - Demersal, non-destructive, low bycatch
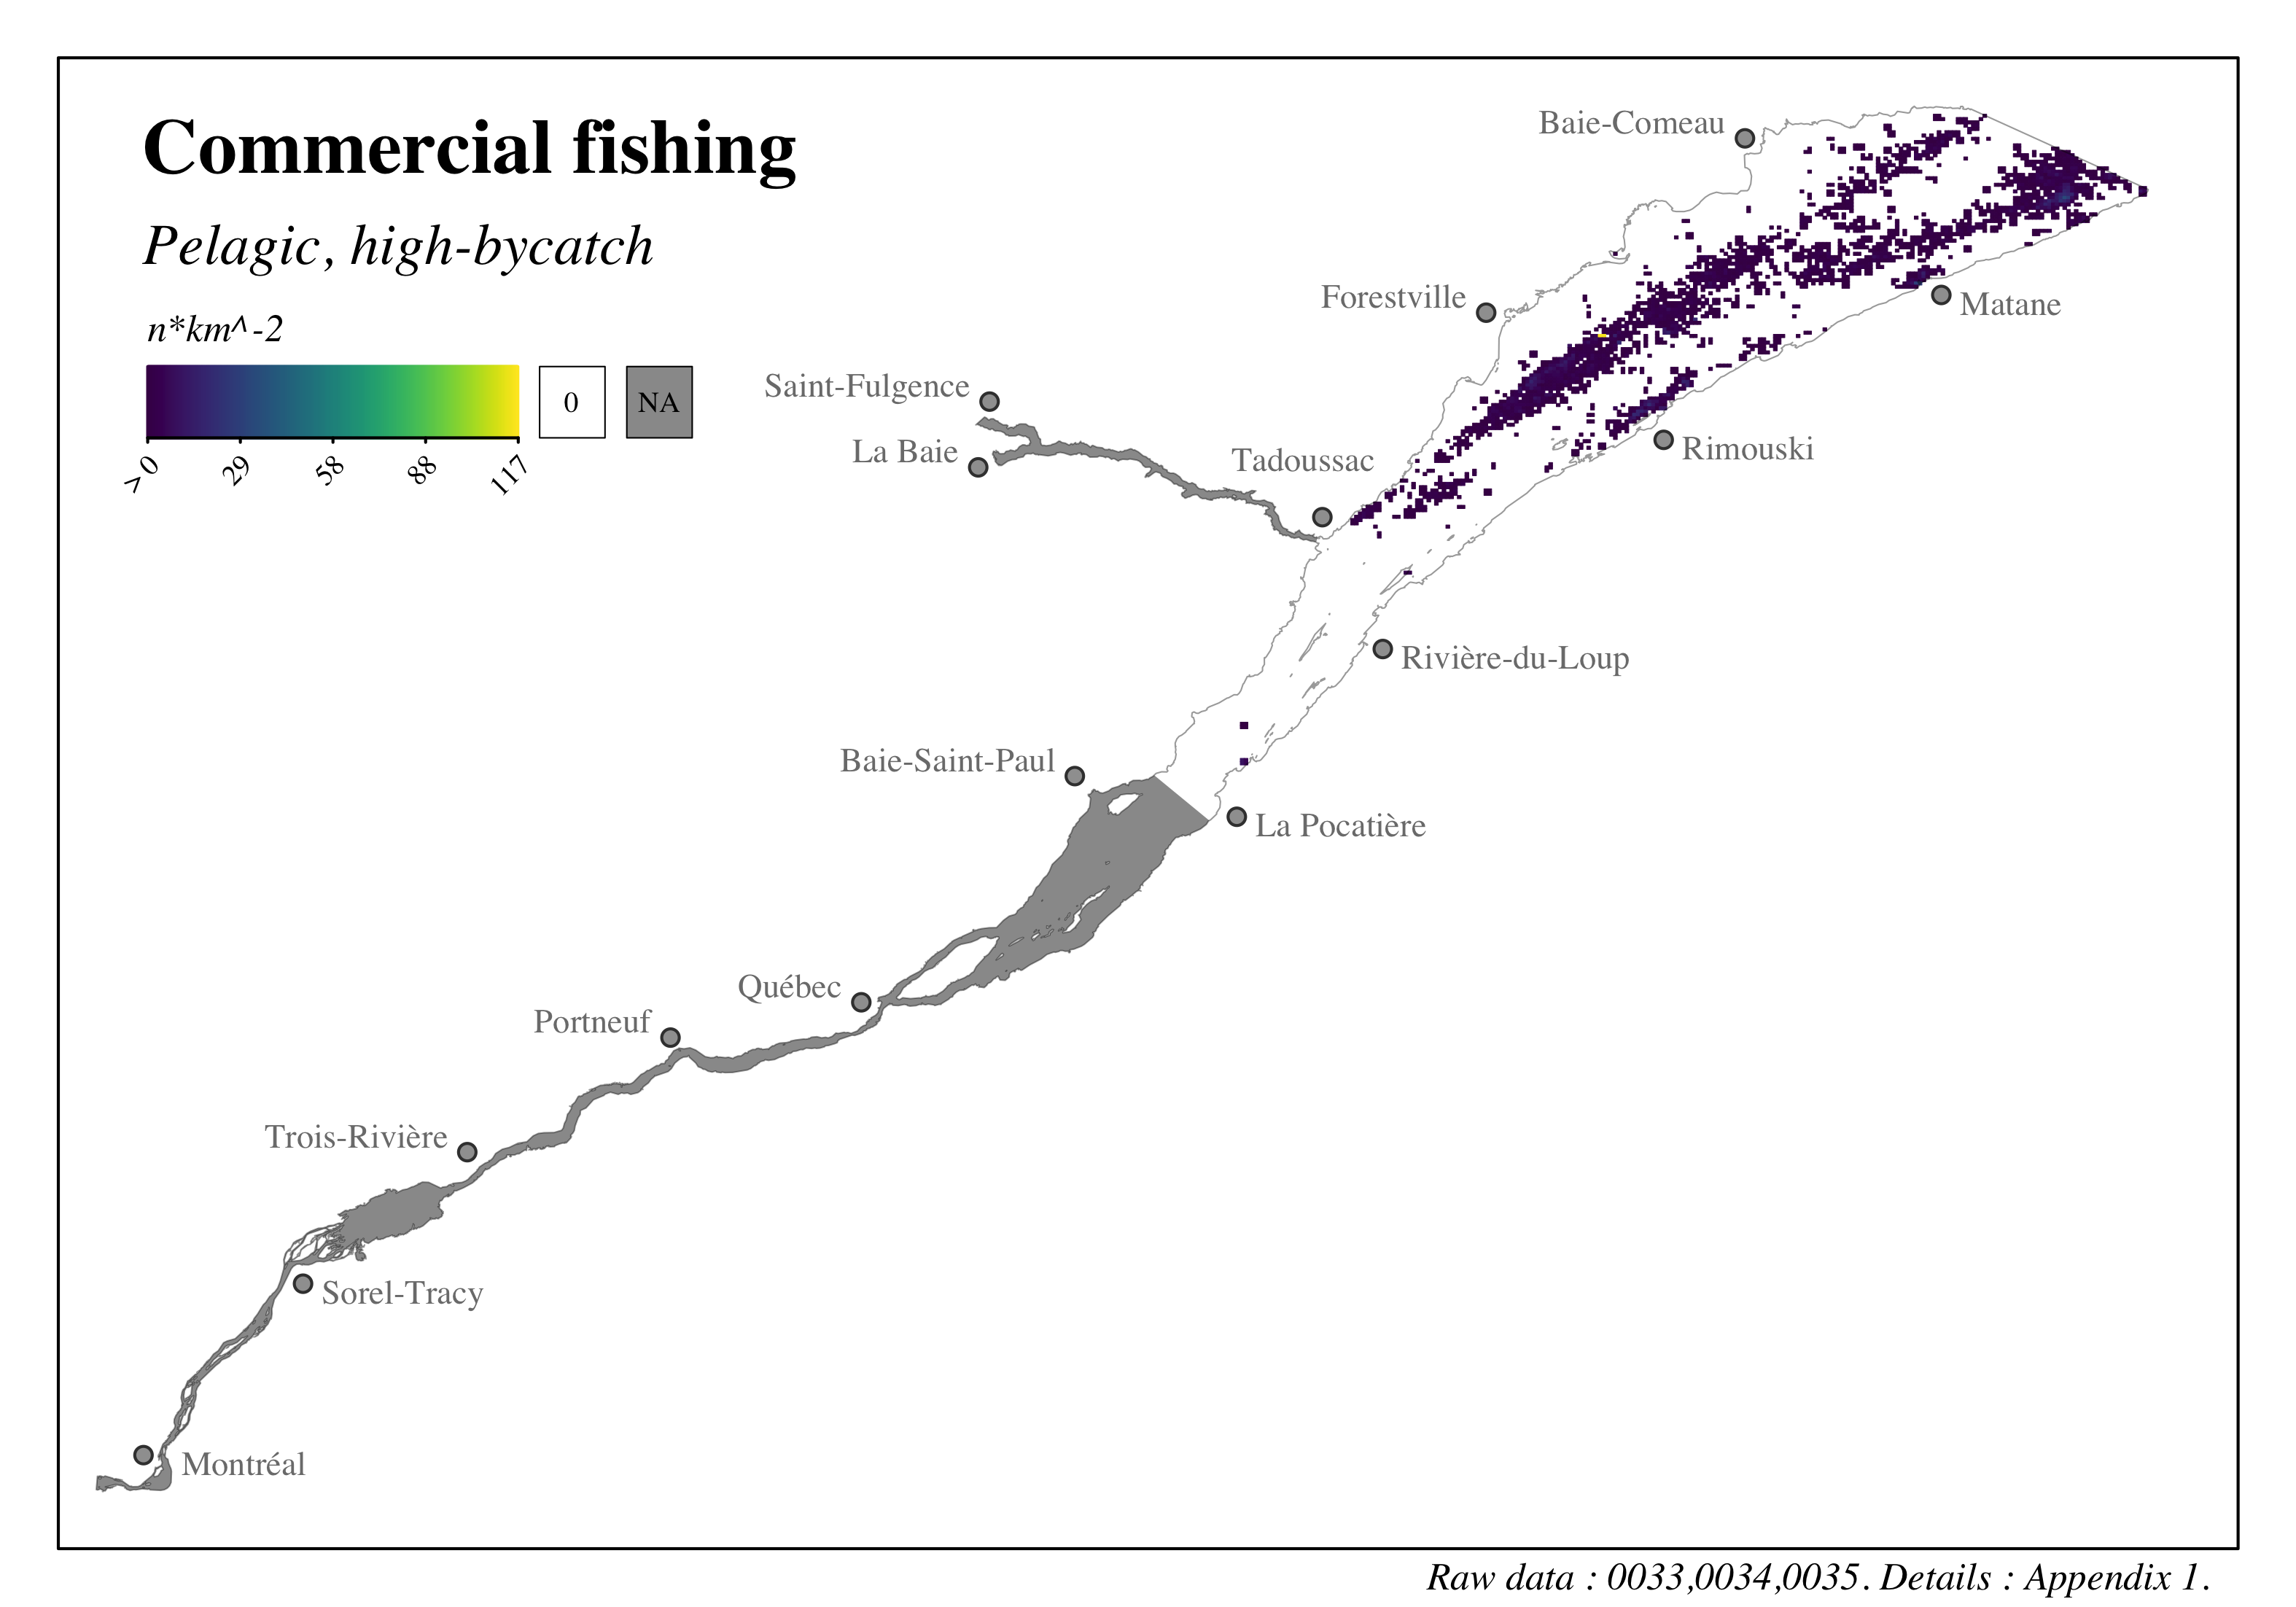
Figure 4.23: Distribution and intensity of commercial fisheries in the St. Lawrence and the Saguenay river - Pelagic, high bycatch
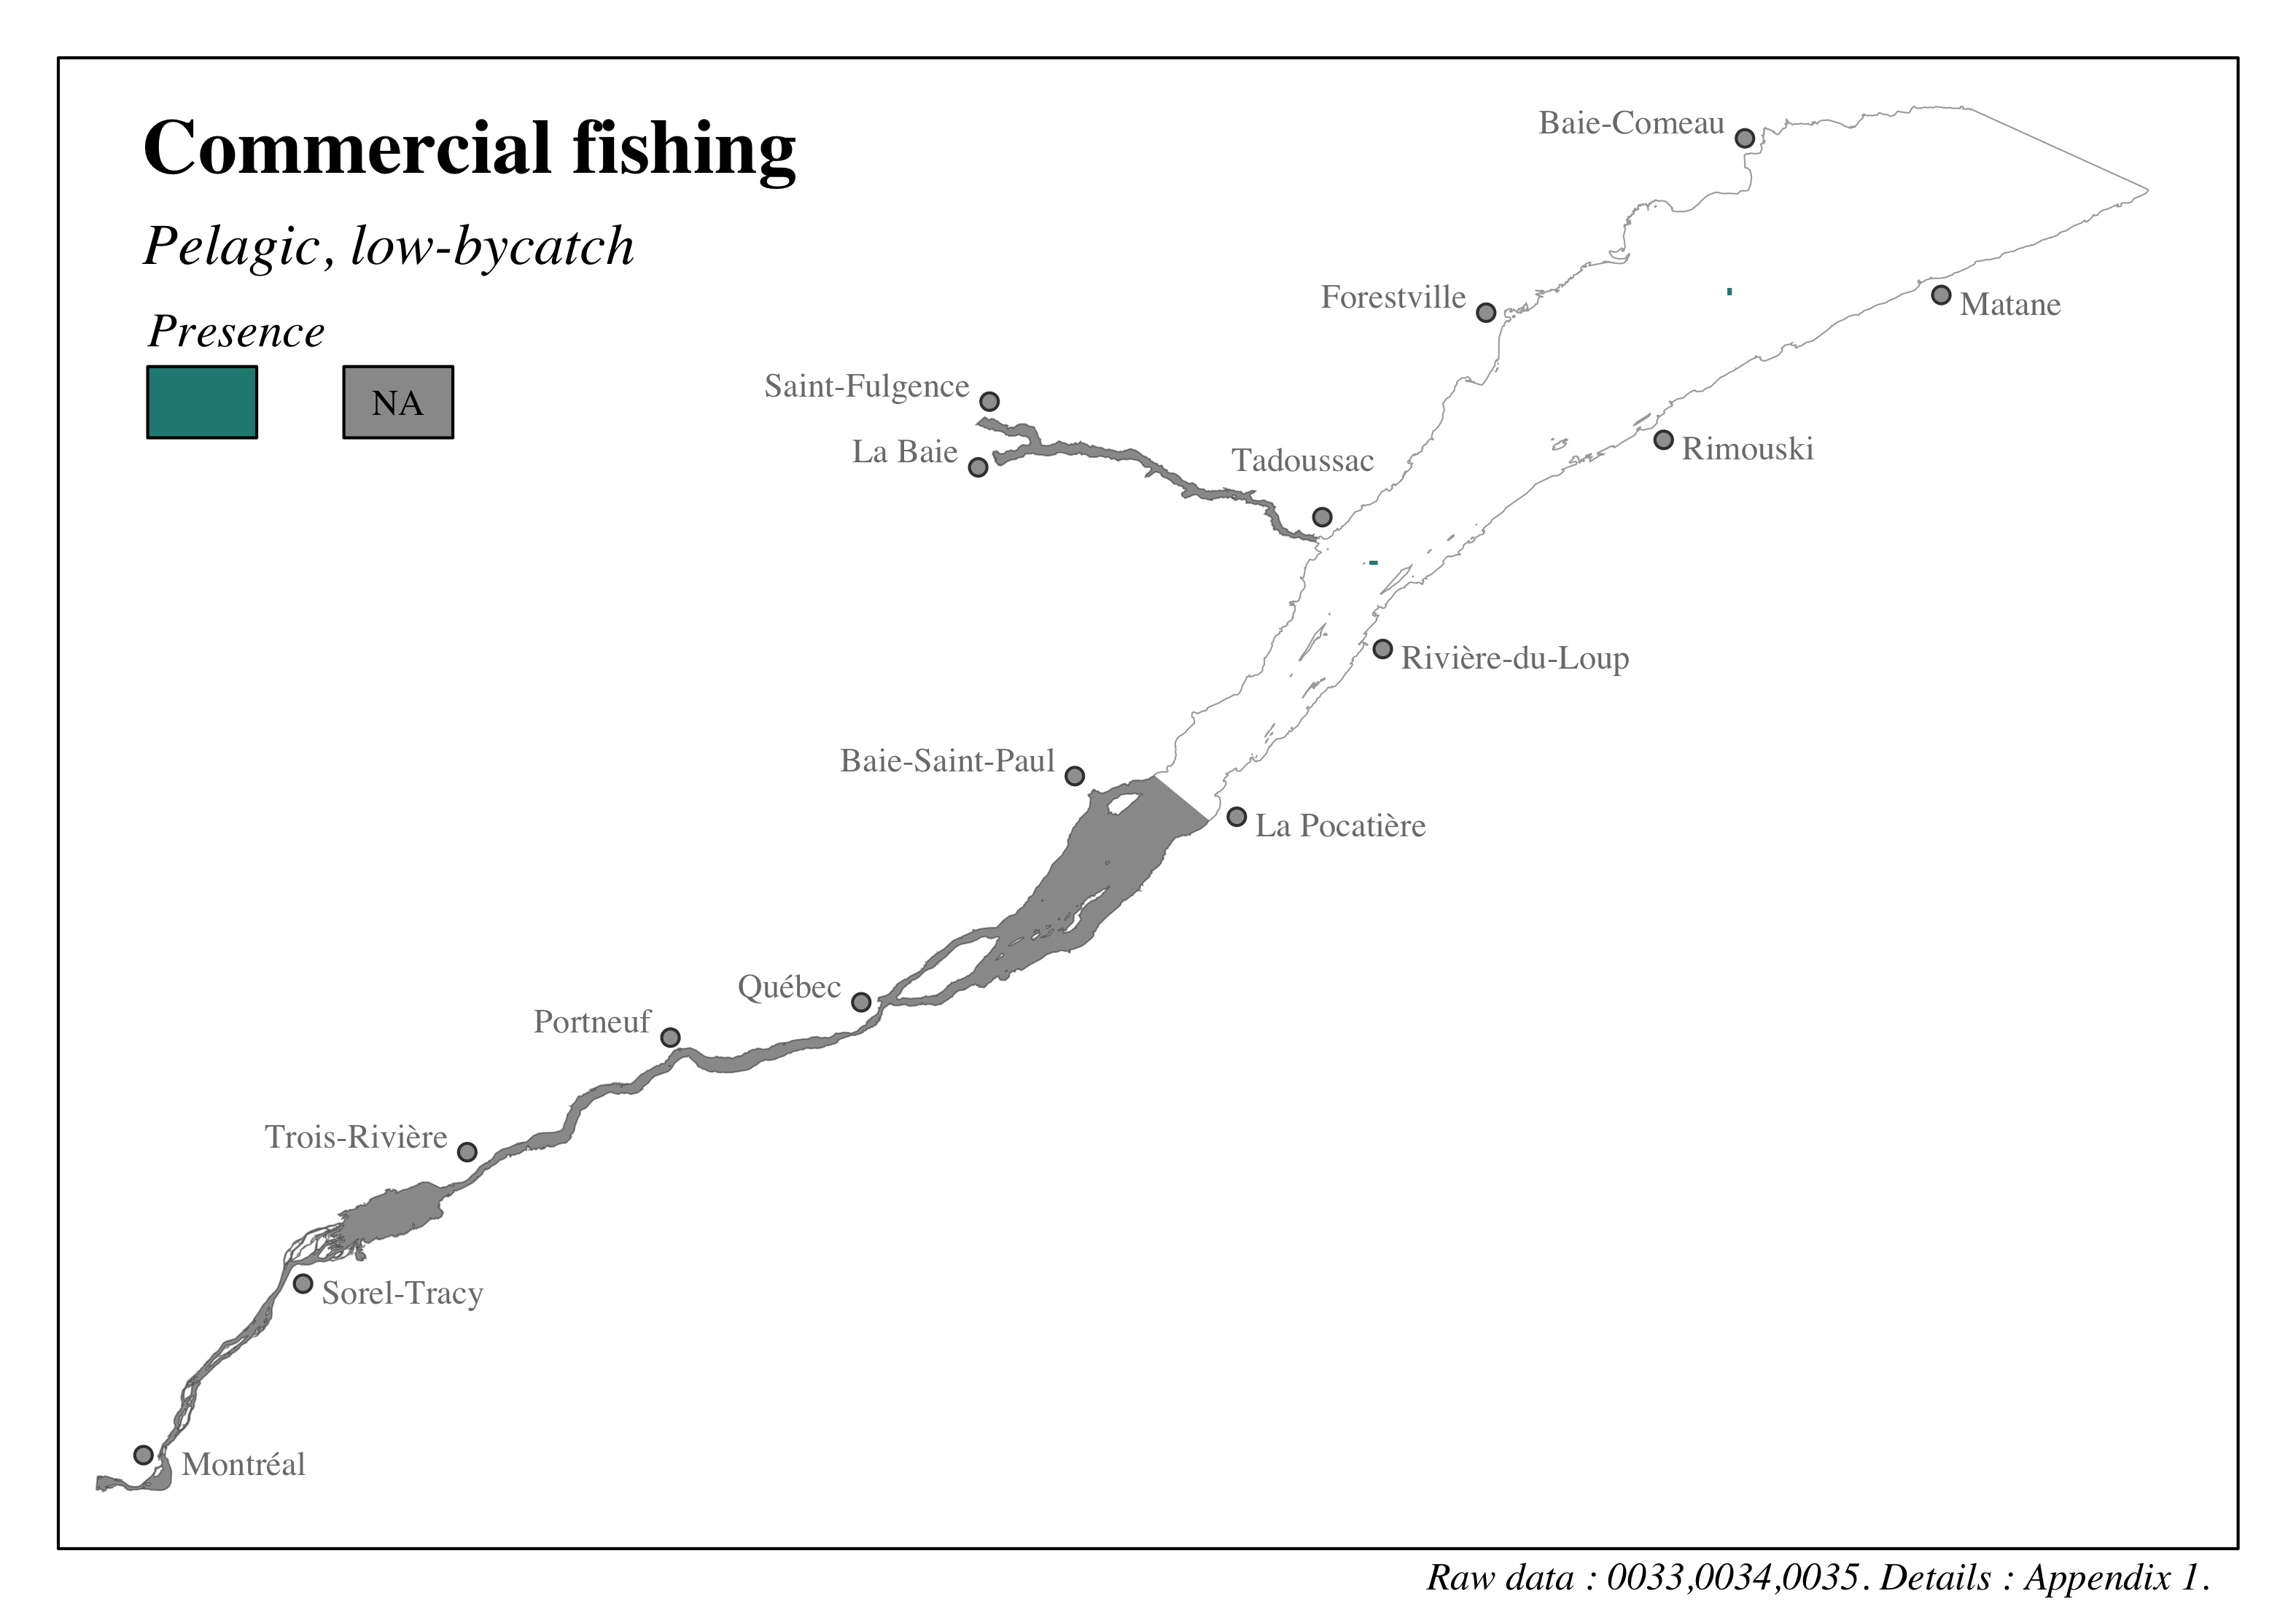
Figure 4.24: Distribution and intensity of commercial fisheries in the St. Lawrence and the Saguenay river - Pelagic, low bycatch
4.2.6.2 Fluvial sector
Data characterizing commercial fisheries in the fluvial sector were included to the cumulative effects assessment during the 2023 assessment update. Those data come from a description of the main pressures observed in the St. Lawrence in 2012 (Mingelbier et al., 2012). Commercial fisheries activities using fyke nets during the spring, the summer and the fall before 2011 were characterized in segments of 5 km, and dividing the St. Lawrence between the southern and northern shores using the waterway. The intensity of commercial fisheries was measured as the mean number of fyke nets deployed par day in each segment dividing the fluvial sector of the study area; data were then given a value of 1, 3 or 5, corresponding to low, moderate and high fisheries intensity. Those values were integrated in the study grid for the assessment. It should be noted that those data are not exhaustive or representative of all commercial fisheries activities in the fluvial sector; they are, however, the most up to date information available at this time.
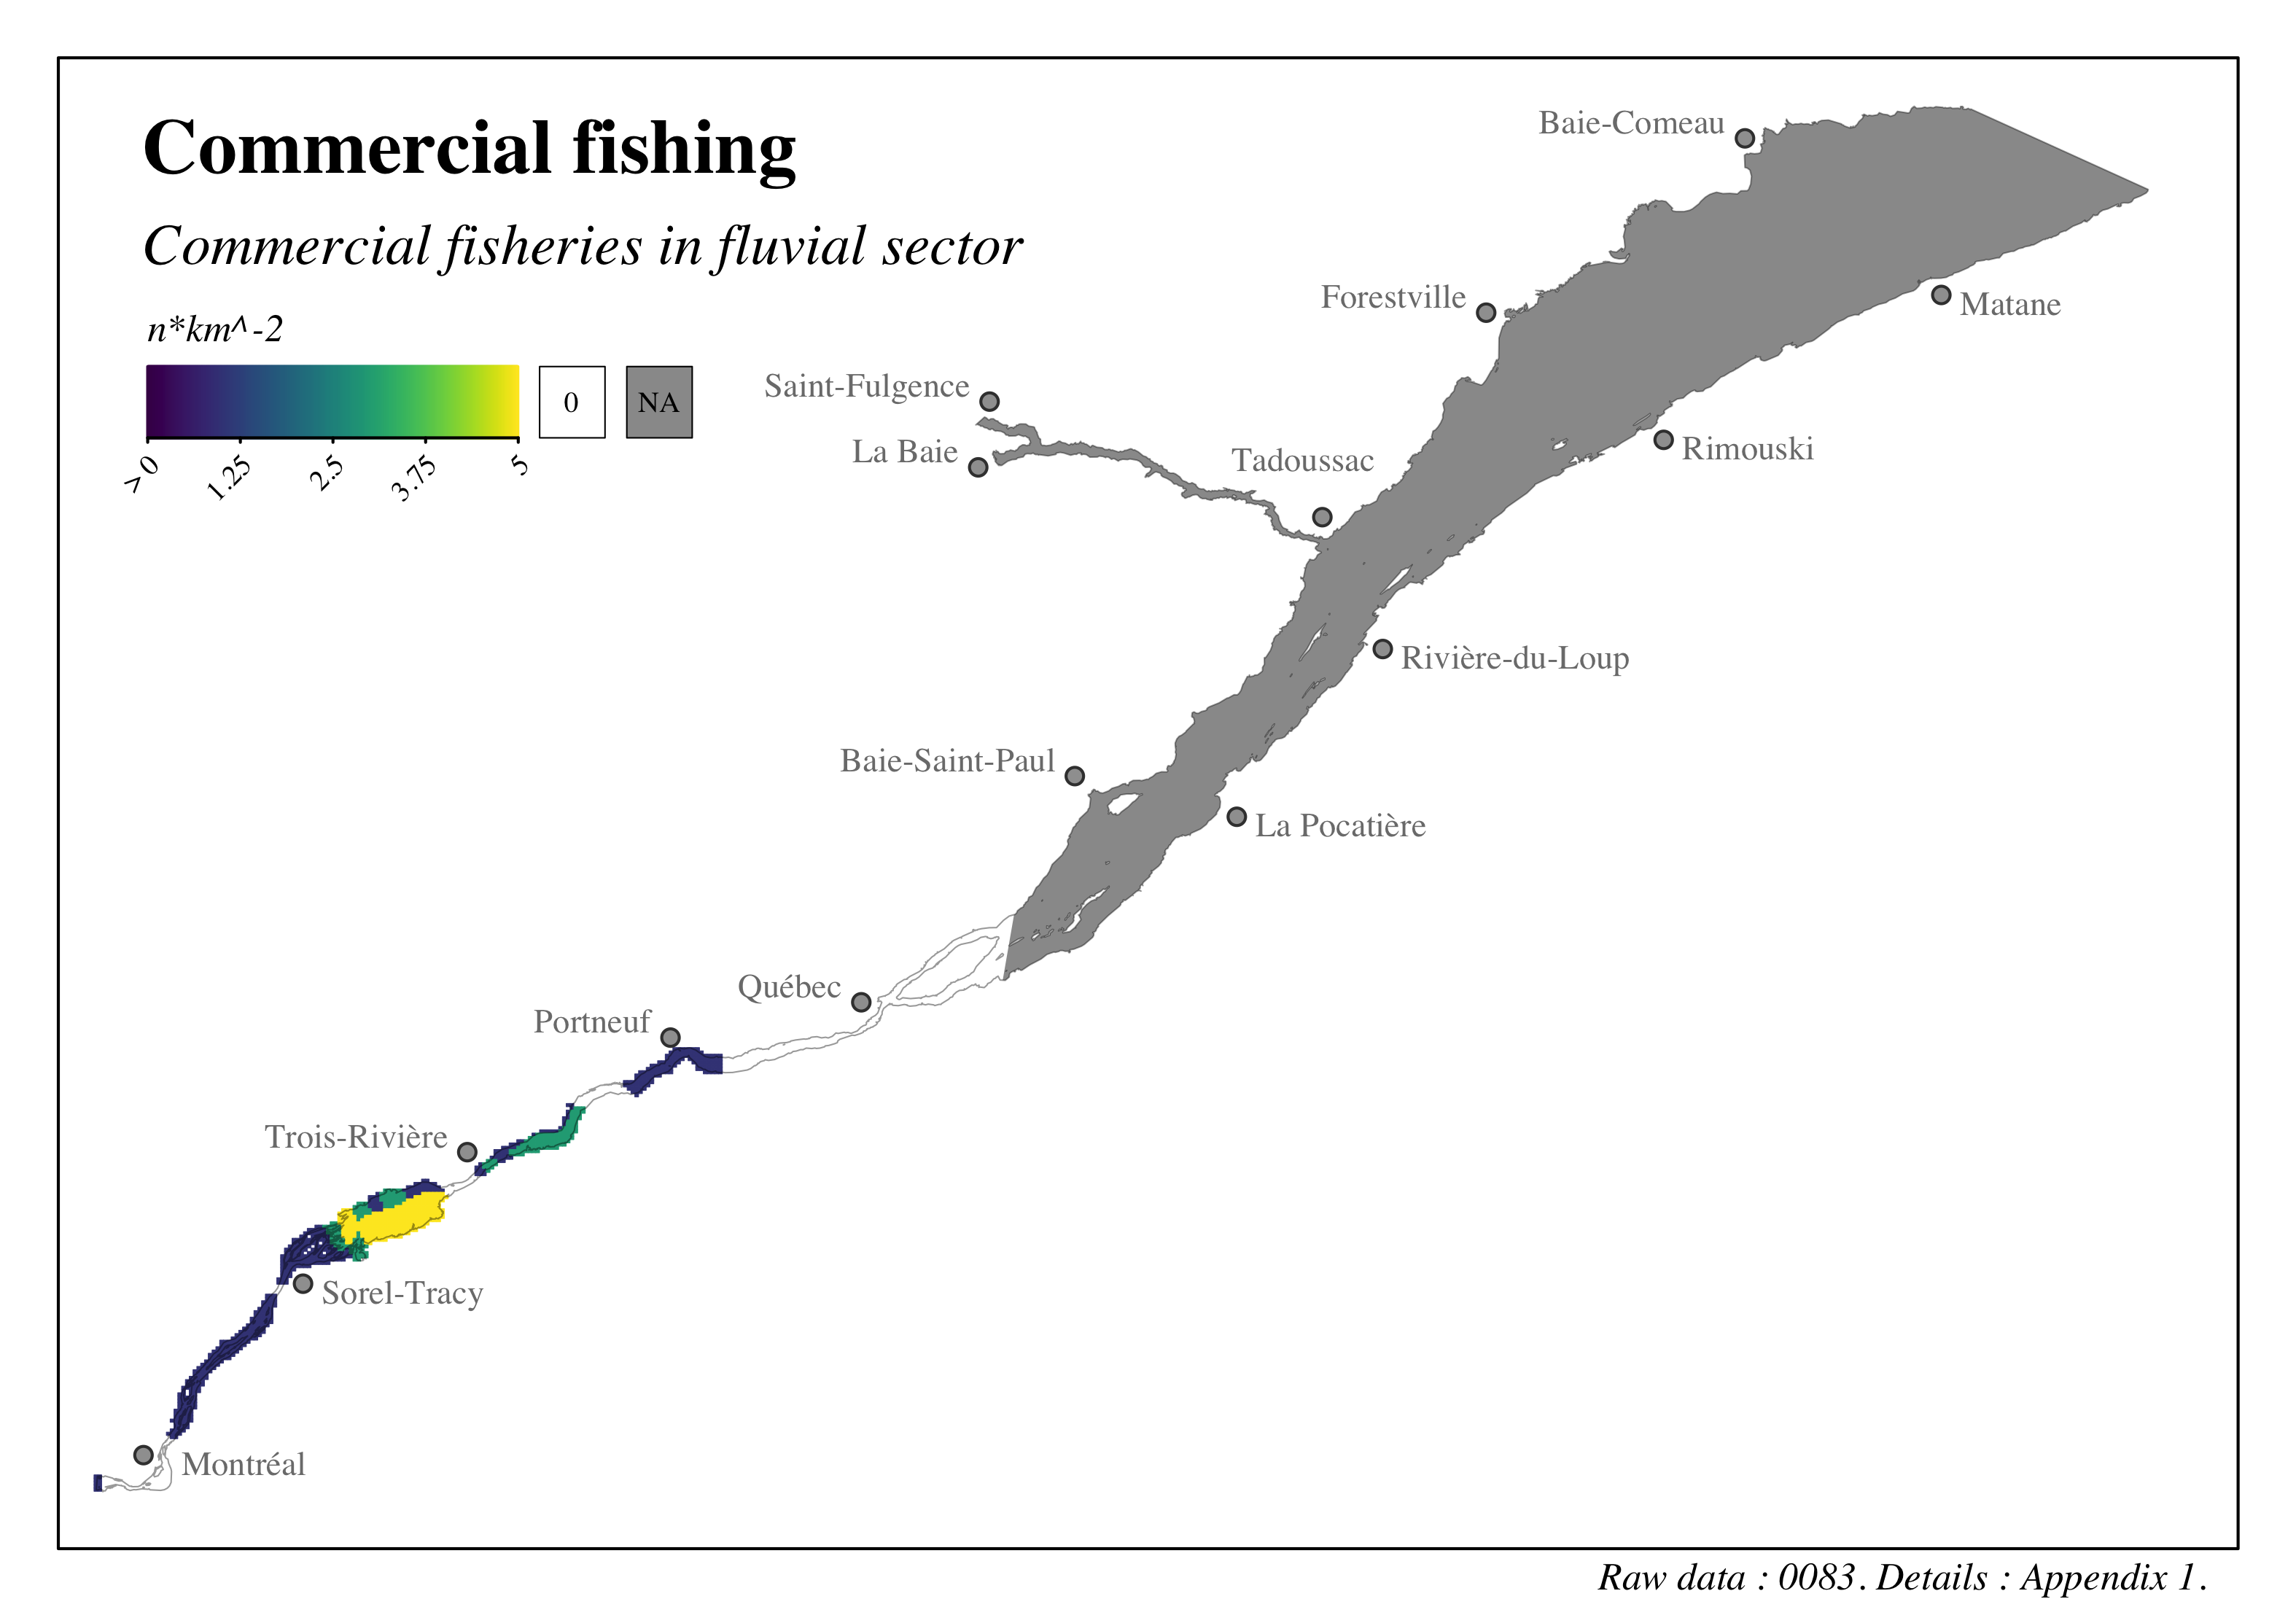
Figure 4.25: Distribution and intensity of commercial fisheries in the St. Lawrence and the Saguenay river - Fluvial commercial fisheries
4.2.7 Marine pollution
The unique identifiers given to the data presented in this section are: 0018, 0019, 0020, 0021, 0028, 0033, 0034, 0035, 0041, 0046, 0047, 0048, 0049, 0050, 0052, 0069, 0070, 0071, 0083. Refer to the following section and to Appendix 1 for more details on these data.
We introduced an environmental stressor to replace operational discharges on the environmental stressor side, and water quality on the valued component side. This new stressor was used to address the difficulties in characterizing these two elements initially identified as concerns by the parties involved in the project.
On the operational discharge side, this decision was made due to the lack of data covering the entire study area. From a legislative perspective, vessels transiting Canadian waters must exchange any ballast water within pre-established areas called “Canada’s Designated Alternate Ballast Water Exchange Areas” (Canada, 2021c, 2021d). However, the area closest to the study area is located at the entrance to the Gulf of St. Lawrence, meaning it does not affect the study area covered by our assessment (Figure 4.26). Data specific to operational discharges from vessels is apparently available for only a small proportion of the Canadian fleet operating in the study area and would have triggered a considerable data capture effort. As such, these data were not considered in the assessment.
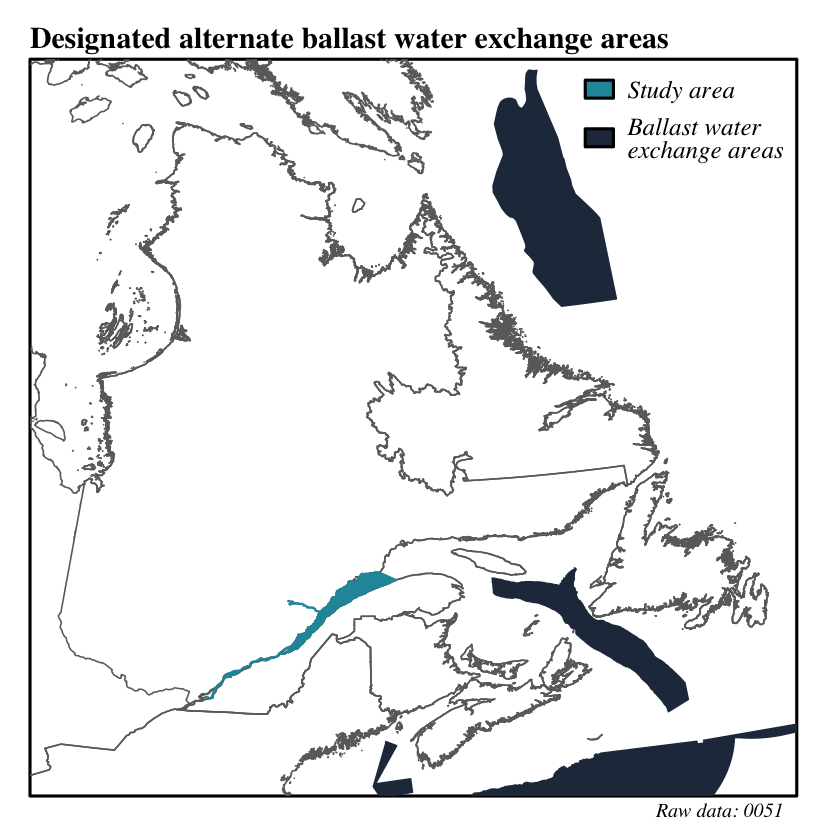
Figure 4.26: Location of Canada’s designated alternate ballast water exchange areas relative to the position of the study area for the cumulative effects assessment of marine vessel activities in the St. Lawrence and the Saguenay river.
On the water quality side, this decision was made due to the difficulty of attributing variations in water quality specifically to marine vessel activities. There are many other factors that influence water quality in coastal, aquatic and marine environments, and differentiating these effects was beyond the scope of this pilot project. More details are available in the section on water quality.
As in Halpern et al. (2019), marine pollution was characterized by combining environmental stressors related to marine vessel activities. This choice assumes that water quality is more at risk from shipping activities and the resulting pollution via operational discharges, gas leaks, waste discharges, etc. In the absence of exhaustive data on operational discharges and the difficulty of establishing a direct link between water quality and cumulative marine vessel activities, we used the marine pollution index as a proxy to identify the environments most at risk from pollution from marine vessel activities.
The marine pollution index is obtained by combining the relative intensity of all stressors directly associated with shipping activities, i.e. anchorage sites, dredging activities, shipping-related activities and commercial fishing. Characterization of the accidental spills is not included since it has already been explained in detail in the issue of toxic spills in the environment rather than as a stressor related to regular shipping problems. The marine pollution intensity (\(I_{pollution}\)) within a cell \(j\) is the sum of the intensity of selected environmental stressors normalized between 0 and 1:
\[I_{pollution,j} = \frac{1}{|S|} \sum_{s \in S} I_{s,j}\]
where \(|S|\) is the number of environmental stressors considered, \(s\) are the individual environmental stressors, and \(I_{s,j}\) is the relative intensity of the stressor \(s\) within cell \(j\).
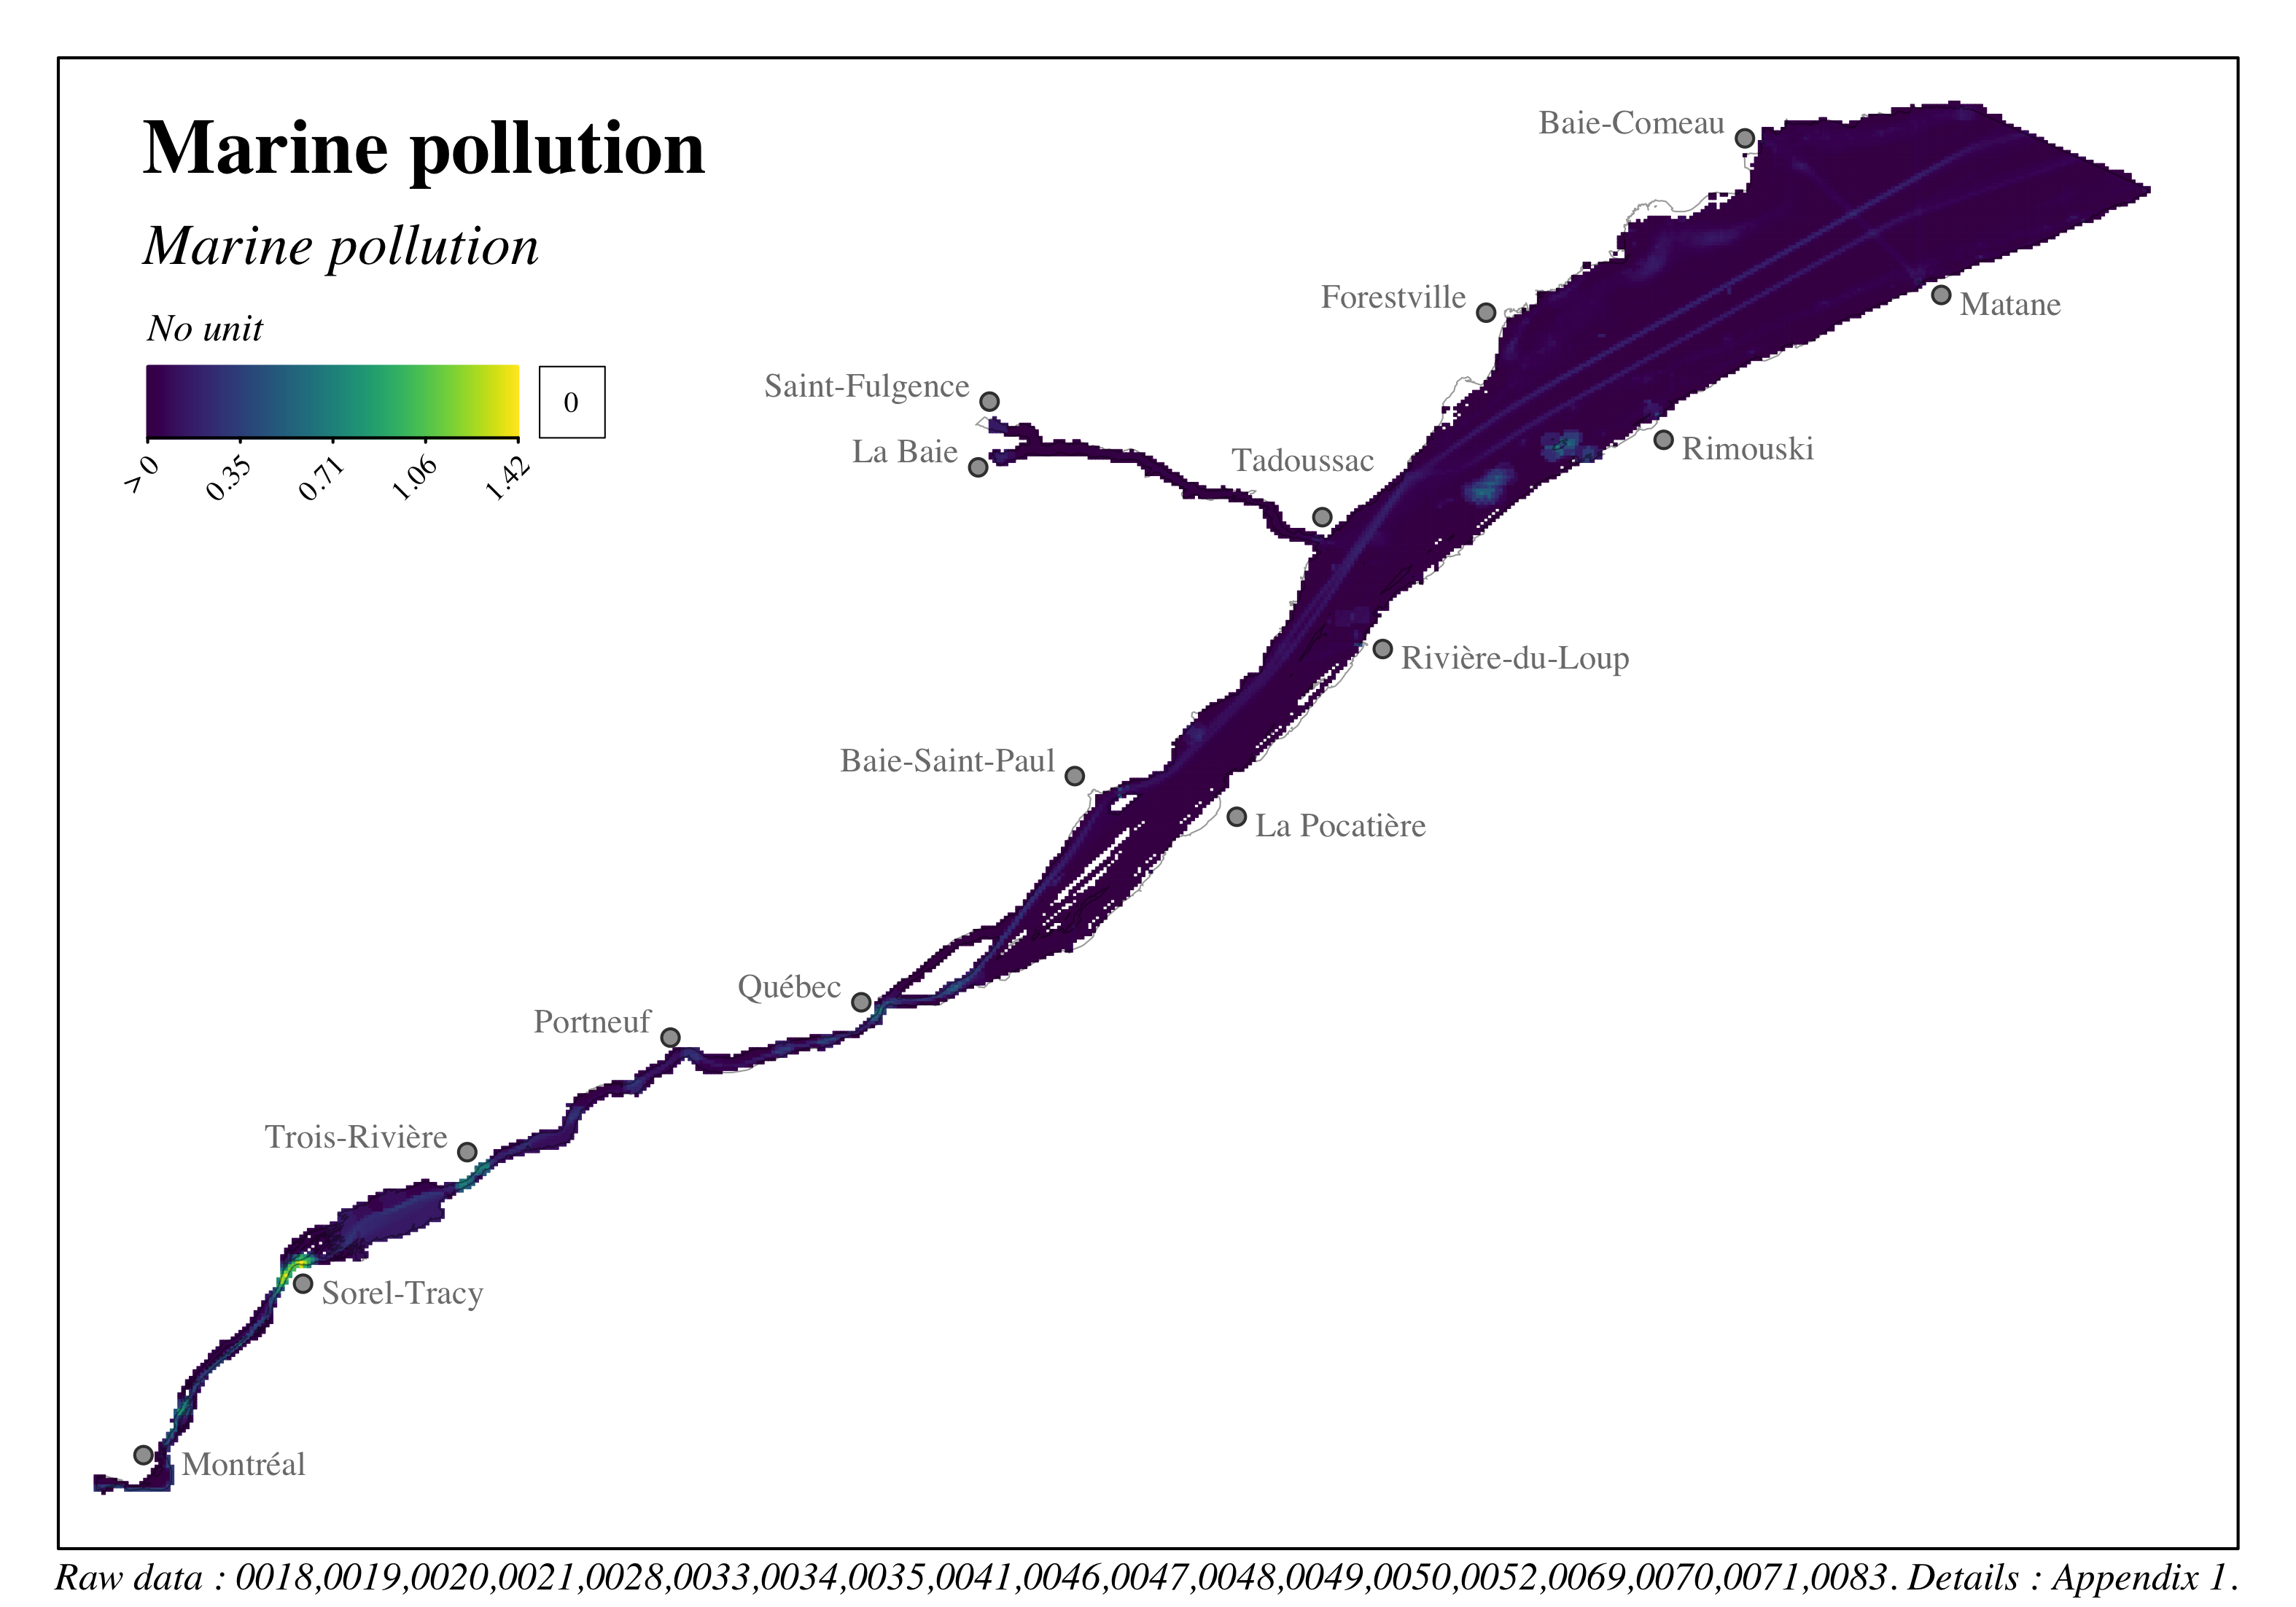
Figure 4.27: Distribution and intensity of marine pollution in the St. Lawrence and the Saguenay river - Marine pollution
4.3 Valued components
Characterization of valued components in the study area resulted in the description of 4 valued components divided into 83subcategories that are considered for the marine vessel activities cumulative effects assessment (Table 4.12). The subcategories were identified primarily by the availability and accessibility of data for the biophysical valued components (i.e. bank integrity, habitats, and marine mammals); thus, they should not be considered an exhaustive representation of the diversity of valued component subcategories. In the case of cultural, heritage and archeological areas of interest, the categories identified correspond to the data reported by various First Nations, but should not be interpreted as an exhaustive representation of First Nations land use (see section 4.3.5.1 for more details).
Most of the data were integrated into the study grid as presence-absence; continuous quantitative characterization was performed for marine mammals only. The approach used is described in the section specific to marine mammals. The following sections present the data and results of the data integration enabling us to characterize the valued components in the study area.
| Valued components | Type | Subcategories | Source |
|---|---|---|---|
| Habitats | Life cycles | Spawning sites | 0087, 0073, 0074, 0075, 0076 |
| Birds | 0043, 0058 | ||
| Nursery sites | 0086 | ||
| Species at risk | Threatened species | 0077 | |
| Threatened wildlife species | 0059 | ||
| Susceptible wildlife species | 0059 | ||
| Vulnerable wildlife species | 0059 | ||
| Threatened plant species | 0060 | ||
| Susceptible plant species | 0060 | ||
| Vulnerable plant species | 0060 | ||
| Endangered species | 0077 | ||
| Natural areas | Aquatic grass beds biovolume - low | 0084 | |
| Aquatic grass beds biovolume - moderate | 0084 | ||
| Aquatic grass beds biovolume - high | 0084 | ||
| Shallow water | 0053 | ||
| Mollusk beds | 0057, 0078, 0079, 0081 | ||
| Marshes | 0053 | ||
| Swamps | 0053 | ||
| Soft without cliff | 0017 | ||
| Wetland | 0053 | ||
| Rocky without cliff | 0017 | ||
| Rocky without bluff | 0017 | ||
| Fluvial terrace | 0017 | ||
| Beach terrace | 0017 | ||
| Floodplain zones | 0013, 0014 | ||
| Eelgrass | 0001, 0002, 0003 | ||
| Bank integrity | Artificial | Artificial - Semi-vegetated (EI = 1) | 0017 |
| Artificial - Active (EI = 2) | 0017 | ||
| Natural | Natural - Semi-vegetated (EI = 1) | 0017 | |
| Natural - Active (EI = 2) | 0017 | ||
| Marine mammals | Whale | St. Lawrence beluga whale | 0027 |
| Harbour porpoise | 0054 | ||
| Minke whale | 0085 | ||
| Blue whale | 0085 | ||
| Fin whale | 0085 | ||
| Humpback whale | 0085 | ||
| Seal | Harbor seal | 0054 | |
| Harp seal | 0054 | ||
| Grey seal | 0054 | ||
| Areas of interest | Mi’kmaq and Maliseet Aboriginal Fisheries Management Association | Commercial fishing | 0022 |
| Traditional fishing | 0023 | ||
| Huron-Wendat Nation | Ritual or social activities | 0055 | |
| Archeology | 0055 | ||
| Hunting | 0055 | ||
| Species at risk | 0055 | ||
| History | 0055 | ||
| Land use | 0055 | ||
| Fishing | 0055 | ||
| Harvesting of vegetation | 0055 | ||
| Toponymy | 0055 | ||
| Mohawk Nation of Kahnawà:ke | Waterfowl hunting | 0032 | |
| Culture and heritage | 0032 | ||
| Shipping | 0032 | ||
| Shoreline fishing | 0032 | ||
| Open water fishing | 0032 | ||
| Harvesting of vegetation | 0032 | ||
| Seigneurie du Sault-Saint-Louis | 0032 | ||
| W8banaki Nation | Game hunting | 0066 | |
| Migratory bird hunting | 0066 | ||
| Picking and gathering vegetation | 0066 | ||
| Shipping | 0066 | ||
| Access to territory problems | 0066 | ||
| Fishing | 0066 | ||
| Archeological sites | 0067 | ||
| Cultural sites | 0066 | ||
| Overnight sites | 0066 | ||
| Essential sites | 0066 | ||
| Sites with archeological potential | 0068 | ||
| Fur trapping | 0066 | ||
| Activity areas | 0066 | ||
| Wolastoqiyik Wahsipekuk Nation | Port development | 0072 | |
| Beluga whale watching | 0072 | ||
| Commercial fishing | 0022, 0025 | ||
| Innu Nation of Essipit | Access to the waterbody | 0024 | |
| Tourist activities | 0024 | ||
| Migratory bird hunting | 0024 | ||
| Seal hunting | 0024 | ||
| Culture and heritage | 0024 | ||
| Commercial fishing | 0024 | ||
| Traditional fishing | 0024 | ||
| Public | Protected areas | 0030, 0038, 0039, 0082 | |
| Heritage sites | 0044, 0045 | ||
| Shipwrecks | 0088 |
4.3.1 Plant and wildlife habitats
A data search was conducted to characterize various types of habitats characteristic of the St. Lawrence and Saguenay rivers that could be affected by marine vessel activities. The habitats considered are those for which data have been open and accessible from the federal and provincial platforms Open Government, Données Québec and the St. Lawrence Global Observatory, or data shared by various departments/ministries and partners. This data search enabled us to characterize 26 habitat types within the study area (Table 4.13). The habitats were characterized as presence-absence in the study grid. The following sections provide more information on the characterization of the various habitat types.
| Categories | Subcategories | Description | Area \(km^2\) | Source\(^*\) |
|---|---|---|---|---|
| Life cycles | Birds | Known sites of importance to birds, such as nesting sites and seabird colonies | 1228.08 | 0043,0058 |
| Life cycles | Nursery sites | Feeding and protection sites for early life stages of fish (e.g. larvae, fry, juveniles) | 991.47 | 0086 |
| Life cycles | Spawning sites | Spawning sites where female fish lay eggs for fertilization by males | 1199.08 | 0087,0073,0074,0075,0076 |
| Species at risk | Threatened wildlife species | Wildlife species designated as threatened | 573.51 | 0059 |
| Species at risk | Susceptible wildlife species | Wildlife species likely to be designated as threatened or vulnerable | 104.79 | 0059 |
| Species at risk | Vulnerable wildlife species | Wildlife species designated as vulnerable | 621.30 | 0059 |
| Species at risk | Threatened plant species | Plant species designated as threatened | 2.04 | 0060 |
| Species at risk | Susceptible plant species | Plant species likely to be designated as threatened or vulnerable | 0.95 | 0060 |
| Species at risk | Vulnerable plant species | Plant species designated as vulnerable | 0.13 | 0060 |
| Species at risk | Threatened species | Species listed as Threatened under the Species at Risk Act (SARA) | 0.04 | 0077 |
| Species at risk | Endangered species | Species listed as Endangered under the Species at Risk Act (SARA) | 1362.77 | 0077 |
| Natural areas | Eelgrass | Distribution of eelgrass (Zostera marina) | 25.76 | 0001,0002,0003 |
| Natural areas | Floodplain zones | Land with a high probability of flooding based on a 2-year, 20-year or 100-year flood recurrence | 508.00 | 0013,0014 |
| Natural areas | Soft without cliff | Unconsolidated deposit without cliff | 6.08 | 0017 |
| Natural areas | Rocky without cliff | Consolidated rock without cliff | 1.71 | 0017 |
| Natural areas | Rocky without bluff | Rocky bank without bluff | 6.18 | 0017 |
| Natural areas | Fluvial terrace | Accumulation bank located at the mouth of a river composed of unconsolidated deposits colonized by vegetation | 26.48 | 0017 |
| Natural areas | Beach terrace | Accumulation area of unconsolidated deposits (sand and/or coastal gravel) formed by a flat colonized by herbaceous vegetation, sometimes flooded only during higher high water high tide. The flat is sometimes bordered on its lower part by an erosional bluff (microcliff) of less than 2 m in height and on its upper part by a dead cliff or a flat terrain | 0.94 | 0017 |
| Natural areas | Shallow water | A wetland with a water level of less than 2 m and with floating or submerged aquatic plants and emergent plants that cover less than 25% of the wetland area. | 279.91 | 0053 |
| Natural areas | Marshes | A wetland on a mineral deposit, dominated by herbaceous vegetation covering more than 25% of the area. Shrubs and trees, when present, cover less than 25% of the area of the wetland. | 169.42 | 0053 |
| Natural areas | Swamps | A wetland on a mineral deposit, dominated by ligneous, shrubby or arborescent vegetation covering more than 25% of the area. | 38.46 | 0053 |
| Natural areas | Wetland | Includes wetlands of unknown type. | 28.55 | 0053 |
| Natural areas | Mollusk beds | Known and harvested Stimpson’s surf clam, Arctic wedge clam, Atlantic razor clam, and softshell clam deposits in Quebec coastal waters | 87.81 | 0057,0078,0079,0081 |
| Natural areas | Aquatic grass beds biovolume - low | Areas with low aquatic grass beds biovolume | 19.27 | 0084 |
| Natural areas | Aquatic grass beds biovolume - moderate | Areas with moderate aquatic grass beds biovolume | 9.57 | 0084 |
| Natural areas | Aquatic grass beds biovolume - high | Areas with high aquatic grass beds biovolume | 13.98 | 0084 |
4.3.1.1 Habitats that are important to life cycles
4.3.1.1.1 Spawning and nursery sites
We thank Marc Mingelbier and Marie-Josée Gagnon from the Ministère de l’Environnement, de la Lutte contre les changements climatiques, de la Faune et des Parcs du Québec for the discussions and support.
The unique identifiers given to the data presented in this section are: 0073, 0074, 0075, 0076, 0086, 0087. Refer to the following section and to Appendix 1 for more details on these data.
Spawning sites are environments critical to the maintenance of fish populations; indeed, disturbances to these sites, or to species behaviour during the spawning period, can have major impacts on fish population dynamics. Similarly, feeding and protection sites for early life stages of fish (e.g. larvae, fry, juveniles) are much more susceptible to disturbances to their habitat. These sites, called nursery areas, are thus critical to fish survival. This means that the protection of spawning and nursery sites is of major importance since they constitute a bottleneck for fish population dynamics.
The data used to characterize spawning and nursery areas in the study area come from an in situ observation data integration exercise covering the period from 1974 to 2019 (Ministère des Forêts, de la Faune et des Parcs, 2020). Those were updated through the 2023 update with more recent data [Ministère de l’Environnement, de la Lutte contre les changements climatiques, de la Faune et des Parcs (2023c); Ministère de l’Environnement, de la Lutte contre les changements climatiques, de la Faune et des Parcs (2023a); Tableau 4.14].The identified spawning and nursery sites aggregate data for 71 and 49 fish species, respectively, and cover an area of approximately 275 and 230 \(km^2\) within the study area. The data aggregate confirmed or potential spawning and nursery sites where habitats were deemed suitable for fish spawning or rearing. Therefore, it is likely that these data are partial and should not be considered an exhaustive description of spawning and nursery sites in the study area. The data are composed of points and polygons. We added a 100 \(m\) buffer zone around the points, and then incorporated the presence of spawning sites within our 1 \(km^2\) study grid.
The data used to characterize spawning areas in the marine sector come from the integration of 4 datasets from the Department of Fisheries and Oceans Canada describing the spawning areas of American shad [Alosa sapidissima; Pêches et Océans Canada (2019c)], lake sturgeon [Acipenser fulvescens; Pêches et Océans Canada (2019a)], Atlantic sturgeon [Acipenser oxyrhynchus; Pêches et Océans Canada (2019b)] and rainbow smelt [Osmerus mordax; Pêches et Océans Canada (2019d)]. Those data were integrated in the study grid along with data from the fluvial sector.
| Source | Number of spawning sites | Spawning sites area \(km^2\) | Number of nursery sites | Area of nursery sites \(km^2\) |
|---|---|---|---|---|
| 18639 | 738.96 | |||
| ARGUS. 2001. Mise en valeur du littoral de l’agglomération de la Capitale nationale du Québec: élaboration d’un cadre d’analyse régional. Commission de la Capitale nationale. 54 p. + annexes. | 15 | 67.21 | ||
| Alliance Environnement GDG Conseil-Daniel Arbour & Associés (n.d.) Frayère PLIO adapté de Lavoie et Talbot 1984 [document cartographique]. 1 : 340 000, Alliance Environnement GDG Conseil-Daniel Arbour & Associés, Trois-Rivières, Québec. | 23 | 75.26 | ||
| Argus inc. (Les consultants en environnement). 1995b. Barachois de Malbaie: étude d’avant-projet de conservation et de mise en valeur. Rapport présenté au Club des ornithologues de la Gaspésie dans le cadre du programme Saint-Laurent Vision 2000. 71 | 1 | 0.80 | ||
| Benoit, J., J.-C. Bourgeois, S. Desjardins et J. Picard. 1988. Plan de conservation et de mise en valeur des habitats et de la faune de la région du lac Saint-Pierre. Ministère des Loisirs, de la Chasse et de la Pêche du Québec, Directions régio | 4 | 0.91 | ||
| Benoit, J., J.-C. Bourgeois, S. Desjardins et J. Picard. 1988. Plan de conservation et de mise en valeur des habitats et de la faune de la région du lac Saint-Pierre. Ministère des Loisirs, de la Chasse et de la Pêche du Québec, Directions régionale* | 76 | 51.17 | ||
| Bernatchez, S., Valiquette, E., Vachon, N., Brodeur, P., Côté, C., Hatin, D., L’Italien, L. et Y. Paradis. 2019. Lake Sturgeon (Acipenserfulvescens) spawning sites in the St. Lawrence river system, Québec, Canada. Ministère des Forêts, de la F | 127 | 1.04 | ||
| Blais, J.-P. et V. Legendre. 1976. | 3 | 0.14 | ||
| Bouchard, D. 1976. Localisation des frayères des principales espèces de poissons d’intérêt sportif et commercial, dans le fleuve Saint-Laurent. (Phase 1). Québec, Ministère du Loisir, de la Chasse et de la Pêche, Service de la recherche biolog | 35 | 3.56 | ||
| Boulet, M., J. Leclerc et P. Dumont. 1995; Boulet, M., Y. Chagnon et J. Leclerc. 1996; Dumont, P., J. Leclerc et L. Bouthillier. 1989a. | 1 | 0.11 | ||
| Bourque, M. et J.Malouin (2009). Guide d’intervention en matière de conservation et de mise en valeur des littoraux de la MRC de Sept-Rivières. Comité ZIP Côte-Nord du Golfe, 153 p. + 1 annexe. | 10 | 0.31 | ||
| Bourque, M., V. Provost et G. Mazo (2009). Guide d’intervention en matière de conservation et de mise en valeur des habitats littoraux d’intérêt en Basse-Côte-Nord. Comité ZIP Côte-Nord du Golfe, vi + 166 p. | 28 | 0.88 | ||
| Bouthillier, L., P. Dumont et G. Roy. 1993. | 1 | 0.24 | ||
| Bouthillier, L., P. Dumont et G. Roy. 1993. Répertoire des habitats du poisson de la région de Montréal, Québec. Ministère du Loisir, de la Chasse et de la Pêche du Québec, Direction régionale de Montréal. ii + 6 p. + fiches et cartes | 2 | 0.28 | ||
| COMITÉ ZIP DES SEIGNEURIES, 2010. Atlas des habitats du chevalier cuivré (Moxostoma hubbsi). 2e édition. Joliette. vii + 67 pages. | 69 | 0.78 | ||
| Comité ZIP de la rive nord de l’estuaire (2001). Plan de protection et de mise en valeur du banc de Portneuf. Rédigé par Naturam Environnement Inc. et déposé au Comité ZIP de la rive nord de l’estuaire, 70 p. | 5 | 1.96 | ||
| Comité ZIP de la rive nord de l’estuaire (2008). Guide d’intervention en matière de protection et de mise en valeur des habitats littoraux d’intérêt de la rive nord de l’estuaire maritime (fiches 14 à 20), 8 p. + 7 fiches + annexe. | 3 | 0.10 | 2 | 0.03 |
| Comité Zone d’intervention Prioritaire Côte-Nord du Golfe (2008). Une histoire de pêche…Le savoir des aînés au service de la communauté! Rapport final remis au programme Nouveaux horizons pour les ainés, 18 p. | 38 | 0.00 | ||
| Comité d’étude sur le fleuve Saint-Laurent (1975). Études biologiques, Annexe cartographique au vol. 1, Dimension environnement Ltée, Montréal, 1413 p. | 124 | 33.57 | ||
| DGFa 04-17 (2019a) Base de données Poisson Fleuve [shp]. V.26 mars 2019, 1 : 20 000, DGFa 04-17, Trois-Rivières. | 3014 | 30.37 | ||
| DGFa 04-17 (2019b) Base de données Historique partielle [shp]. V.11 décembre 2019, 1 : 20 000, DGFa 04-17, Trois-Rivières. | 54 | 0.31 | ||
| DGFa 05-06-13-16 (2020) Base de données frayères [FGDB]. V.2020, 1 : 20 000, DGFa 05-06-13-16, Longueuil. | 10 | 2.54 | ||
| Dimension Environnement SNC. 1990; LaHaye, M. et R. Fortin. 1990; Desjardins, S. et P. Dumont. 1990; Dumont, P. et R. Fortin. 1977. | 1 | 0.07 | ||
| Dubé, J., M. Letendre, M. Beaudoin et B. Dumas. 1992. Marina l’Escale inc. Relevés sur l’habitat du poisson au printemps 1992. Lots 6-P, 7-P et littoral de la rivière Richelieu, Notre-Dame-du-Mont-Carmel, MRC du Haut-Richelieu. Québec, MLCP, 13 p. | 1 | 0.42 | ||
| Dumont, P., J. Leclerc et Y. Chagnon. 1990. Pêche électrique sur la rivière Yamaska le 18 avril 1990. Québec, Ministère du Loisir de la Chasse et de la Pêche, Service de l’aménagement et de l’exploitation de la faune, Montréal. [Données non pub | 1 | 0.11 | ||
| Dumont, P. et R. Fortin. 1977. | 34 | 15.25 | ||
| Dumont, P., J. Leclerc et L. Bouthillier. 1989b. | 4 | 37.29 | ||
| Dumont, P., J. Leclerc et Y. Chagnon. 1990. | 1 | 0.11 | ||
| Enquête auprès des agents des pêches du MPO. 1994. | 1 | 0.18 | ||
| Enquête auprès des pêcheurs et agents du MEF et du MPO. 1995. | 2 | 31.34 | ||
| Fournier, P. et L.-M. Soyez. 1988. | 2 | 0.06 | ||
| Fréchet, A., Dodson J.J., Powles, H. 1983; Enquête auprès des agents des pêches du MPO. 1994. | 2 | 0.18 | ||
| Gagnon, M., Y. Ménard et J.-F. La Rue. 1993. | 3 | 394.85 | ||
| Gagnon, M., Y. Ménard et J.-F. La Rue. 1993. Caractérisation et évaluation des habitats du poisson dans la zone de transition saline du Saint-Laurent. Rapp. tech. can. sci. halieut. aquat. 1920: viii + 104 p. | 1 | 336.39 | ||
| Gendron, M. 1986; Gendron, M. 1987; Gendron, M. 1988; Fournier, P. et L.-M. Soyez. 1988. | 2 | 0.04 | ||
| Guay G. et M. Couillard. 1985. Étude de l’utilisation printanière et automnale des rapides de Lachine par les poissons. Projet d’archipel de Montréal (1984). Environnement illimité Inc., 1976 p. | 356 | 1.74 | ||
| Guay, G. et M. Couillard. 1985; Laramée, P. 1983; Dumont, P. et S. Desjardins. 1989. | 1 | 0.38 | ||
| HEPPELL, M., I. PICARD, F. BÉLISLE et C. THÉBERGE (2000). Guide d’intervention en matière de protection et de mise en valeur des habitats littoraux d’intérêt de la rive nord de l’estuaire maritime. Version finale. | 29 | 23.38 | 2 | 3.52 |
| Hatin, D. et F. Caron. 2002. | 2 | 67.41 | ||
| Hatin, D. et F. Caron. 2002; Hatin. D. 2003. | 1 | 0.92 | ||
| Hatin. D., F. Caron et R. Fortin. 1999. | 1 | 1.17 | ||
| Jacquaz et coll. 1990. Étude biophysique de l’habitat du poisson de quatre barachois de la baie des Chaleurs. | 3 | 0.30 | ||
| Lemieux, C. 1995.Acquisition de connaissances des habitats côtiers dans la région de Rimouski (1995). Rapport du Groupe-Conseil GENIVAR présenté au Ministère des Pêches et des Océans du Canada, Division de la Gestion de lHabitat du Poisson, 52 | 1 | 15.10 | ||
| Lemieux, C. 1996. Acquisition de connaissances des habitats côtiers de l’Anse Saint-Jean et de la baie Sainte- Marguerite dans la région du Saguenay. Rap. du Groupe conseil Genivar inc. pour la DGHP, ministère des Pêches et Océans, 79 p. + annexes. | 6 | 3.13 | ||
| Lemieux, C. et R. Lalumière. 1995. Acquisition de connaissances des habitats côtiers du barachois de Saint-Omer. Rap. du Groupe conseil Genivar inc. pour la DGHP, MPO, 44 pages + 3 ann. | 1 | 0.68 | ||
| Lesueur, C. 1995. Acquisition de connaissances du milieu côtier dans la batture de Saint-Fulgence. Rapport du Comité ZIP-Saguenay au ministère des Pêches et des Océans du Canada et au Ministère de l’Environnement et de la Faune. 38 p. + annexes. | 5 | 6.25 | ||
| Lesueur, C. 1998. Acquisition de connaissances sur les poissons migrateurs et dulcicoles du Saguenay. Rapport du projet triennal : résultats obtenus de 1995 à 1998. Rapport du Comité ZIP-Saguenay au MPO et EC. 74 p. + annexe. | 3 | 12.14 | ||
| Letendre, M., B. Dumas et M. Beaudoin. 1990. Inventaire de la rivière des Prairies, au niveau de l’île de Pierre. Québec, Ministère du Loisir de la Chasse et de la Pêche, Service de l’aménagement et de l’exploitation de la faune, Montréal. | 1 | 0.65 | ||
| Letendre, M., B. Dumas et M. Beaudoin. 1990; Dumont, P. et R. Fortin. 1977. | 2 | 0.65 | ||
| L’ITALIEN, L., J. MAINGUY et E. VALIQUETTE (2020). Dynamique et habitats de reproduction de la population réintroduite de bars rayés (Morone saxatilis) dans le fleuve Saint-Laurent, ministère des Forêts, de la Faune et des Parcs, Québec, XVI + | 2 | 1.47 | ||
| L’italien, L. (2017) Frayère d’esturgeon noir [shp]. V.2017, 1 : 50 000, DGFa 03-12, Québec. | 1 | 6.27 | ||
| Mailhot, Y. et R. Morrissette (20 juin 2012) Atlas des frayères potentielles ou confirmées et de certains autres sites d’intérêt dans les rivières de la plaine du Saint-Laurent. V.2012, 1 : 400 000, MFFP – DGFa 04-17, Trois-Rivières. | 26 | 2.07 | ||
| Mailhot, Y. et R. Morrissette (20 juin 2012) Atlas des habitats fauniques critiques et des exploitations halieutiques d’importance dans le fleuve Saint-Laurent et l’aval des tributaires à privilégier pour les interventions en cas d’urgence ma | 11 | 103.05 | ||
| Mailhot, Y. et R. Morrissette (20 juin 2012) Atlas des habitats fauniques critiques et des exploitations halieutiques d’importance dans le fleuve Saint-Laurent et l’aval des tributaires à privilégier pour les interventions en cas d’urgence maritime * | 10 | 105.59 | ||
| Massé, G. 1974. Frayères à poissons d’eau chaude du couloir fluvial, entre Montréal et el lac Saint-Pierre. Service de l’Aménagement de la Faune, Ministère du Tourisme, de la Chasse et de la Pêche. 20 p. | 142 | 39.27 | ||
| Mingelbier, M. et J., Leclerc. 2001. Preliminary atlas of fish habitat in the fluvial St. Lawrence River. 8th Annual International Conference on the St Lawrence River Ecosystem, Cornwall, Ontario. | 2803 | 125.68 | 116 | 24.23 |
| Ministère de l’Environnement et de la Faune. 1994. Cartographie des sites d’intérêt et des sites protégés et fiches synthèses descriptives des sites d’intérêt faunique. Direction régionale de la Montérégie, Service de l’aménagemen | 60 | 271.67 | ||
| Ministère de l’Environnement et de la Faune. 1994. Cartographie des sites d’intérêt et des sites protégés et fiches synthèses descriptives des sites d’intérêt faunique. Direction régionale de la Montérégie, Service de l’aménagement et de l’exploitat* | 55 | 243.65 | ||
| Ministère des Forêts, de la Faune et des Parcs (2023) Géobase-Faune - SFI_p [FGDB]. V2023-01-17, MFFP, Québec, Qc. | 990 | 28.76 | ||
| Ministère des Forêts, de la Faune et des Parcs (2023) Géobase-Faune - SFI_s [FGDB]. V2023-01-17, MFFP, Québec, Qc. | 4100 | 122.82 | ||
| Ministère des Forêts, de la Faune et des Parcs (25 mars 2013) Frayère de Shooner [shp]. V.2013, 1 : 400 000, DGFa 04-17, Trois-Rivières. | 372 | 105.56 | ||
| Ministère des Ressources naturelles (2013) Habitats essentiels [shp]. 2e trimestre, 1 : 170 000, Direction de l’expertise Énergie -Faune -Forêt-Mines-Territoire de la Mauricie et du Centre -du-Québec, Québec. | 154 | 108.80 | 60 | 105.59 |
| Naturam Environnement. 1995. | 2 | 0.39 | ||
| Naturam Environnement. 1997. Acquisition de connaissances et mise en valeur des habitats du poisson du complexe Baie Verte/Baie Laval, phase 3 : rapport final. | 1 | 20.93 | ||
| Non disponible | 6 | 70.92 | ||
| Pesca. 1997. Étude de conservation et de mise en valeur de la Pointe Verte, Maria. Rapport préliminaire présenté au ministère des Pêches et des Océans. 86p. | 2 | 0.01 | ||
| Provost, J., L. Verret et P. Dumont. 1984; Leclerc, J. 1983; Environnement Illimité inc. 1994. | 1 | 0.07 | ||
| PÉROT, A. et V. PROVOST (2008). Guide d’intervention en matière de protection et de mise en valeur des habitats littoraux d’intérêt dans la MRC de la Minganie. Comité ZIP Côte-Nord du Golfe, vii p. + 127 p. | 6 | 0.36 | ||
| Société de la Faune et des Parcs du Québec. 2000. | 12 | 146.64 | ||
| Société de la Faune et des Parcs du Québec. 2000. Atlas des habitats critiques connus ou d’intérêt particulier pour les poissons du fleuve Saint-Laurent entre le port de Montréal et l’Île aux Coudres. Direction du développement de la faune. | 5 | 800.85 | ||
| Société de la Faune et des Parcs du Québec. 2000; Bouthillier, L., P. Dumont et G. Roy. 1993. | 1 | 22.55 | ||
| Société de la Faune et des Parcs du Québec. 2000; Hatin, D. et F. Caron. 2002. | 2 | 58.23 | ||
| Société de la Faune et des Parcs du Québec. 2000; Hatin, D. et F. Caron. 2002; Hatin. D. 2003. | 1 | 0.85 | ||
| Société de la faune et des parcs du Québec. 2000. Atlas des habitats critiques connus ou d’intérêt particulier pour les poissons du fleuve Saint-Laurent entre le port de Montréal et l’Île aux Coudres. Direction du développement de la faun | 56 | 85.45 | ||
| Société de la faune et des parcs du Québec. 2000. Atlas des habitats critiques connus ou d’intérêt particulier pour les poissons du fleuve Saint-Laurent entre le port de Montréal et l’Île aux Coudres. Direction du développement de la faune. | 17 | 817.96 | ||
| Therrien, J. 1998. | 11 | 676.75 | ||
| Therrien, J., H. Marquis, G. Shooner et P. Bérubé. (1991). Caractérisation des habitats recherchés pour la fraie des principales espèces de poissons du fleuve Saint-Laurent (Cornwall-Montmagny). Étude réalisée par le Groupe Environnement Shoo | 1356 | 320.60 | ||
| Therrien, J., Marquis, H., Shooner, G. et Bérubé, P. 1991. | 10 | 1.25 | ||
| Thérrien, J., H. Marquis, G Shooner et P. Bérubé.1991. | 2 | 0.27 | ||
| Tremblay, S. 1996; Trencia, G. 2002. | 4 | 535.07 | ||
| Trencia | 13 | 71.69 | ||
| VALIQUETTE,LEGAULT, HARVEY. 2016. État référence de la faune aquatique et de ses habitats dans le secteur du pont de l’île d’Orléans : rapport final. Première partie — Description physique et inventaires biologiques, MFFP, DGGFH, DEFA, Qc | 14 | 0.63 |
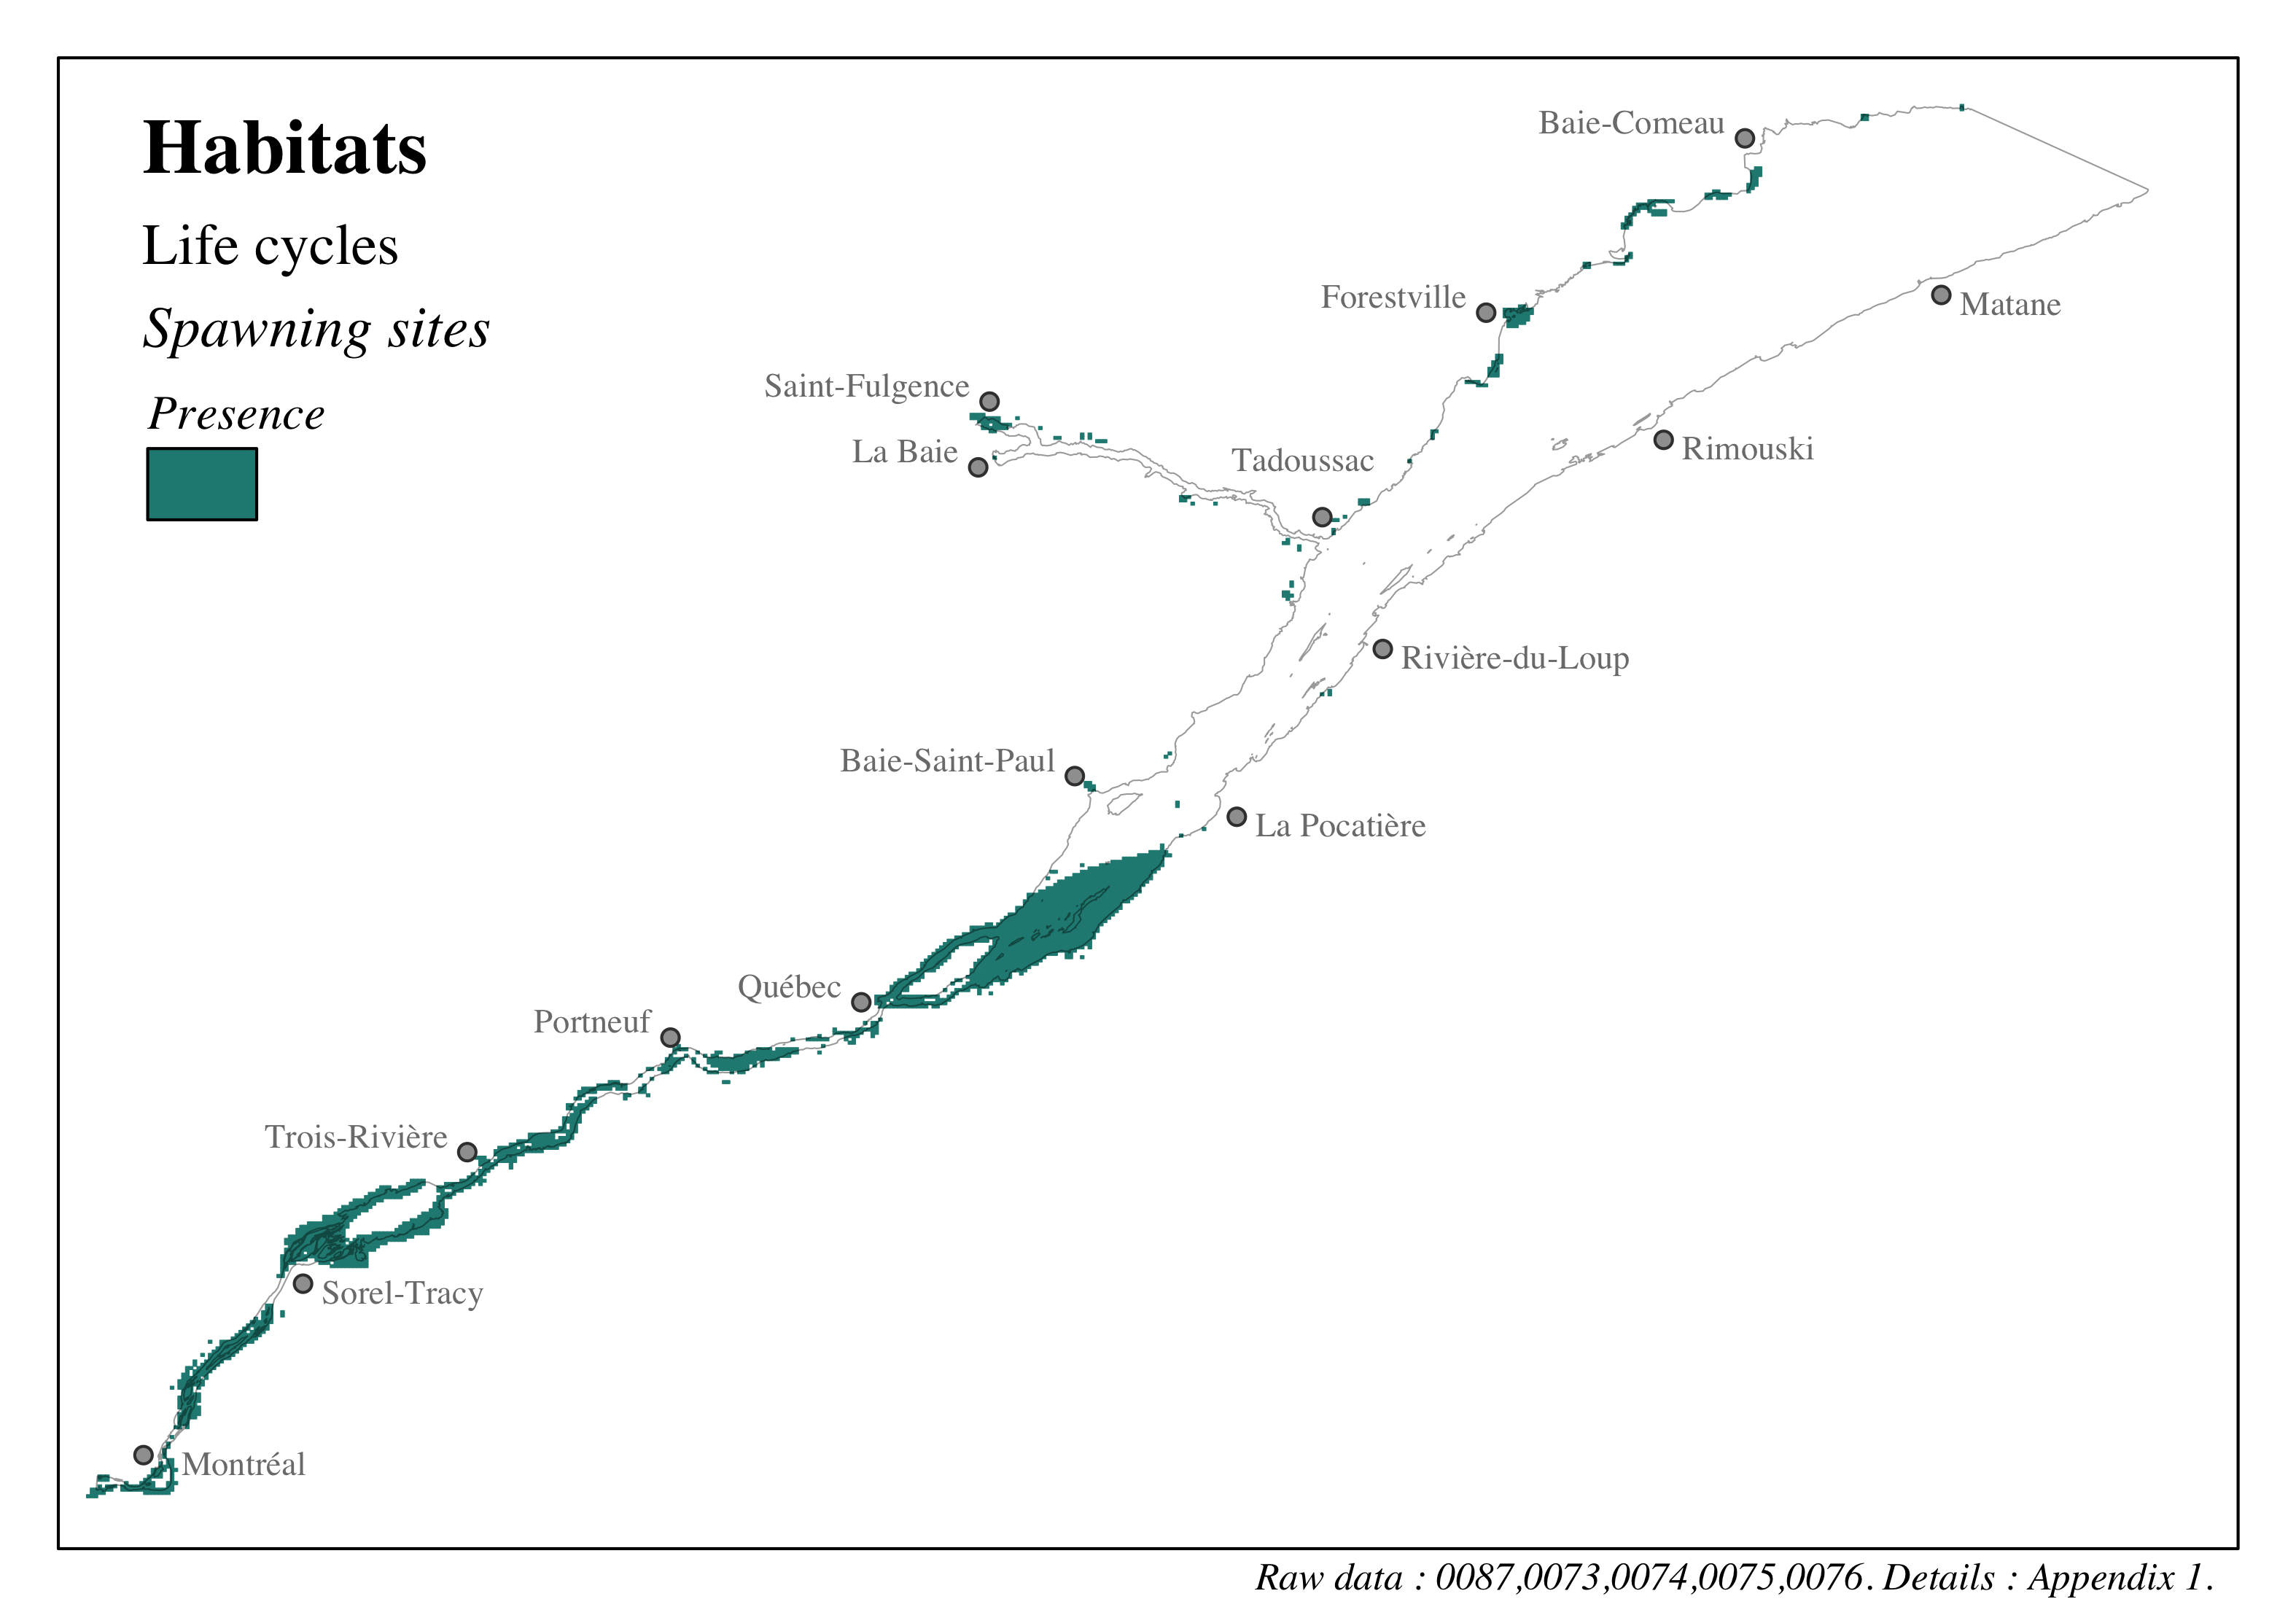
Figure 4.28: Distribution of habitats in the St. Lawrence and the Saguenay river - Spawning sites
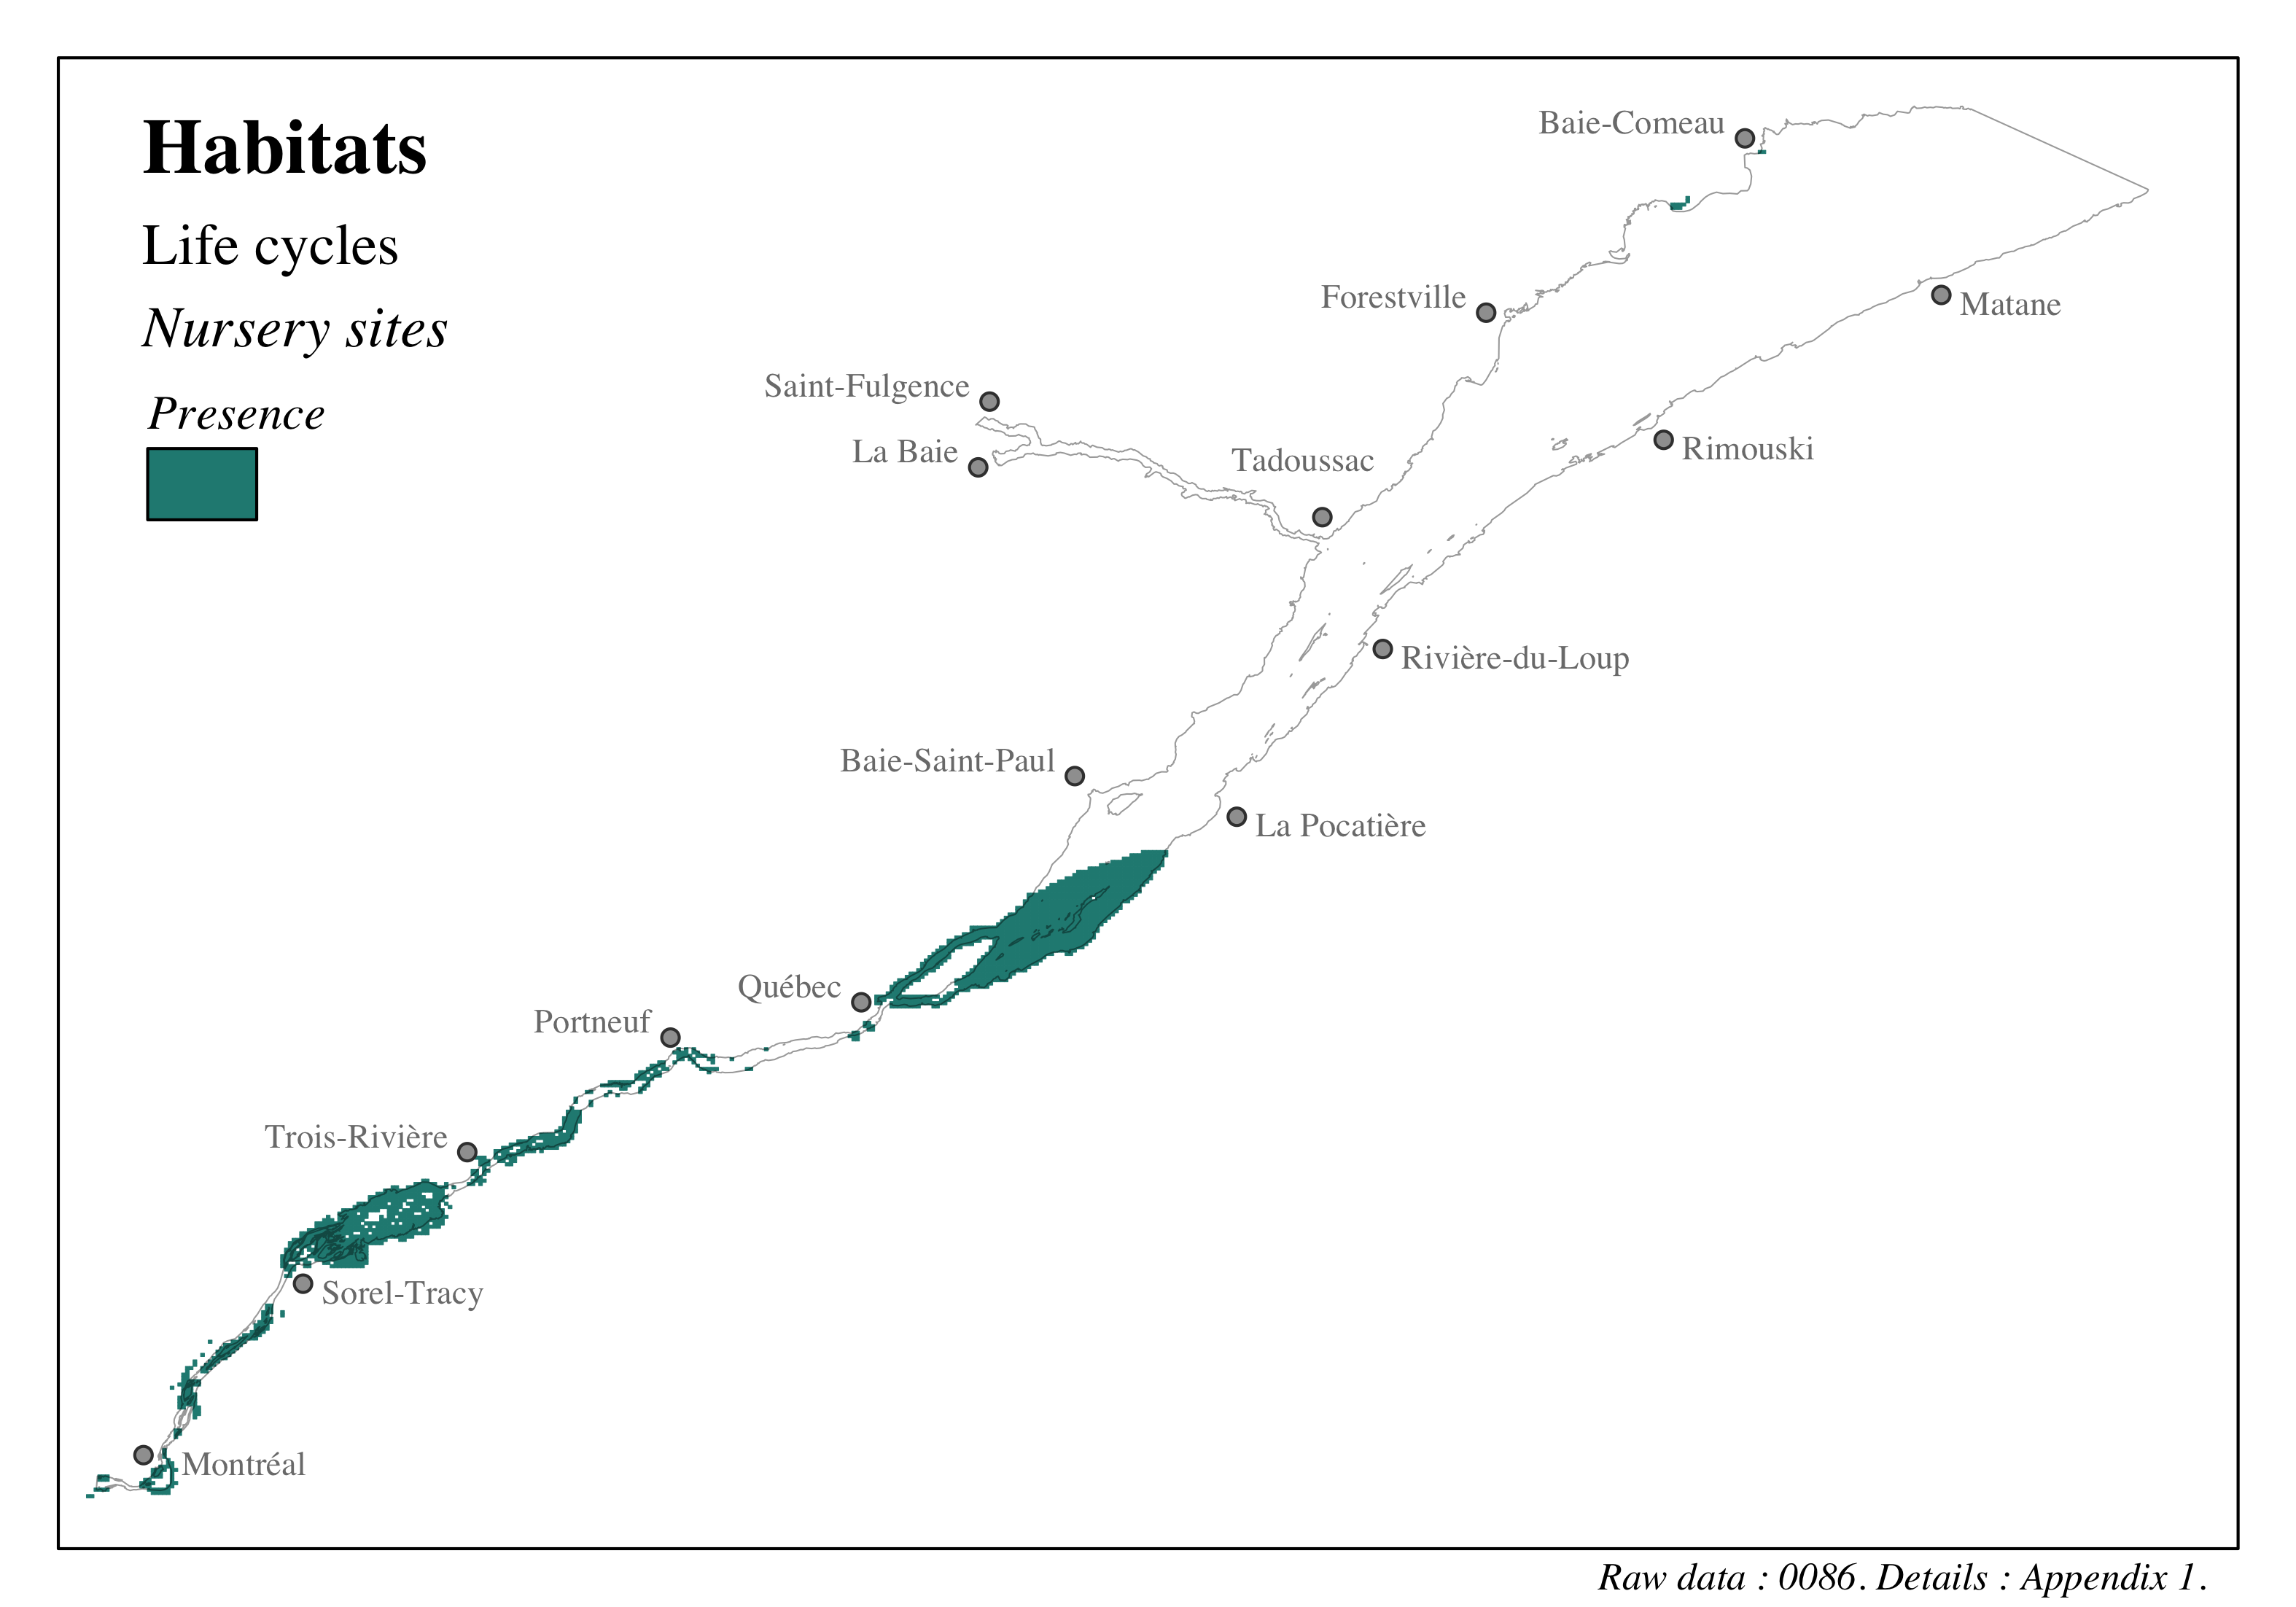
Figure 4.29: Distribution of habitats in the St. Lawrence and the Saguenay river - Nursery sites
4.3.1.1.2 Birds
We thank Jean-François Rail of Environment and Climate Change Canada for the discussions and support.
The unique identifiers given to the data presented in this section are: 0043, 0058. Refer to the following section and to Appendix 1 for more details on these data.
The data used to characterize sites of importance to birds came from two separate sources that were inserted into the study grid on a presence-absence basis. The first database, which describes the location of bird colonies, is called the Computerized Database of Quebec Seabirds [CDQS; Rail and Chapdelaine (2002); Environnement et Changement Climatique Canada (2021)]. This database was compiled and is updated by the Canadian Wildlife Service (CWS) for the Quebec region. The CDQS contains information on the location of seabird colonies and their nesting sites for the following families: Gaviidae (i.e. loons), Hydrobatidae (i.e. petrels), Sulidae (i.e. gannets/boobies), Phalacrocoracidae (i.e. cormorants), Laridae (i.e. seagulls, gulls, terns), Alcidae (i.e. guillemots, penguins, puffins), and the common eider (i.e. Anatidae). For our analysis, we considered only the location of the various colonies available through the CDQS without considering individual species in order to identify the locations that are home to seabird colonies. We also used data from the year 2000 onward only. Our study area included 113 sites with a total area of 198.65 \(km^2\).
The second database identified Important Bird Areas [IBAs; Canada (2015); Études d’oiseaux Canada (2015)]. IBAs are identified based on information on threatened bird species, sites with significant bird populations, or range-restricted species. Internationally accepted assessment criteria are used to identify IBAs. Our study area covers 41 IBA sites with a total area of 1701.26 \(km^2\).
It is important to note that these sites are land environments, meaning that they do not properly capture aquatic and marine use environments associated with these sites of importance. Extrapolation of a marine use area based on variables such as the species range and number of individuals would enable us to address this gap (e.g. Lieske et al., 2020). However, it was not possible to conduct this type of analysis as part of this pilot project.
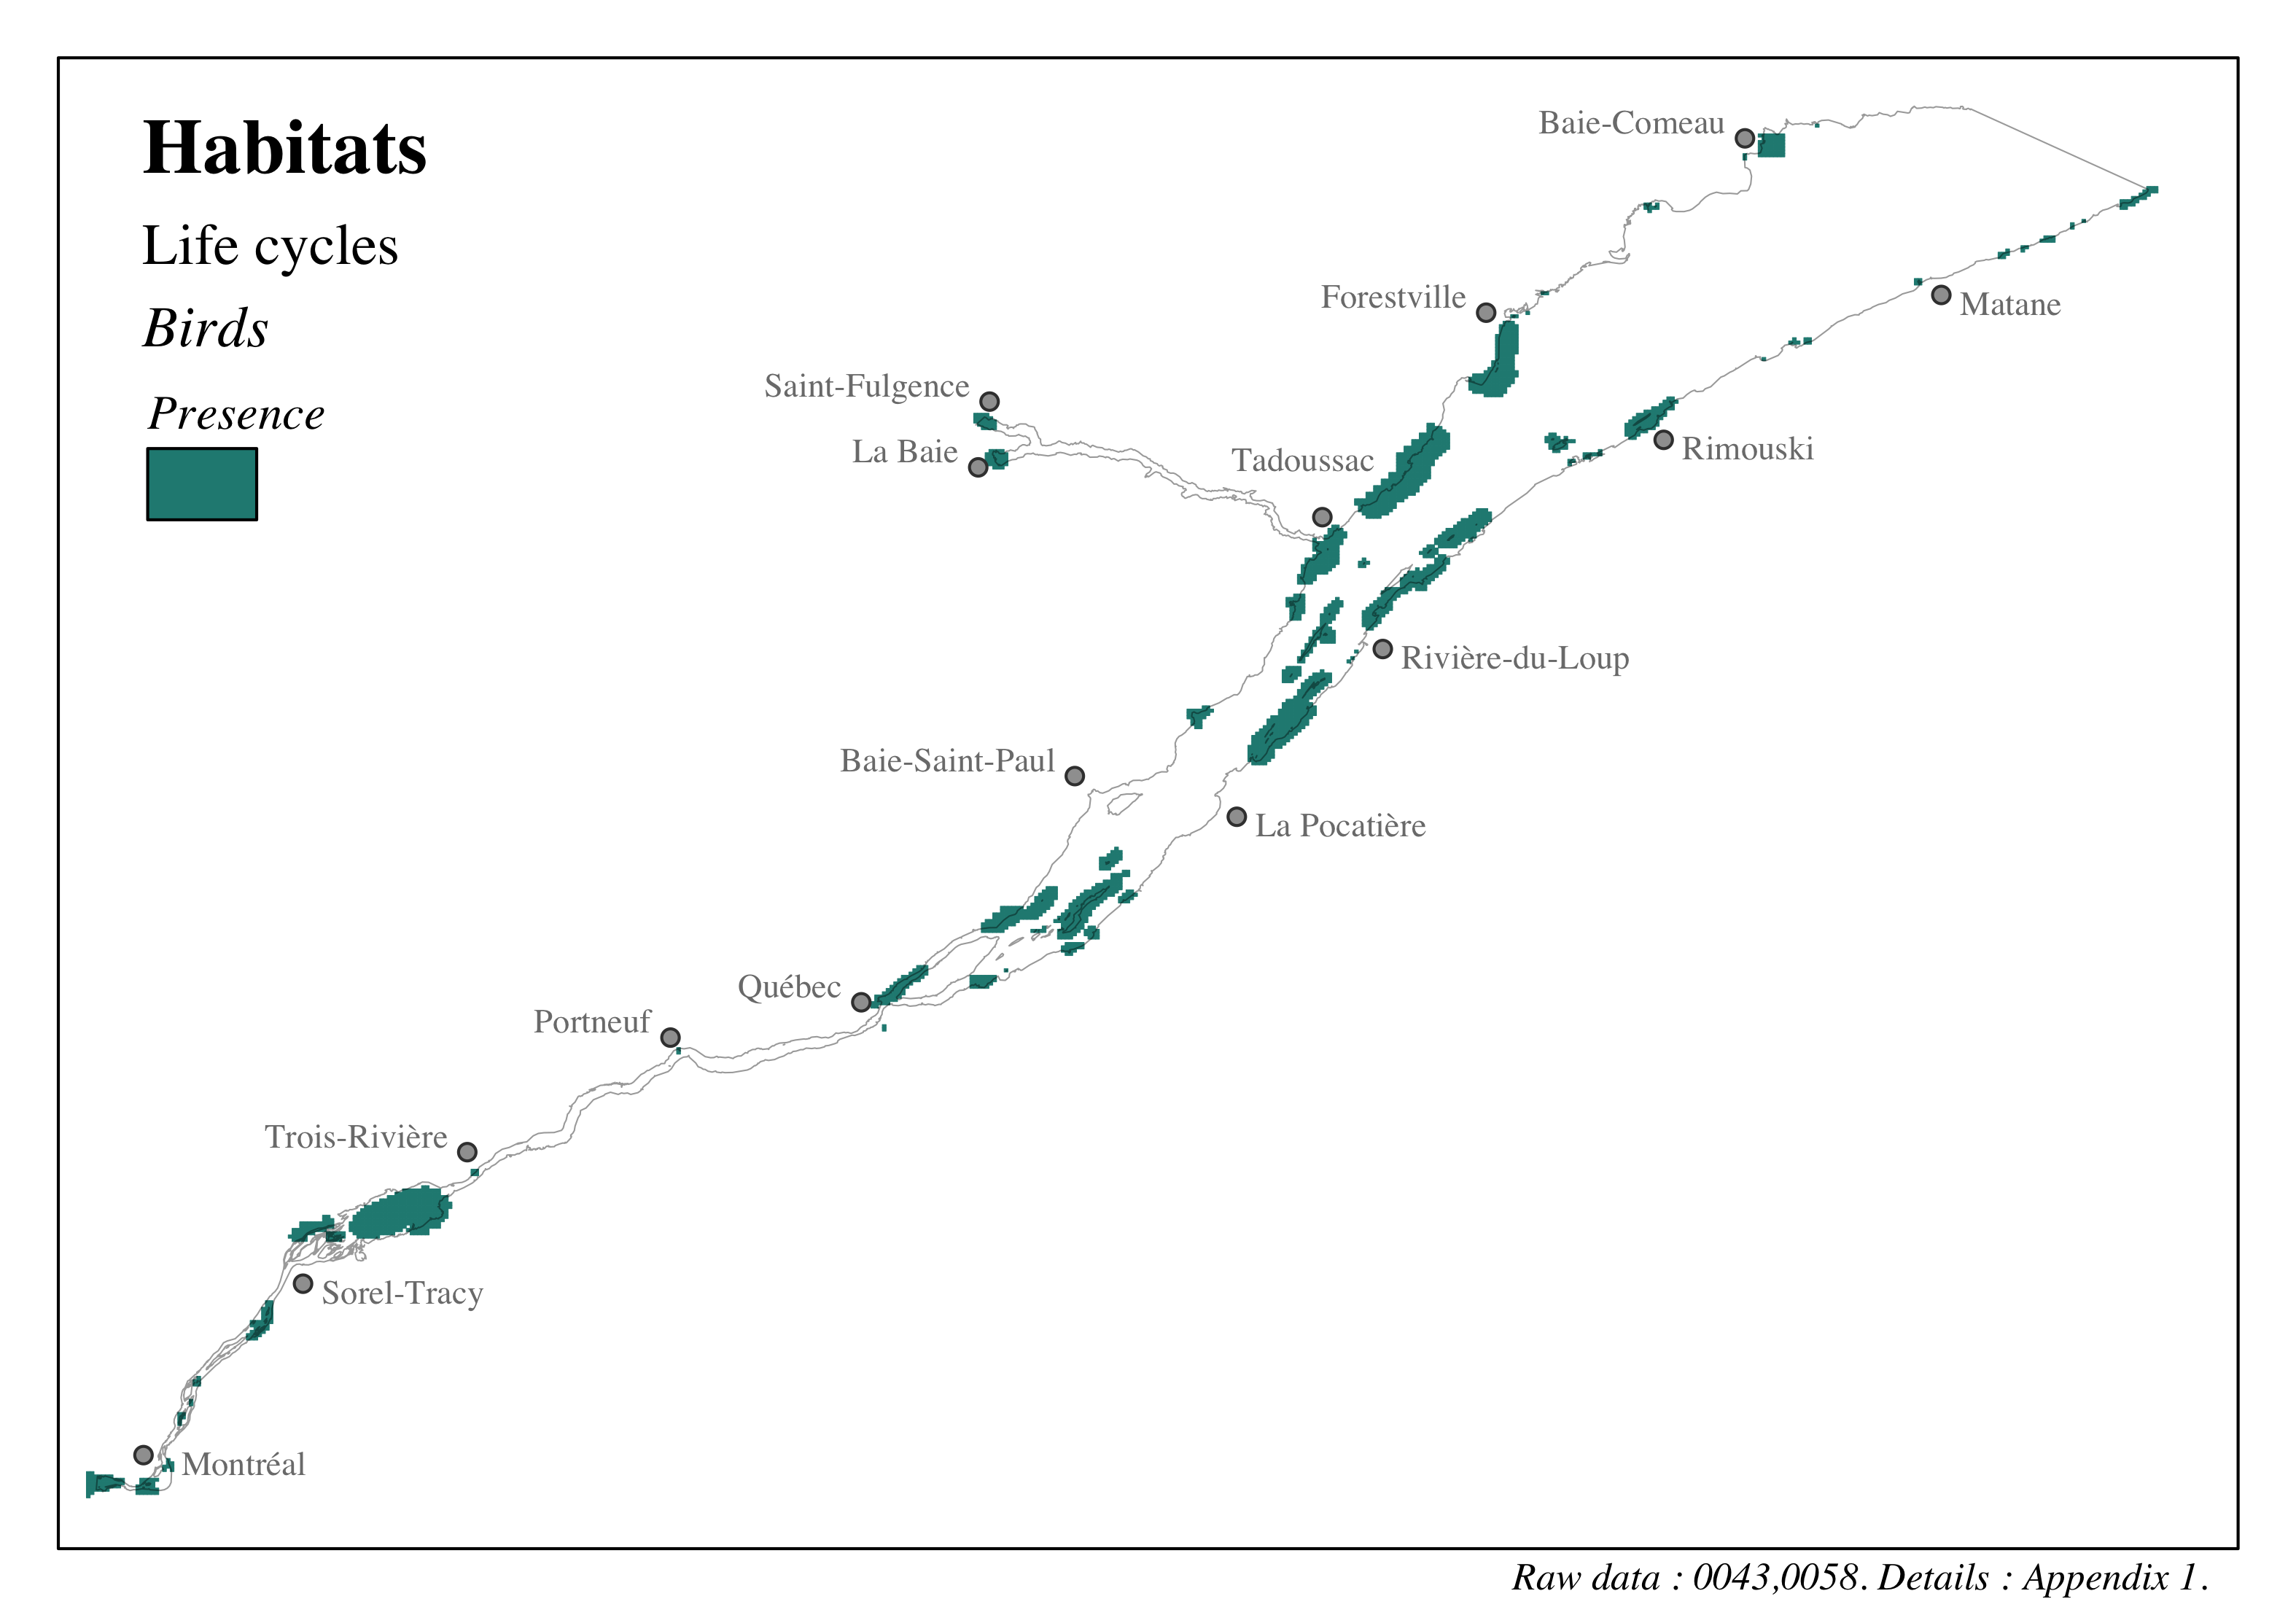
Figure 4.30: Distribution of habitats in the St. Lawrence and the Saguenay river - Birds
4.3.1.2 Endangered wildlife and plant species
The unique identifiers given to the data presented in this section are: 0059, 0060, 0077. Refer to the following section and to Appendix 1 for more details on these data.
A number of species with a precarious status frequent the waters and banks of the St. Lawrence and Saguenay rivers. In order to capture the sensitive nature of these species and incorporate them into our analysis, we considered the locations where these species have been historically sighted in the study area. The data used to characterize habitats for special status species were prepared by the Quebec Natural Heritage Data Centre (Centre de données sur le patrimoine naturel du Québec) [CDPNQ; Centre de données sur le patrimoine naturel du Québec (2021a); Centre de données sur le patrimoine naturel du Québec (2021b)]. These data contain occurrences that designate a territory that is or was home to special status species. We removed historical sightings from the database, as well as species that were extirpated or had not been sighted recently, i.e., since the year 2000. Lastly, we considered susceptible, vulnerable and threatened species. This resulted in a total of 37 species and 423 sites for wildlife species, and 64 species and 224 sites for plant species (Table 4.15). Refer to Appendix 4 and Appendix 5 for the lists of special status wildlife and plant species, respectively.
| Type | Status | Number of species | Area \(km^2\) |
|---|---|---|---|
| Wildlife | Threatened | 6 | 921.07 |
| Wildlife | Susceptible | 20 | 325.99 |
| Wildlife | Vulnerable | 11 | 1459.75 |
| Plant | Threatened | 10 | 4.45 |
| Plant | Susceptible | 49 | 8.73 |
| Plant | Vulnerable | 5 | 1.59 |
These sites of importance for special status species were integrated into the study grid as presence-absence based on status in order to identify sites that are home to susceptible, vulnerable or threatened wildlife or plant species. This means that the integrated data do not discriminate between the different species considered; rather, they provide a spatial delineation of areas frequented by special status species. This results in 6 distinct categories of sites.
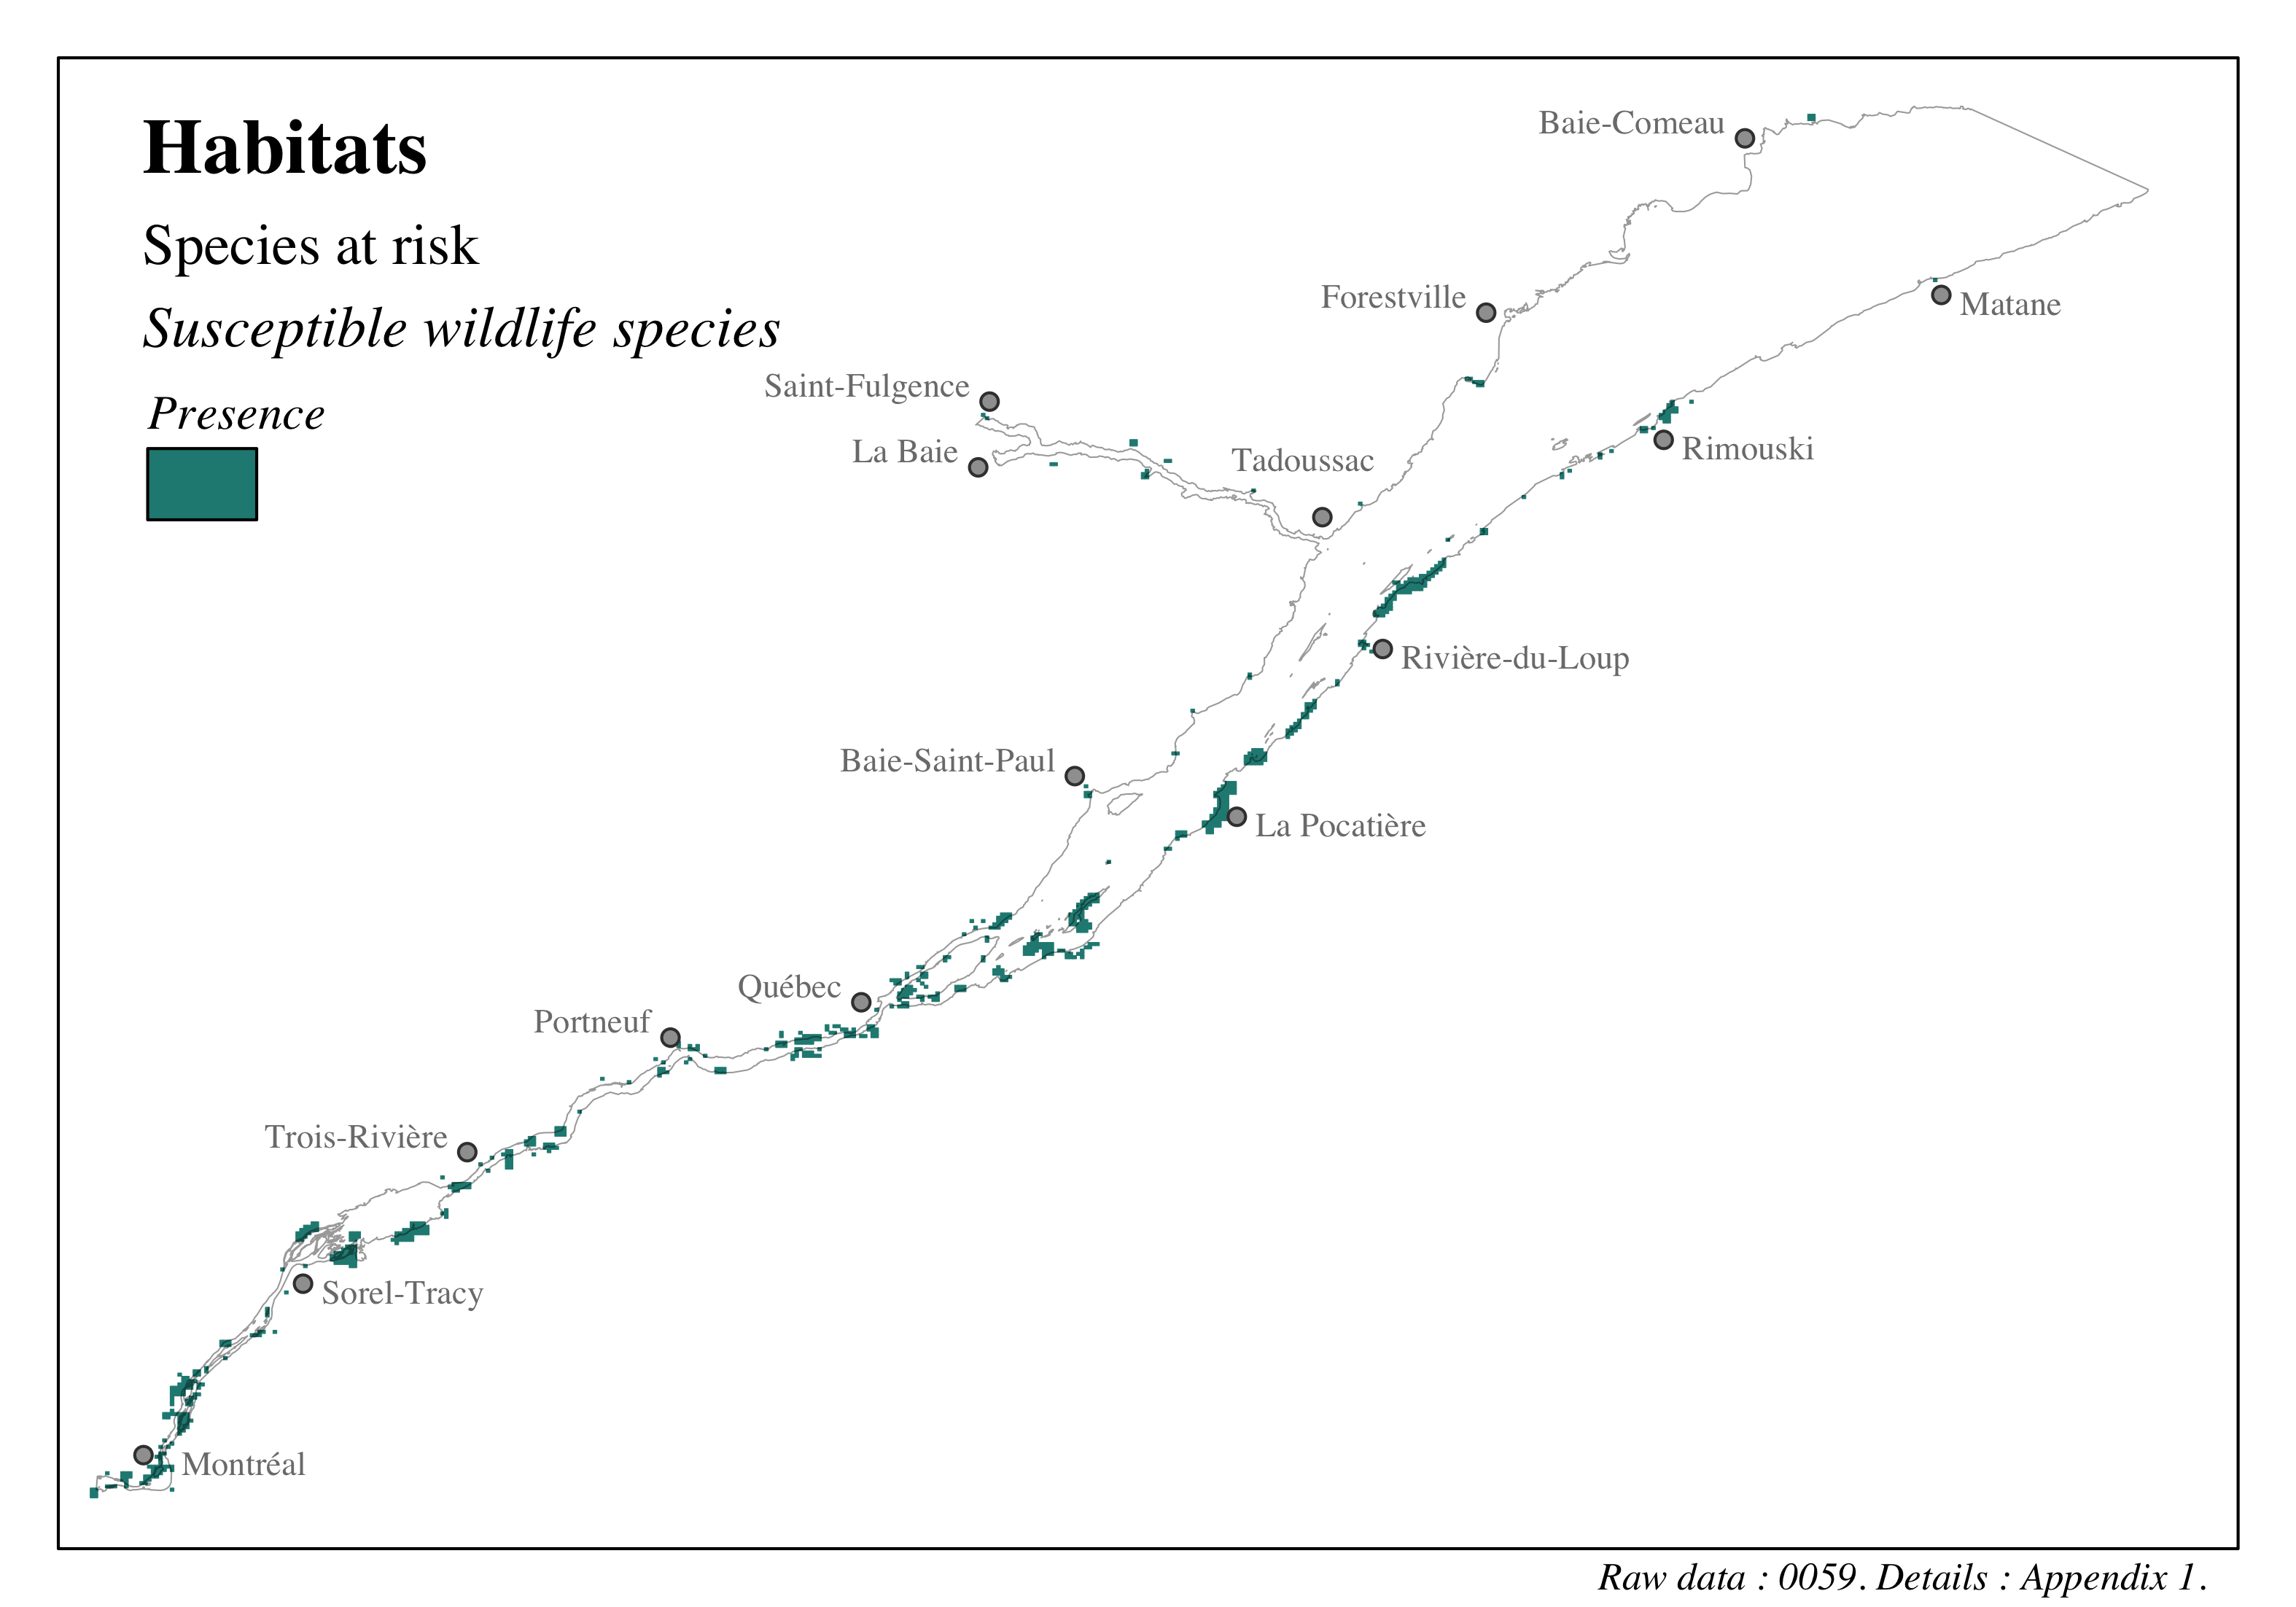
Figure 4.31: Distribution of habitats in the St. Lawrence and the Saguenay river - Susceptible wildlife species
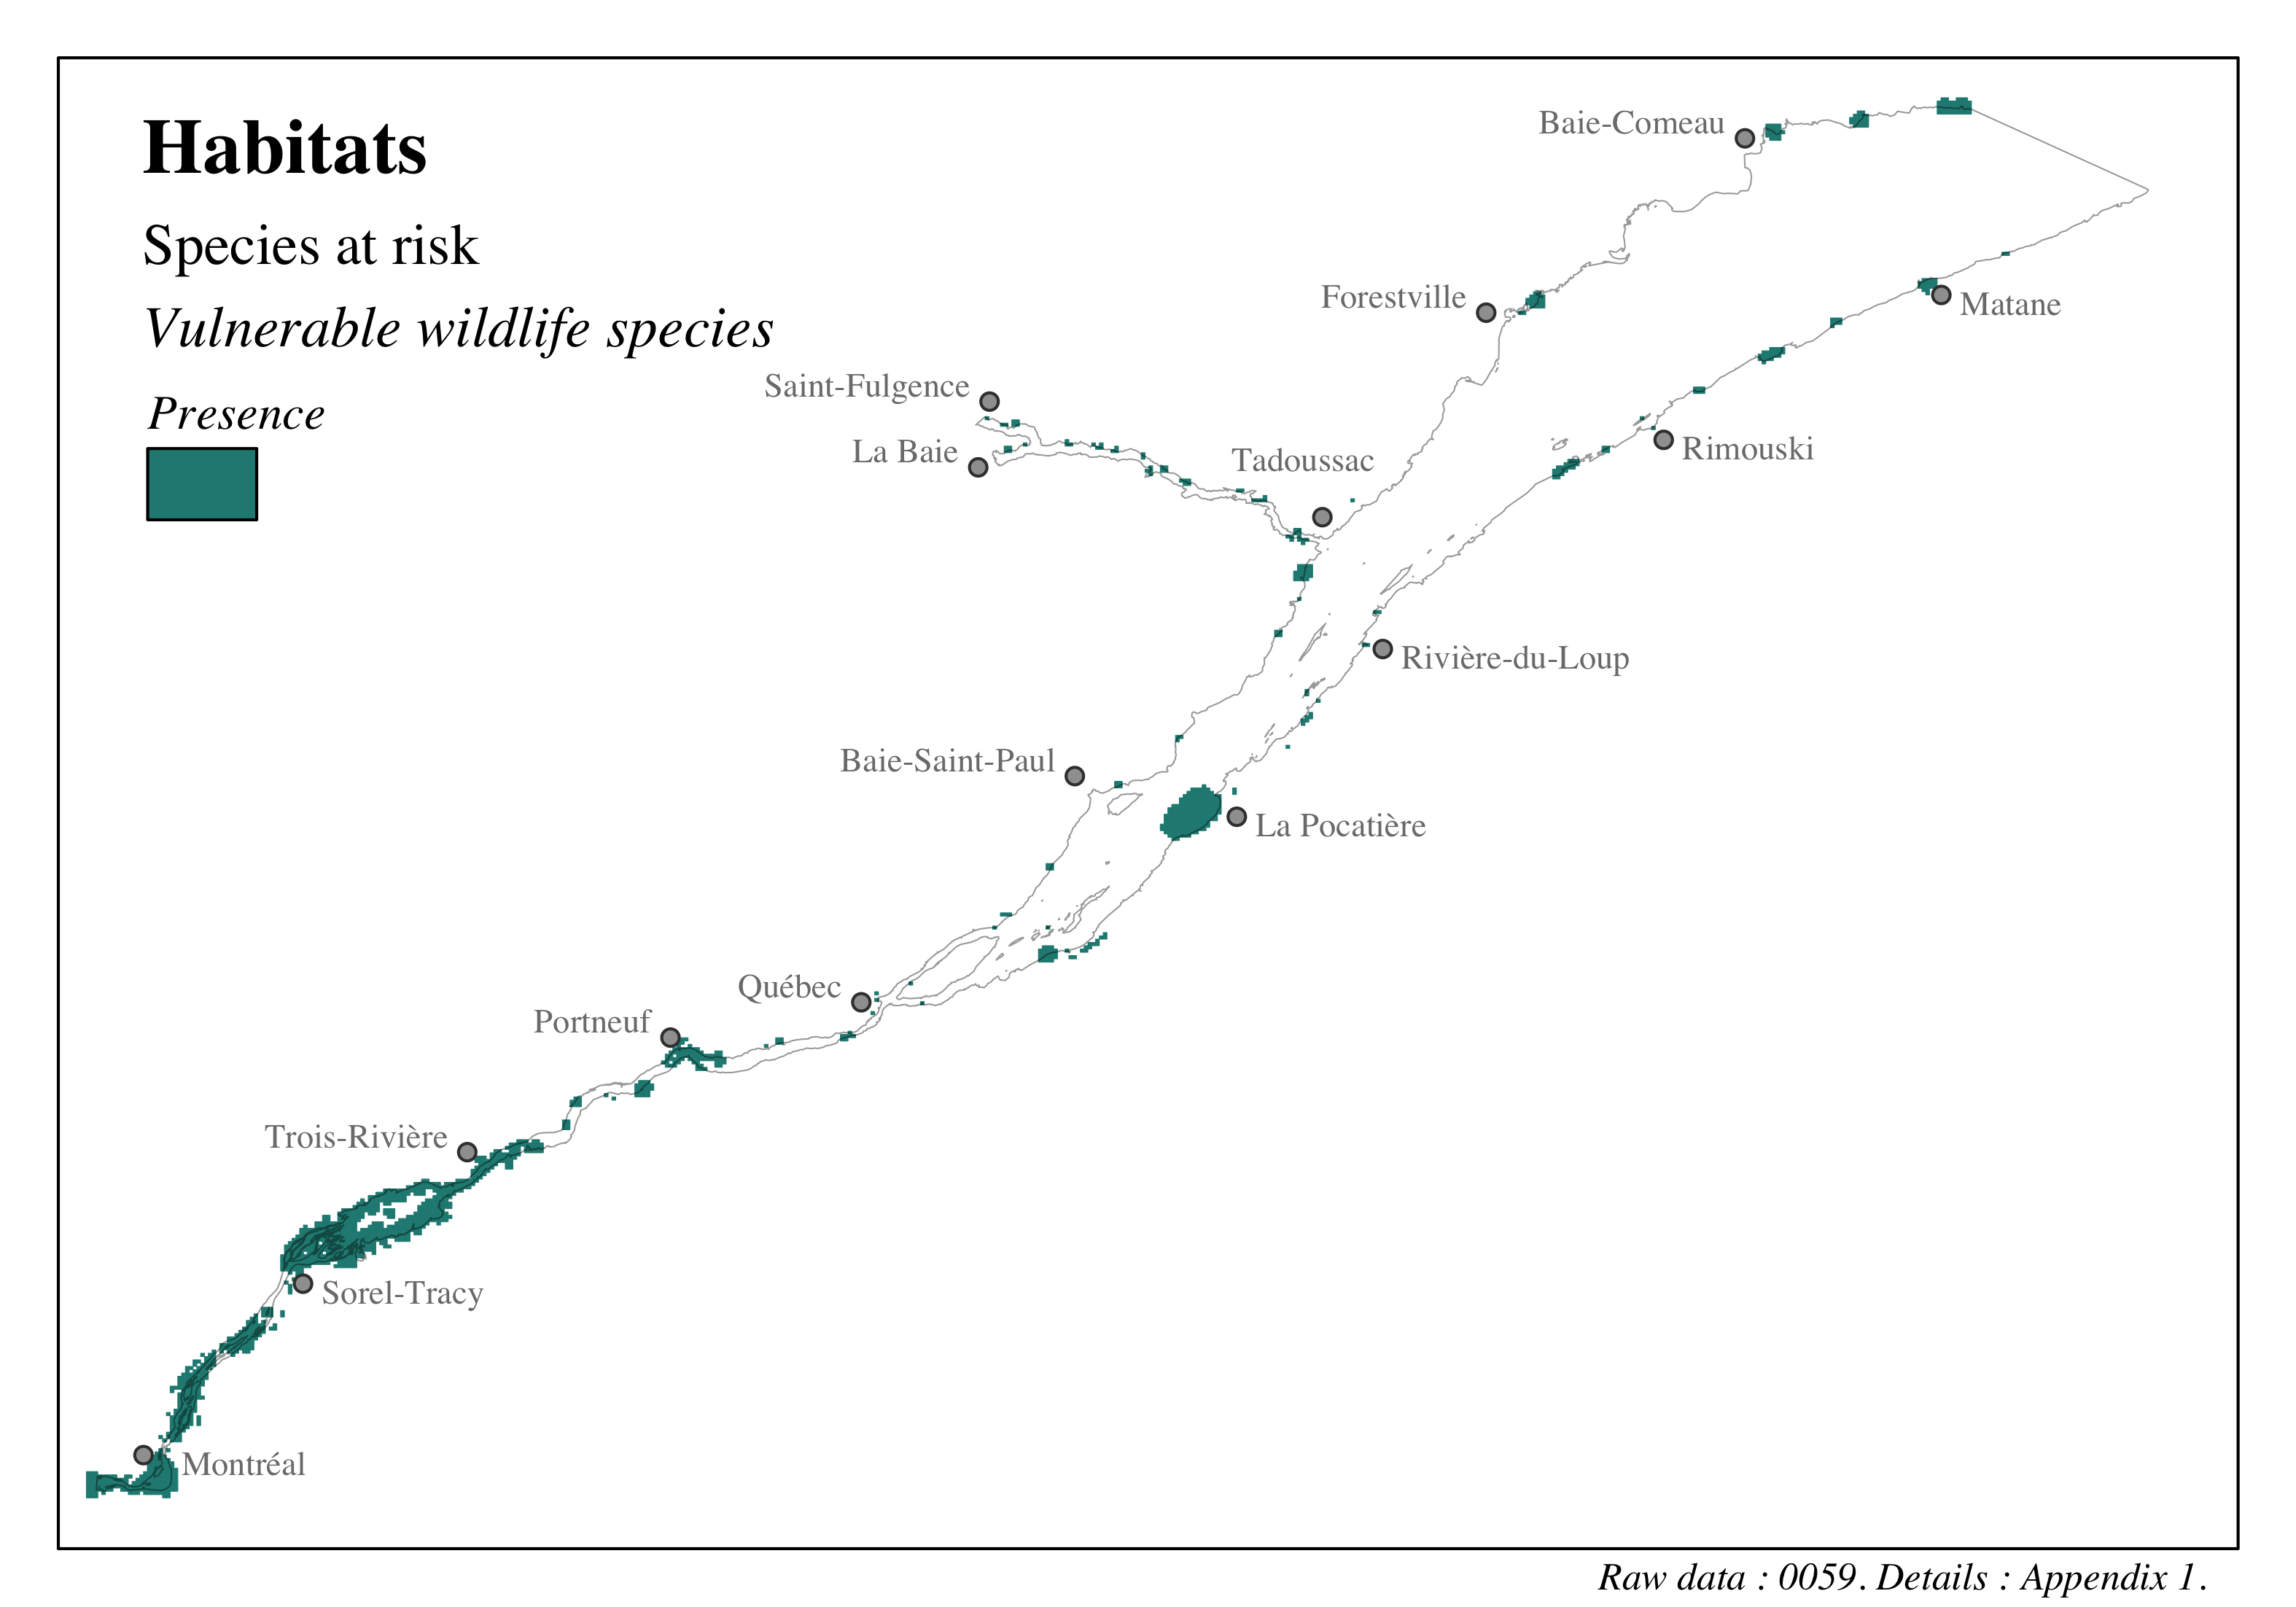
Figure 4.32: Distribution of habitats in the St. Lawrence and the Saguenay river - Vulnerable wildlife species
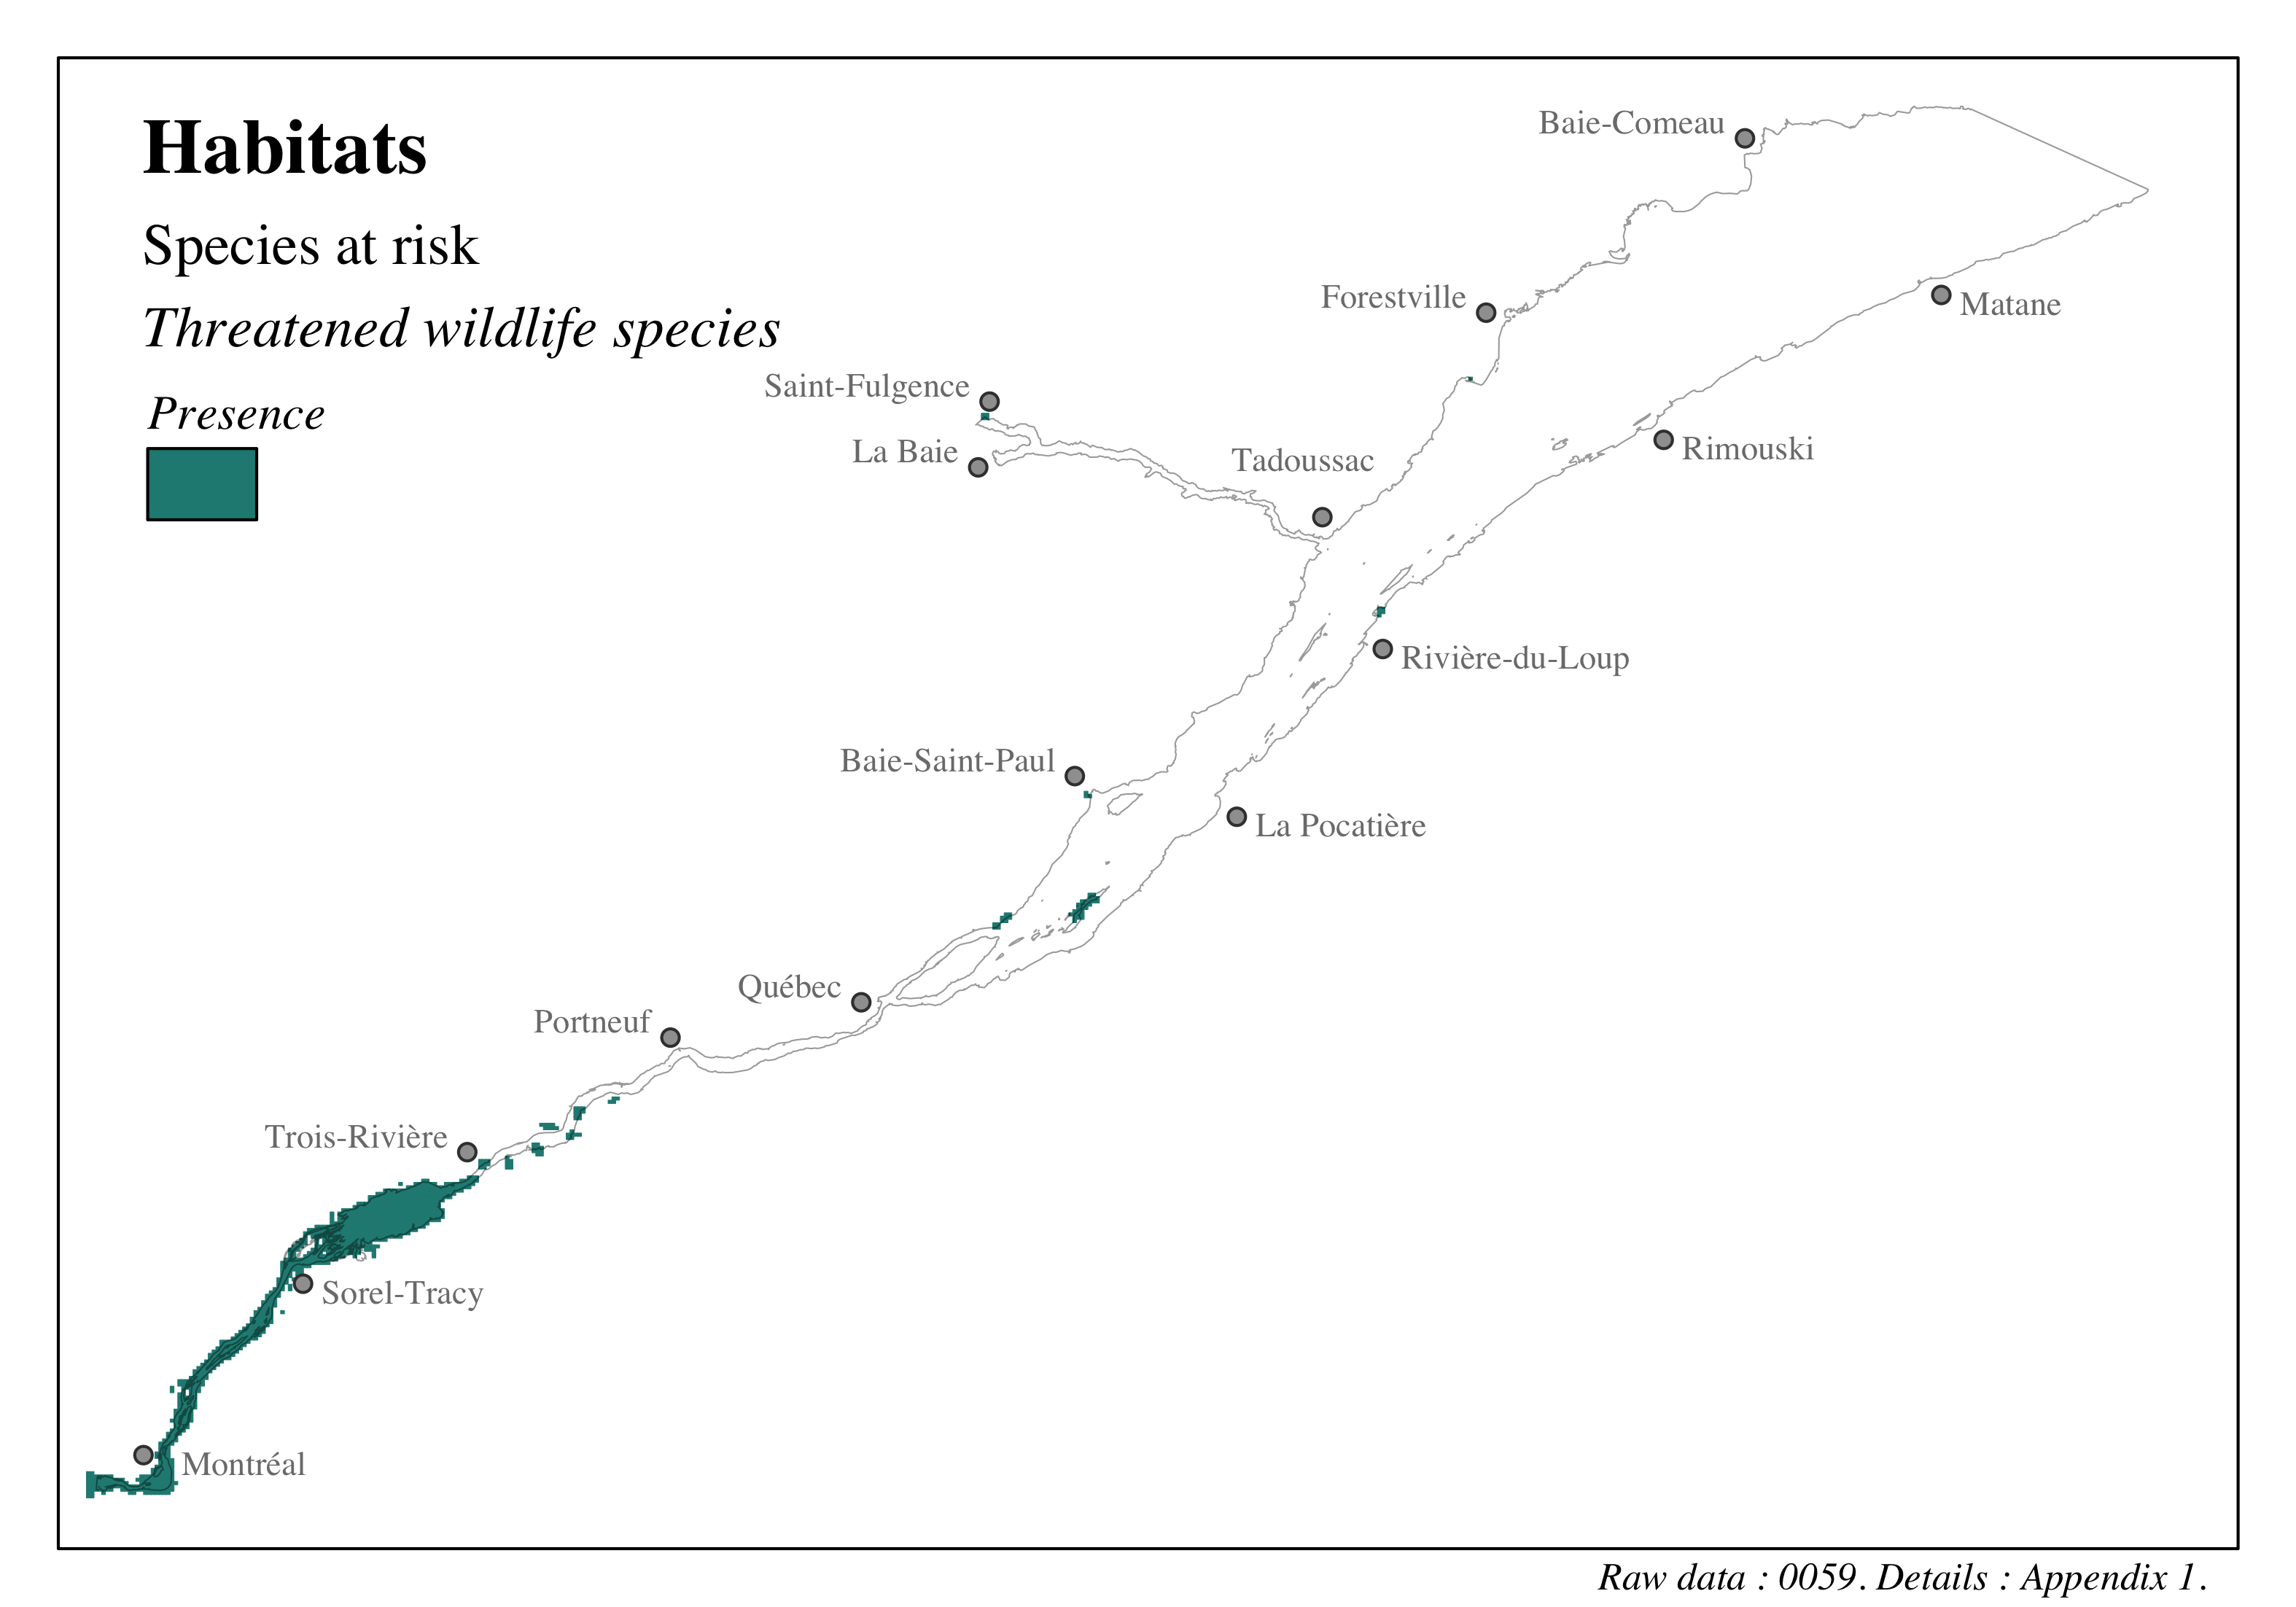
Figure 4.33: Distribution of habitats in the St. Lawrence and the Saguenay river - Threatened wildlife species
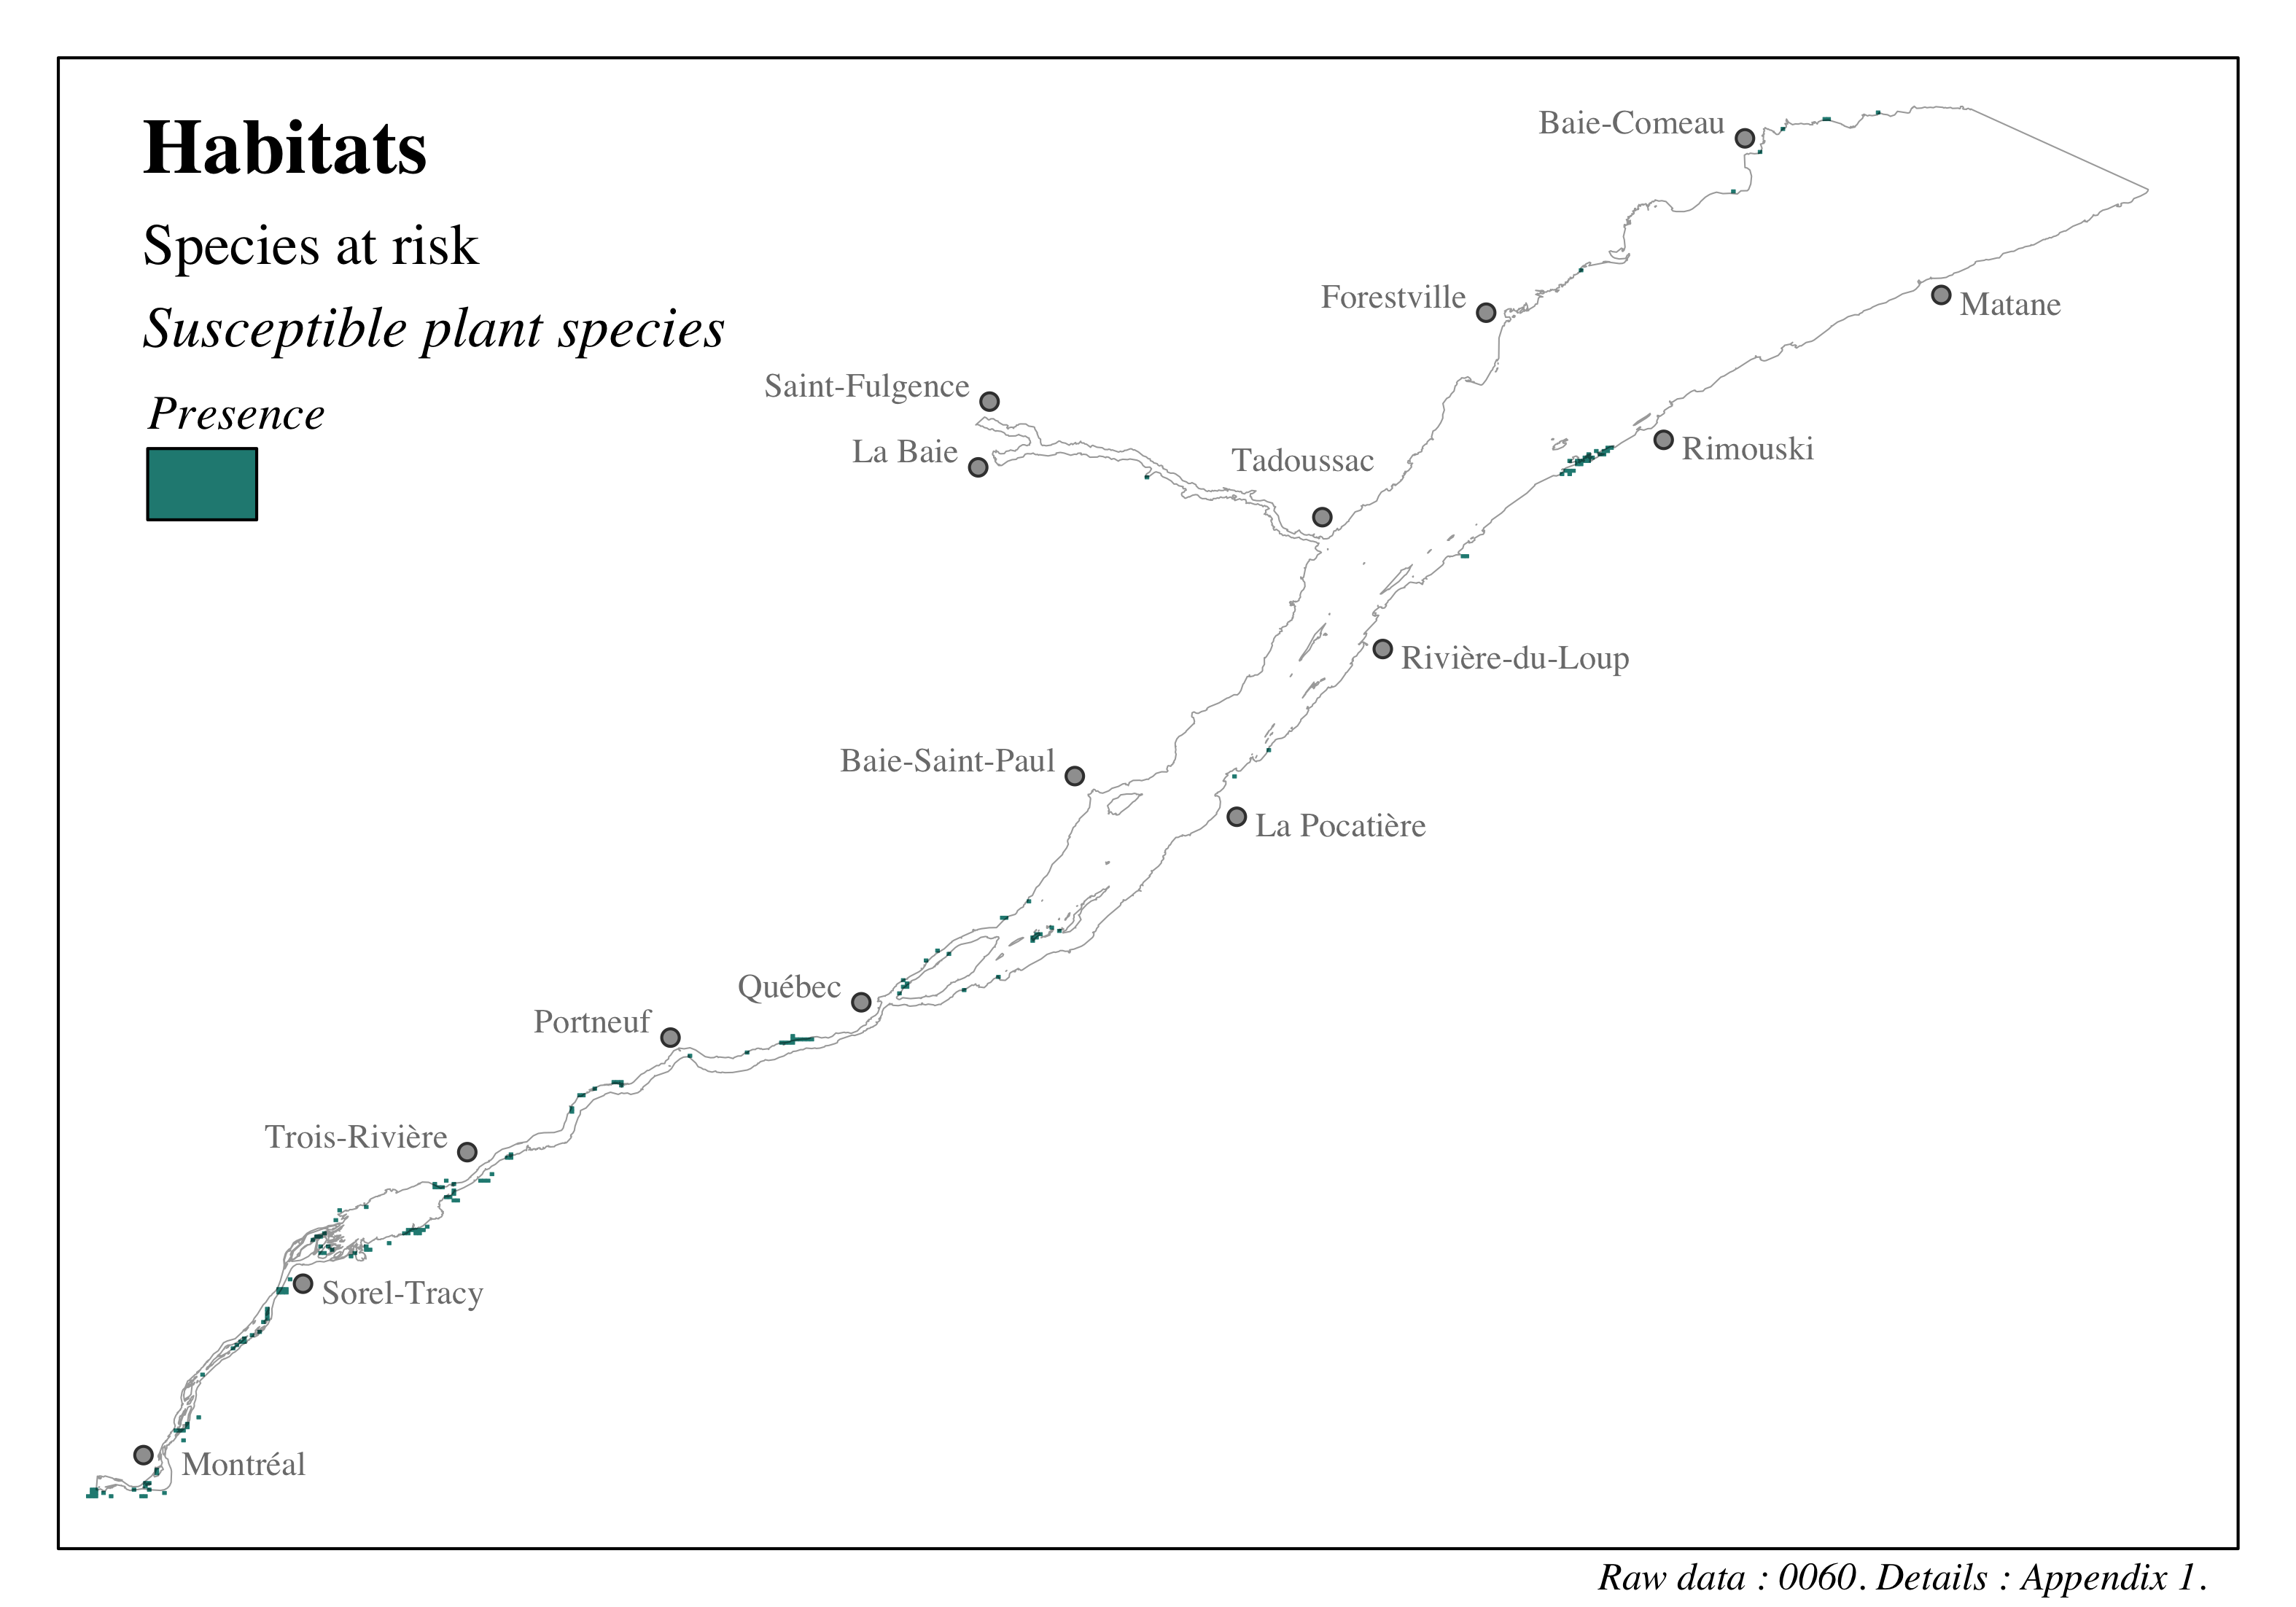
Figure 4.34: Distribution of habitats in the St. Lawrence and the Saguenay river - Susceptible plant species

Figure 4.35: Distribution of habitats in the St. Lawrence and the Saguenay river - Vulnerable plant species
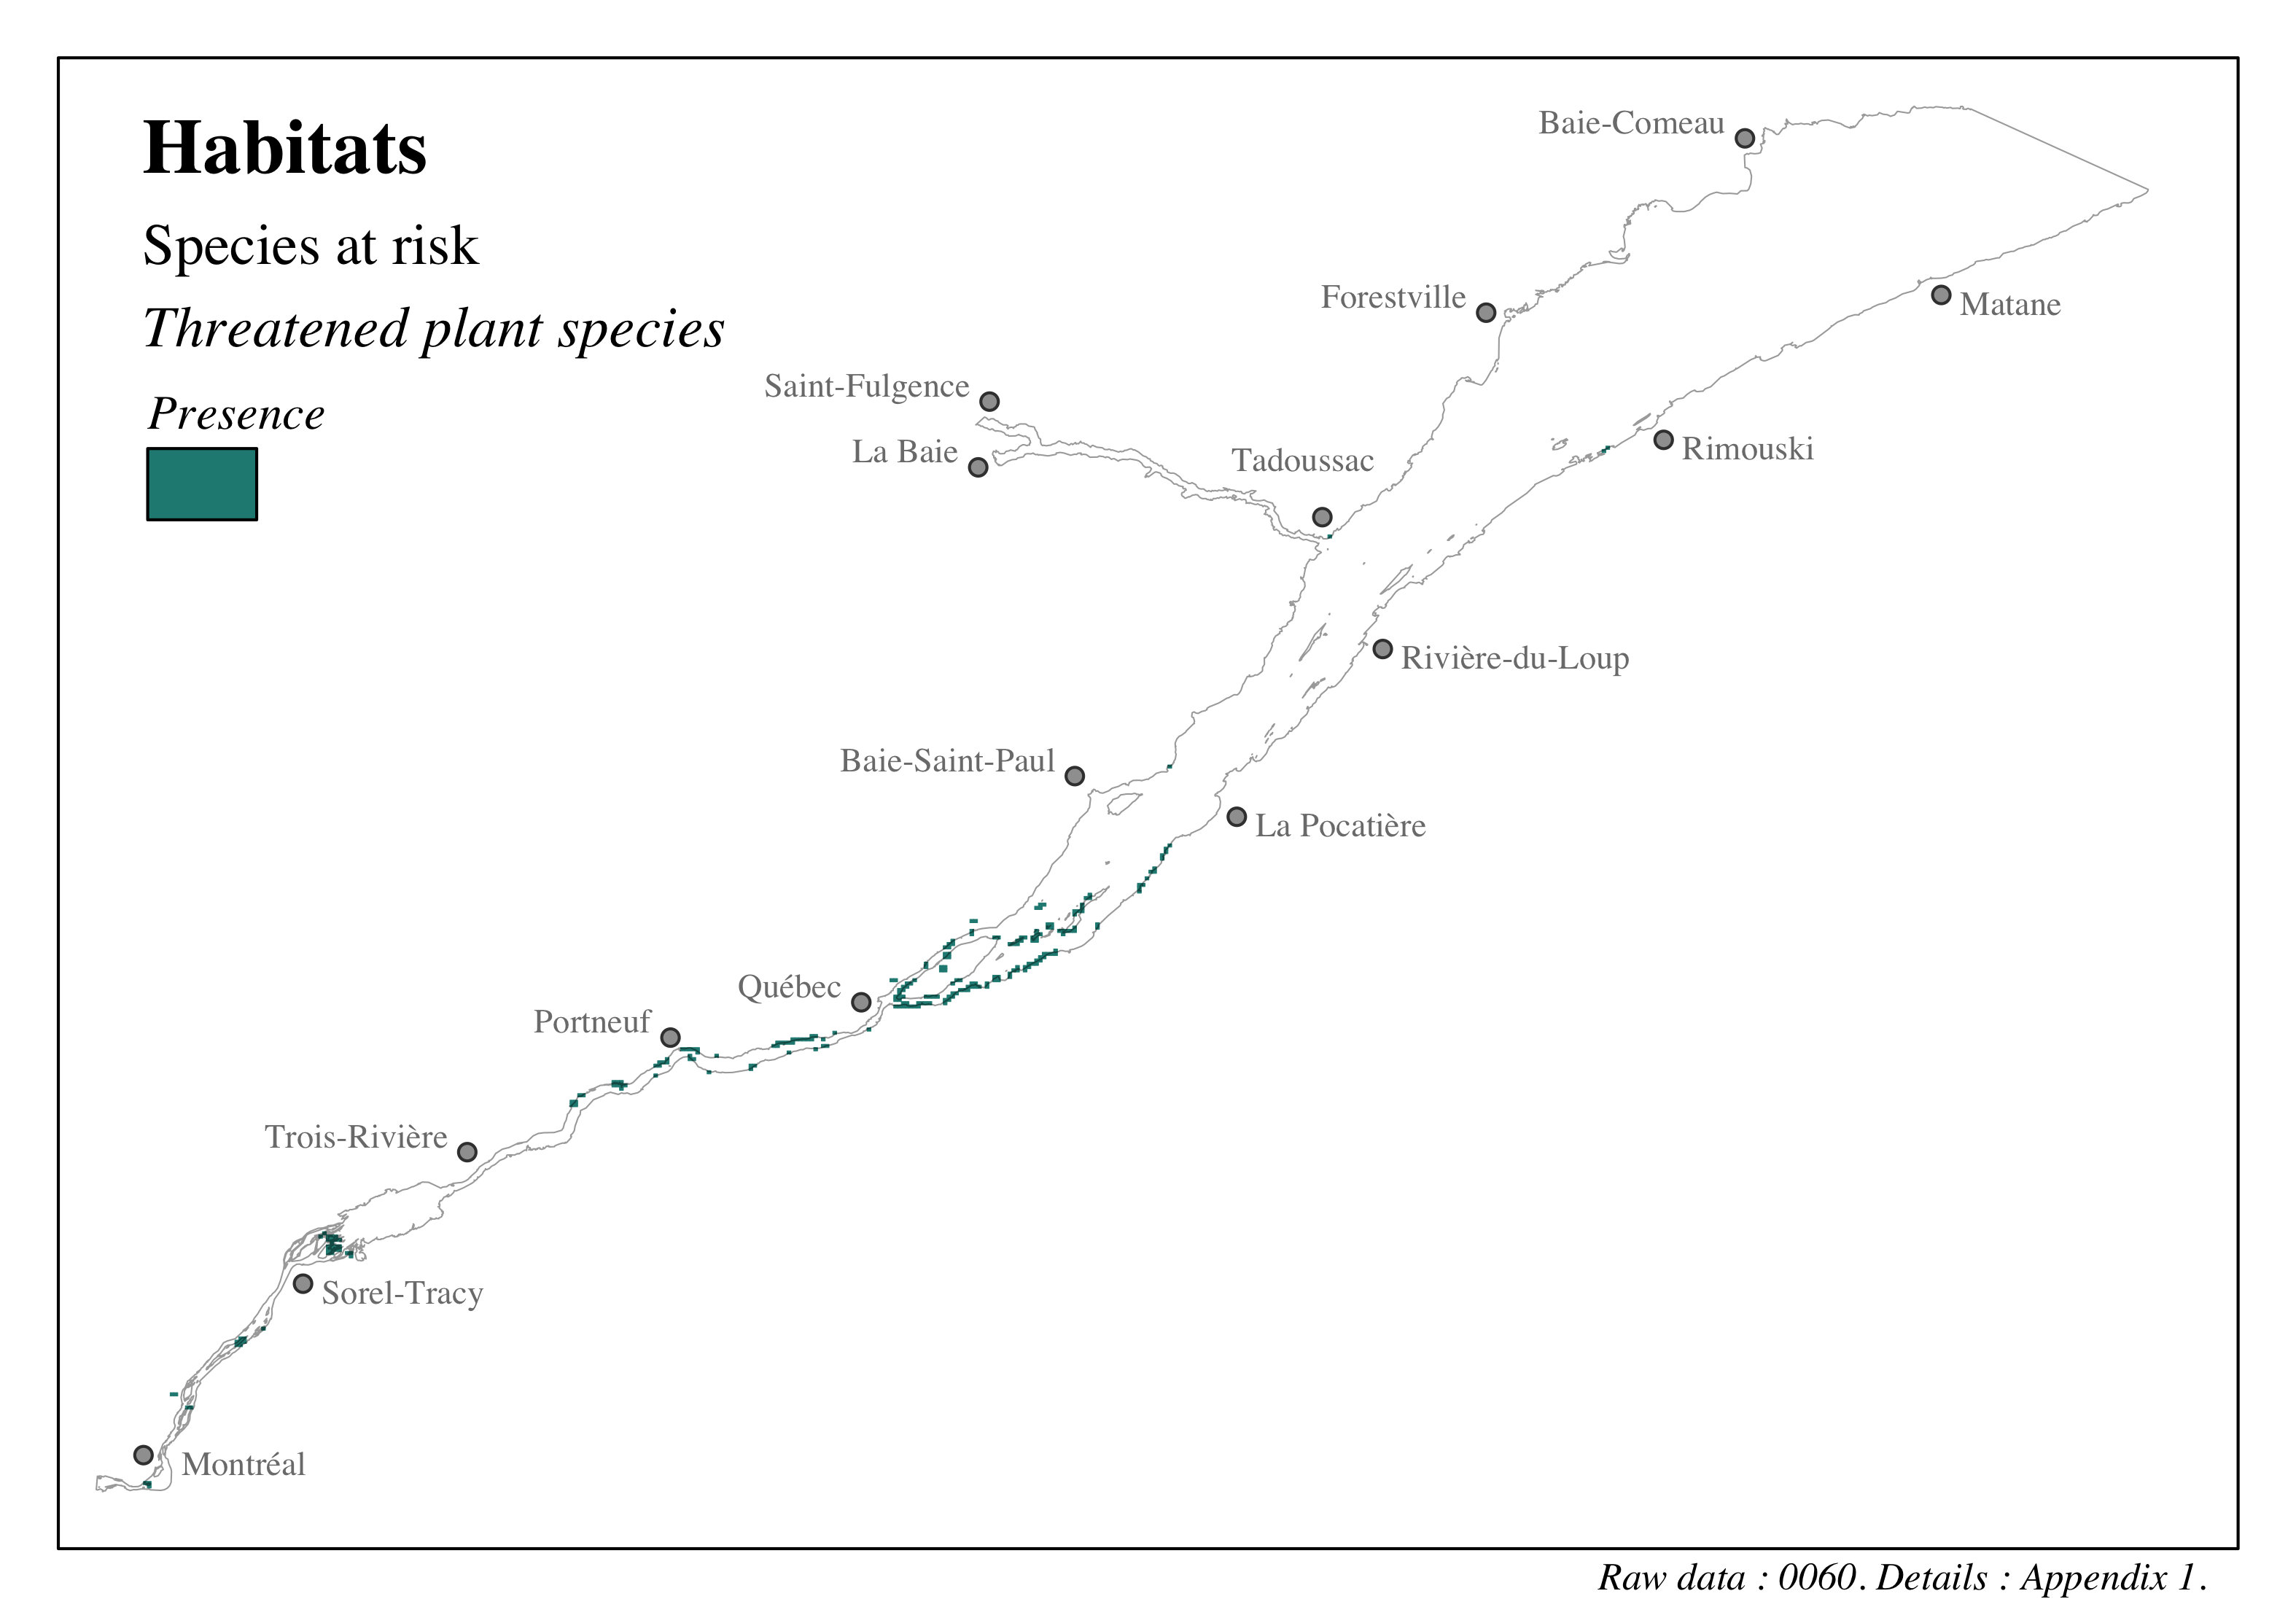
Figure 4.36: Distribution of habitats in the St. Lawrence and the Saguenay river - Threatened plant species
The CDPNQ data were completed with data on aquatic species at risk designated under the Species at Risk Act [SARA; Pêches et Océans Canada (2022e)]. Like the CDPNQ data, the SARA data identify sites here endangered species have been observed. In the study area, the SARA data contains 7 sites for 4 aquatic species (Table 4.16). We however removed data on the beluga whale, since that species is already considered through the marine mammals valued component.
| Status | Scientific name | Common name |
|---|---|---|
| Endangered | Moxostoma hubbsi | Copper redhorse |
| Endangered | Morone saxatilis | Striped bass |
| Threatened | Ammocrypta pellucida | Eastern sand darter |
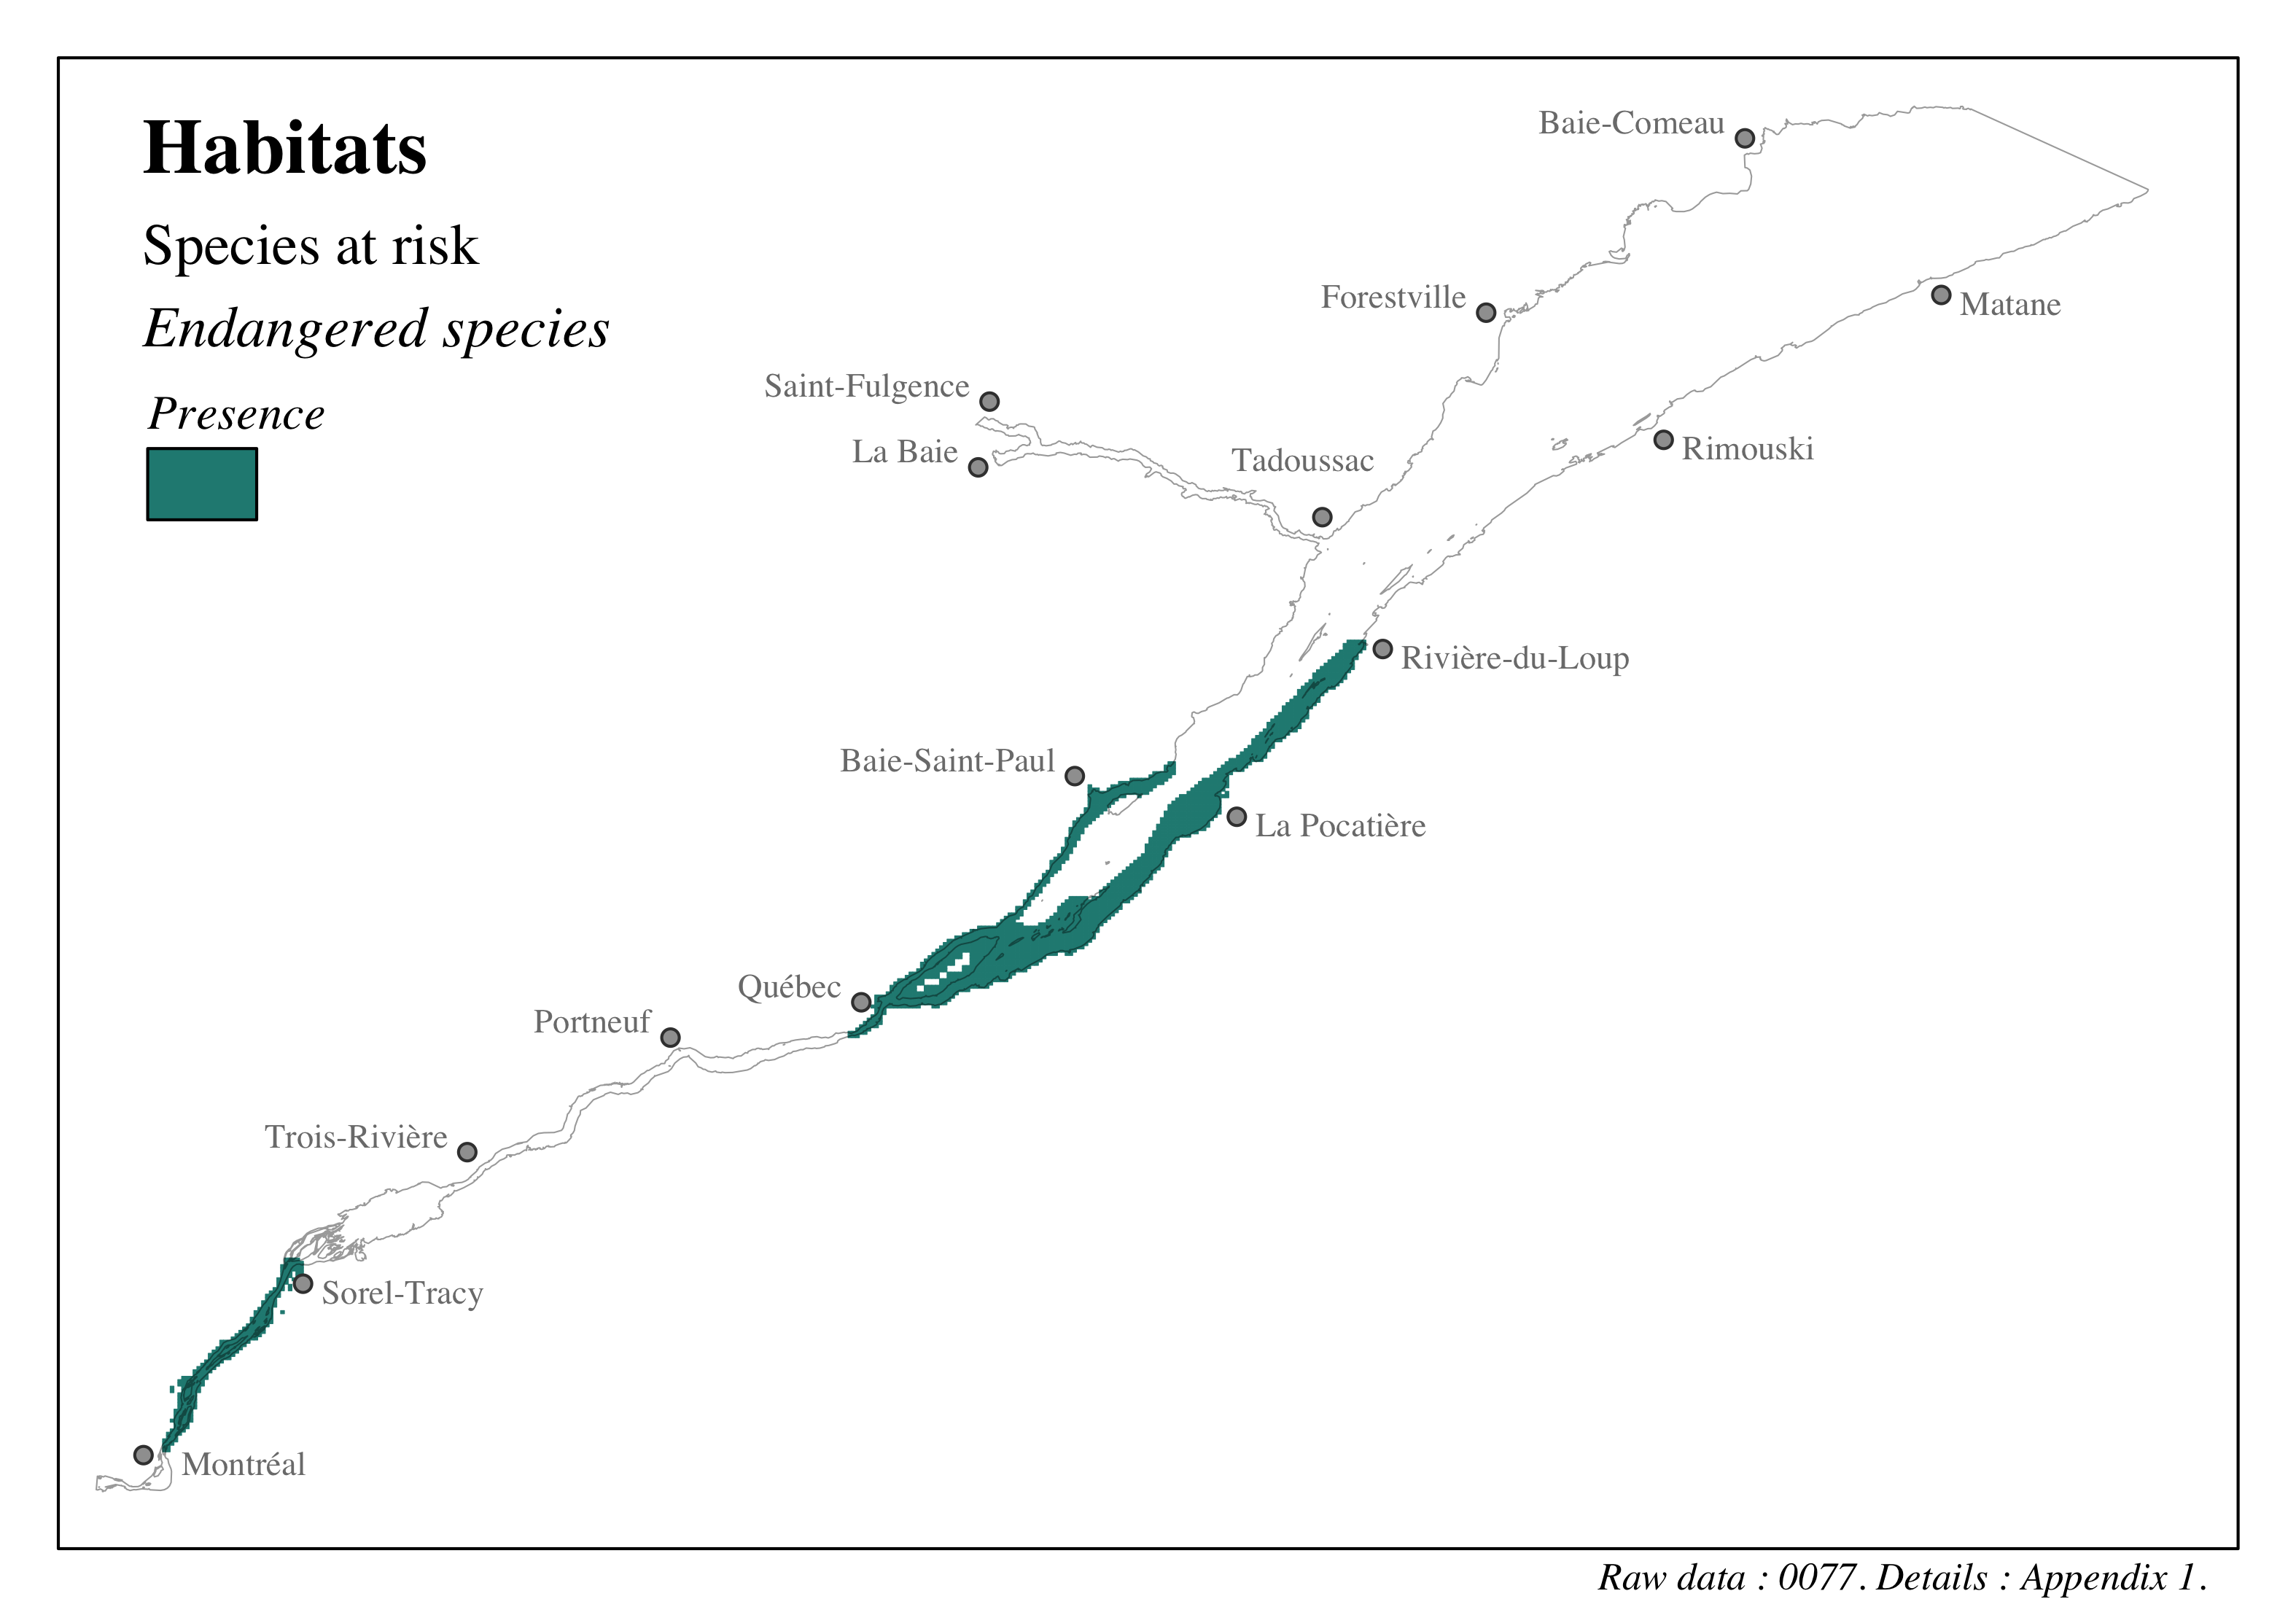
Figure 4.37: Distribution of habitats in the St. Lawrence and the Saguenay river - Endangered species
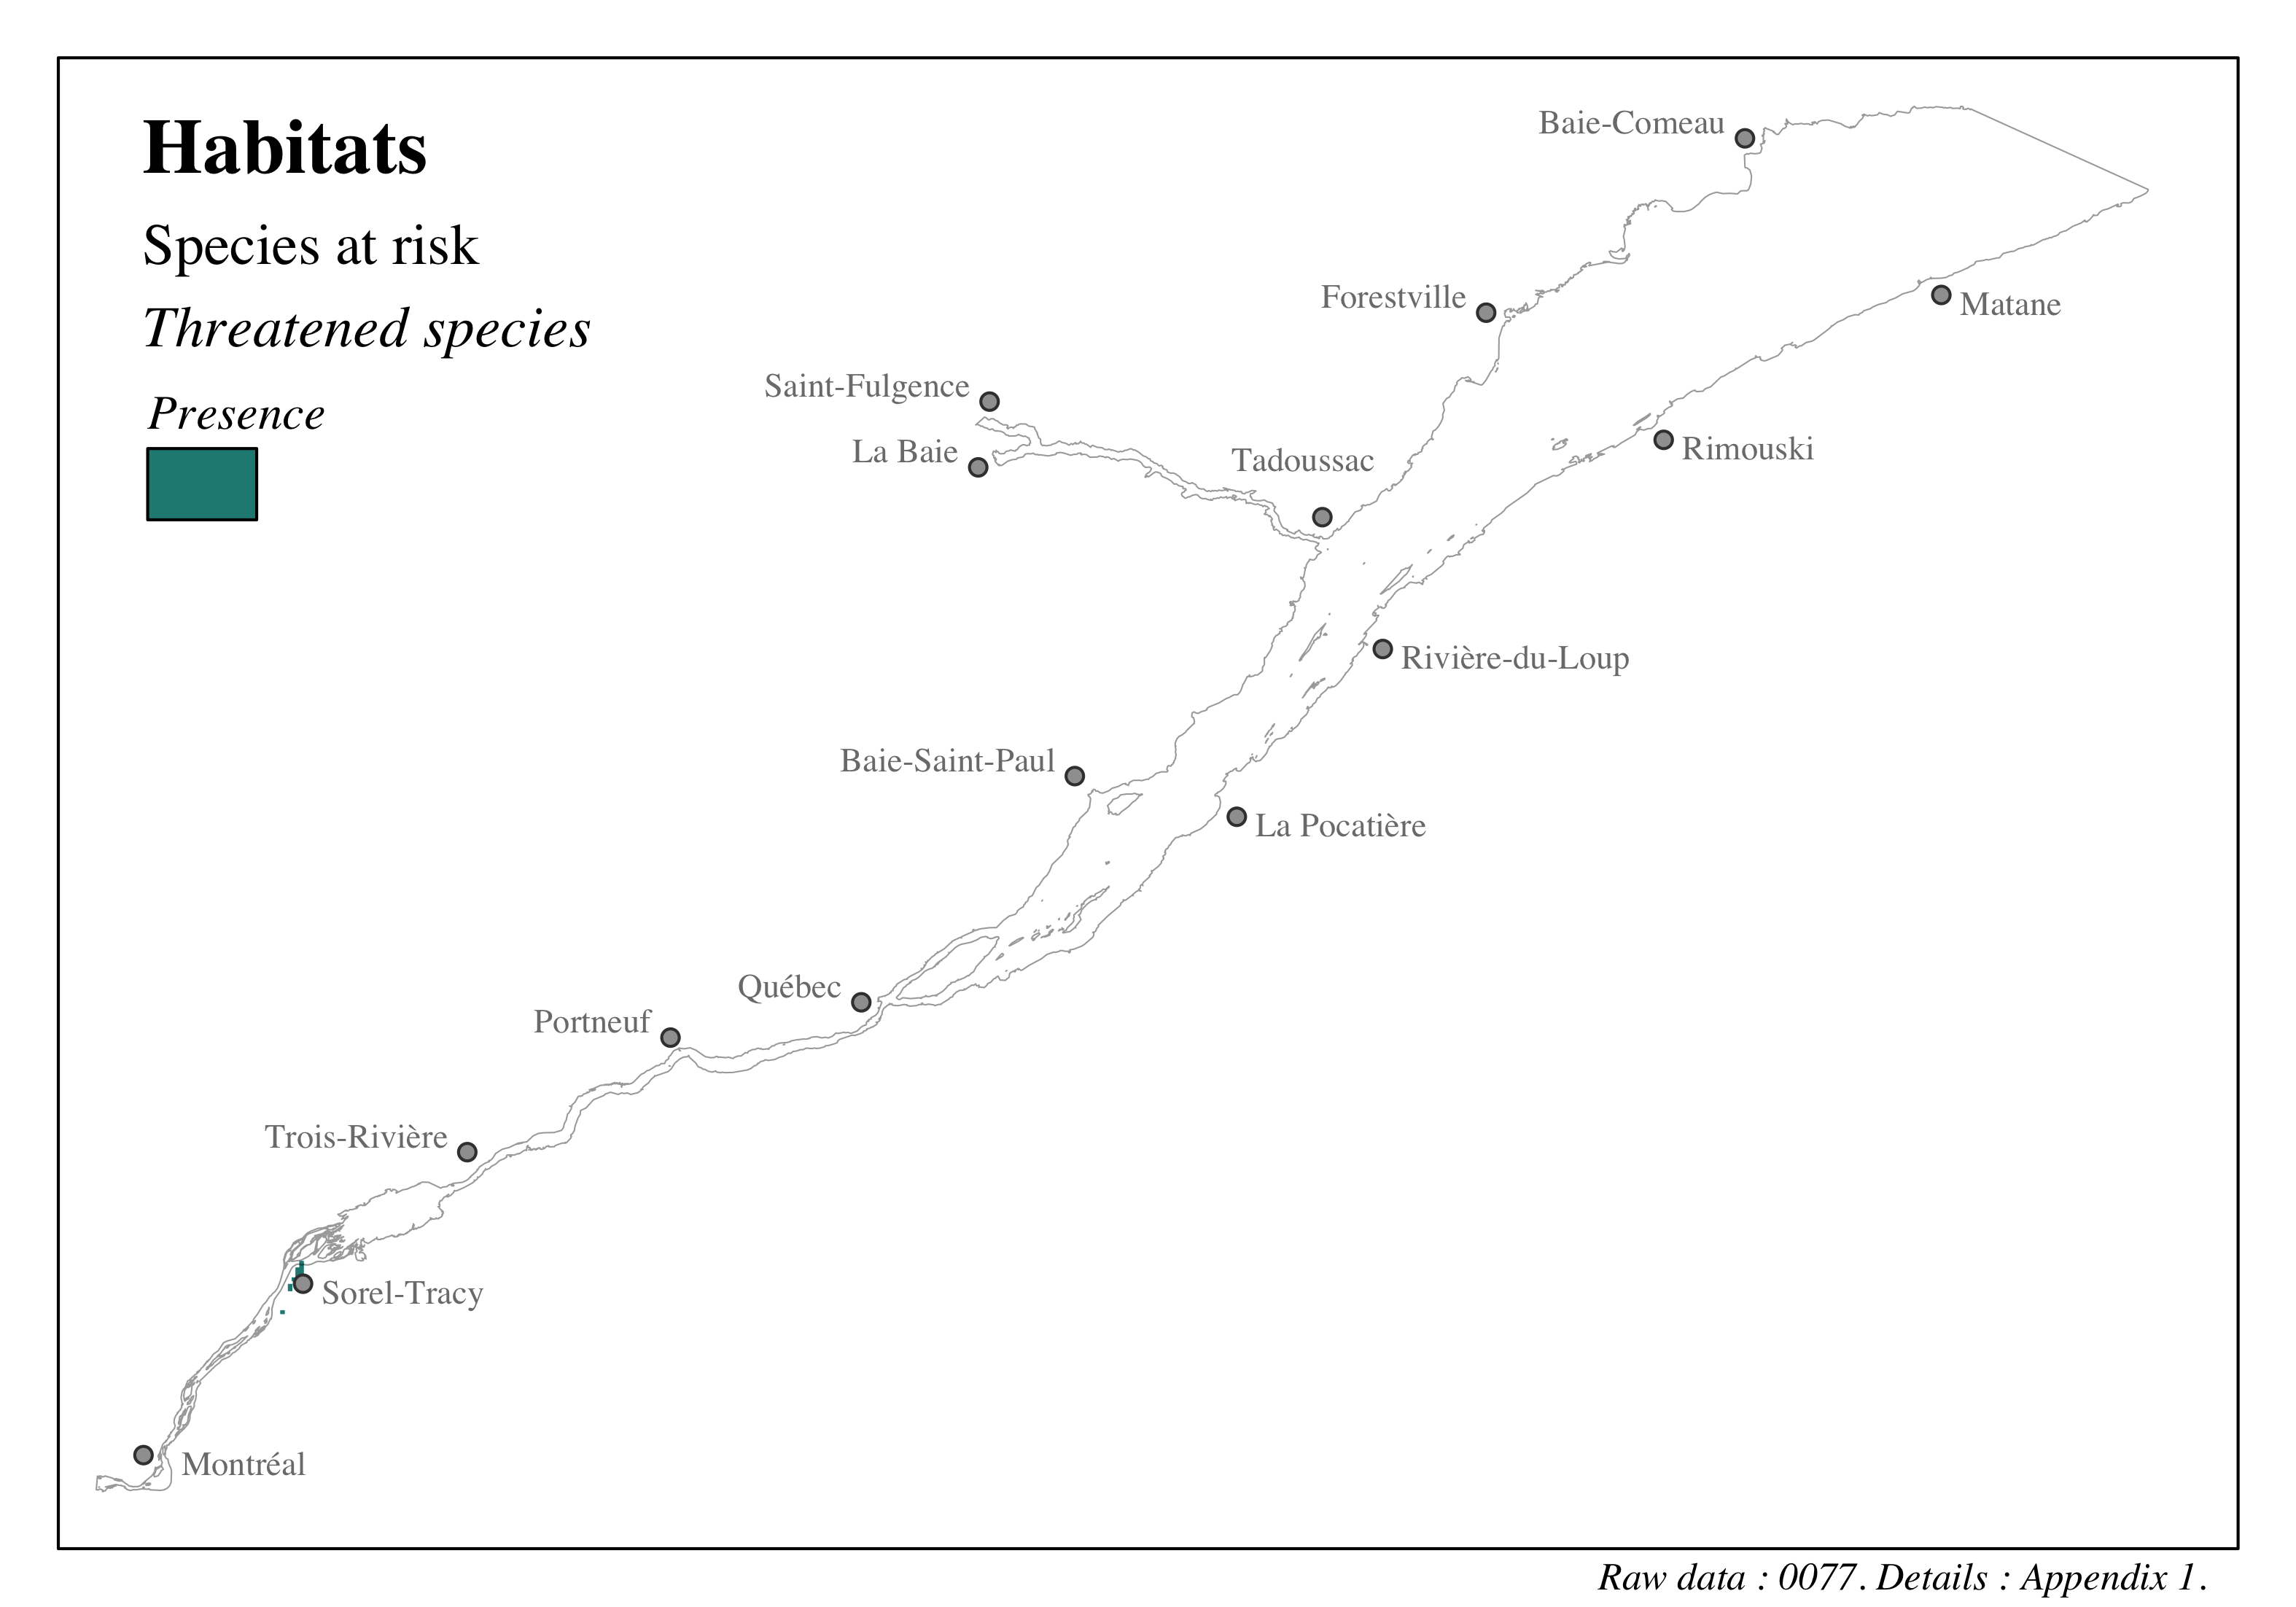
Figure 4.38: Distribution of habitats in the St. Lawrence and the Saguenay river - Threatened species
4.3.1.3 Natural environments
4.3.1.3.1 Eelgrass
The unique identifiers given to the data presented in this section are: 0001, 0002, 0003. Refer to the following section and to Appendix 1 for more details on these data.
Eelgrass (Zostera marina) forms complex, important habitats that can reduce currents, reduce predation and erosion, and contribute to primary production (Cimon et al., 2021; Hemminga and Duarte, 2000). The spatial distribution of eelgrass within the study area was described by integrating three different databases. The first database is the most complete and comes from a DFO literature review for James Bay, Baie des Chaleurs, and the Estuary and Gulf of St. Lawrence covering the period from 1987 to 2009 (Pêches et Océans Canada, 2009). This literature review brings together data on eelgrass distribution from 24 different resources; it includes 226 sites over an area of 28.58 \(km^2\) in the study area.
Two local databases providing additional information on eelgrass in the study area completed these data. The first is from an eelgrass restoration project in Anse de Pointe-au-Père in Rimouski that provides information on 7 sites covering an area of < 1 \(km^2\) (Bois et al., 2018); the second is from a similar exercise in Baie de Mitis and provides information on 3 sites covering an area of < 1 \(km^2\) (Bachand and Joubert, 2014; Comité ZIP du Sud-de-l’Estuaire, 2012). These three databases were integrated into the study grid on a presence-absence basis.
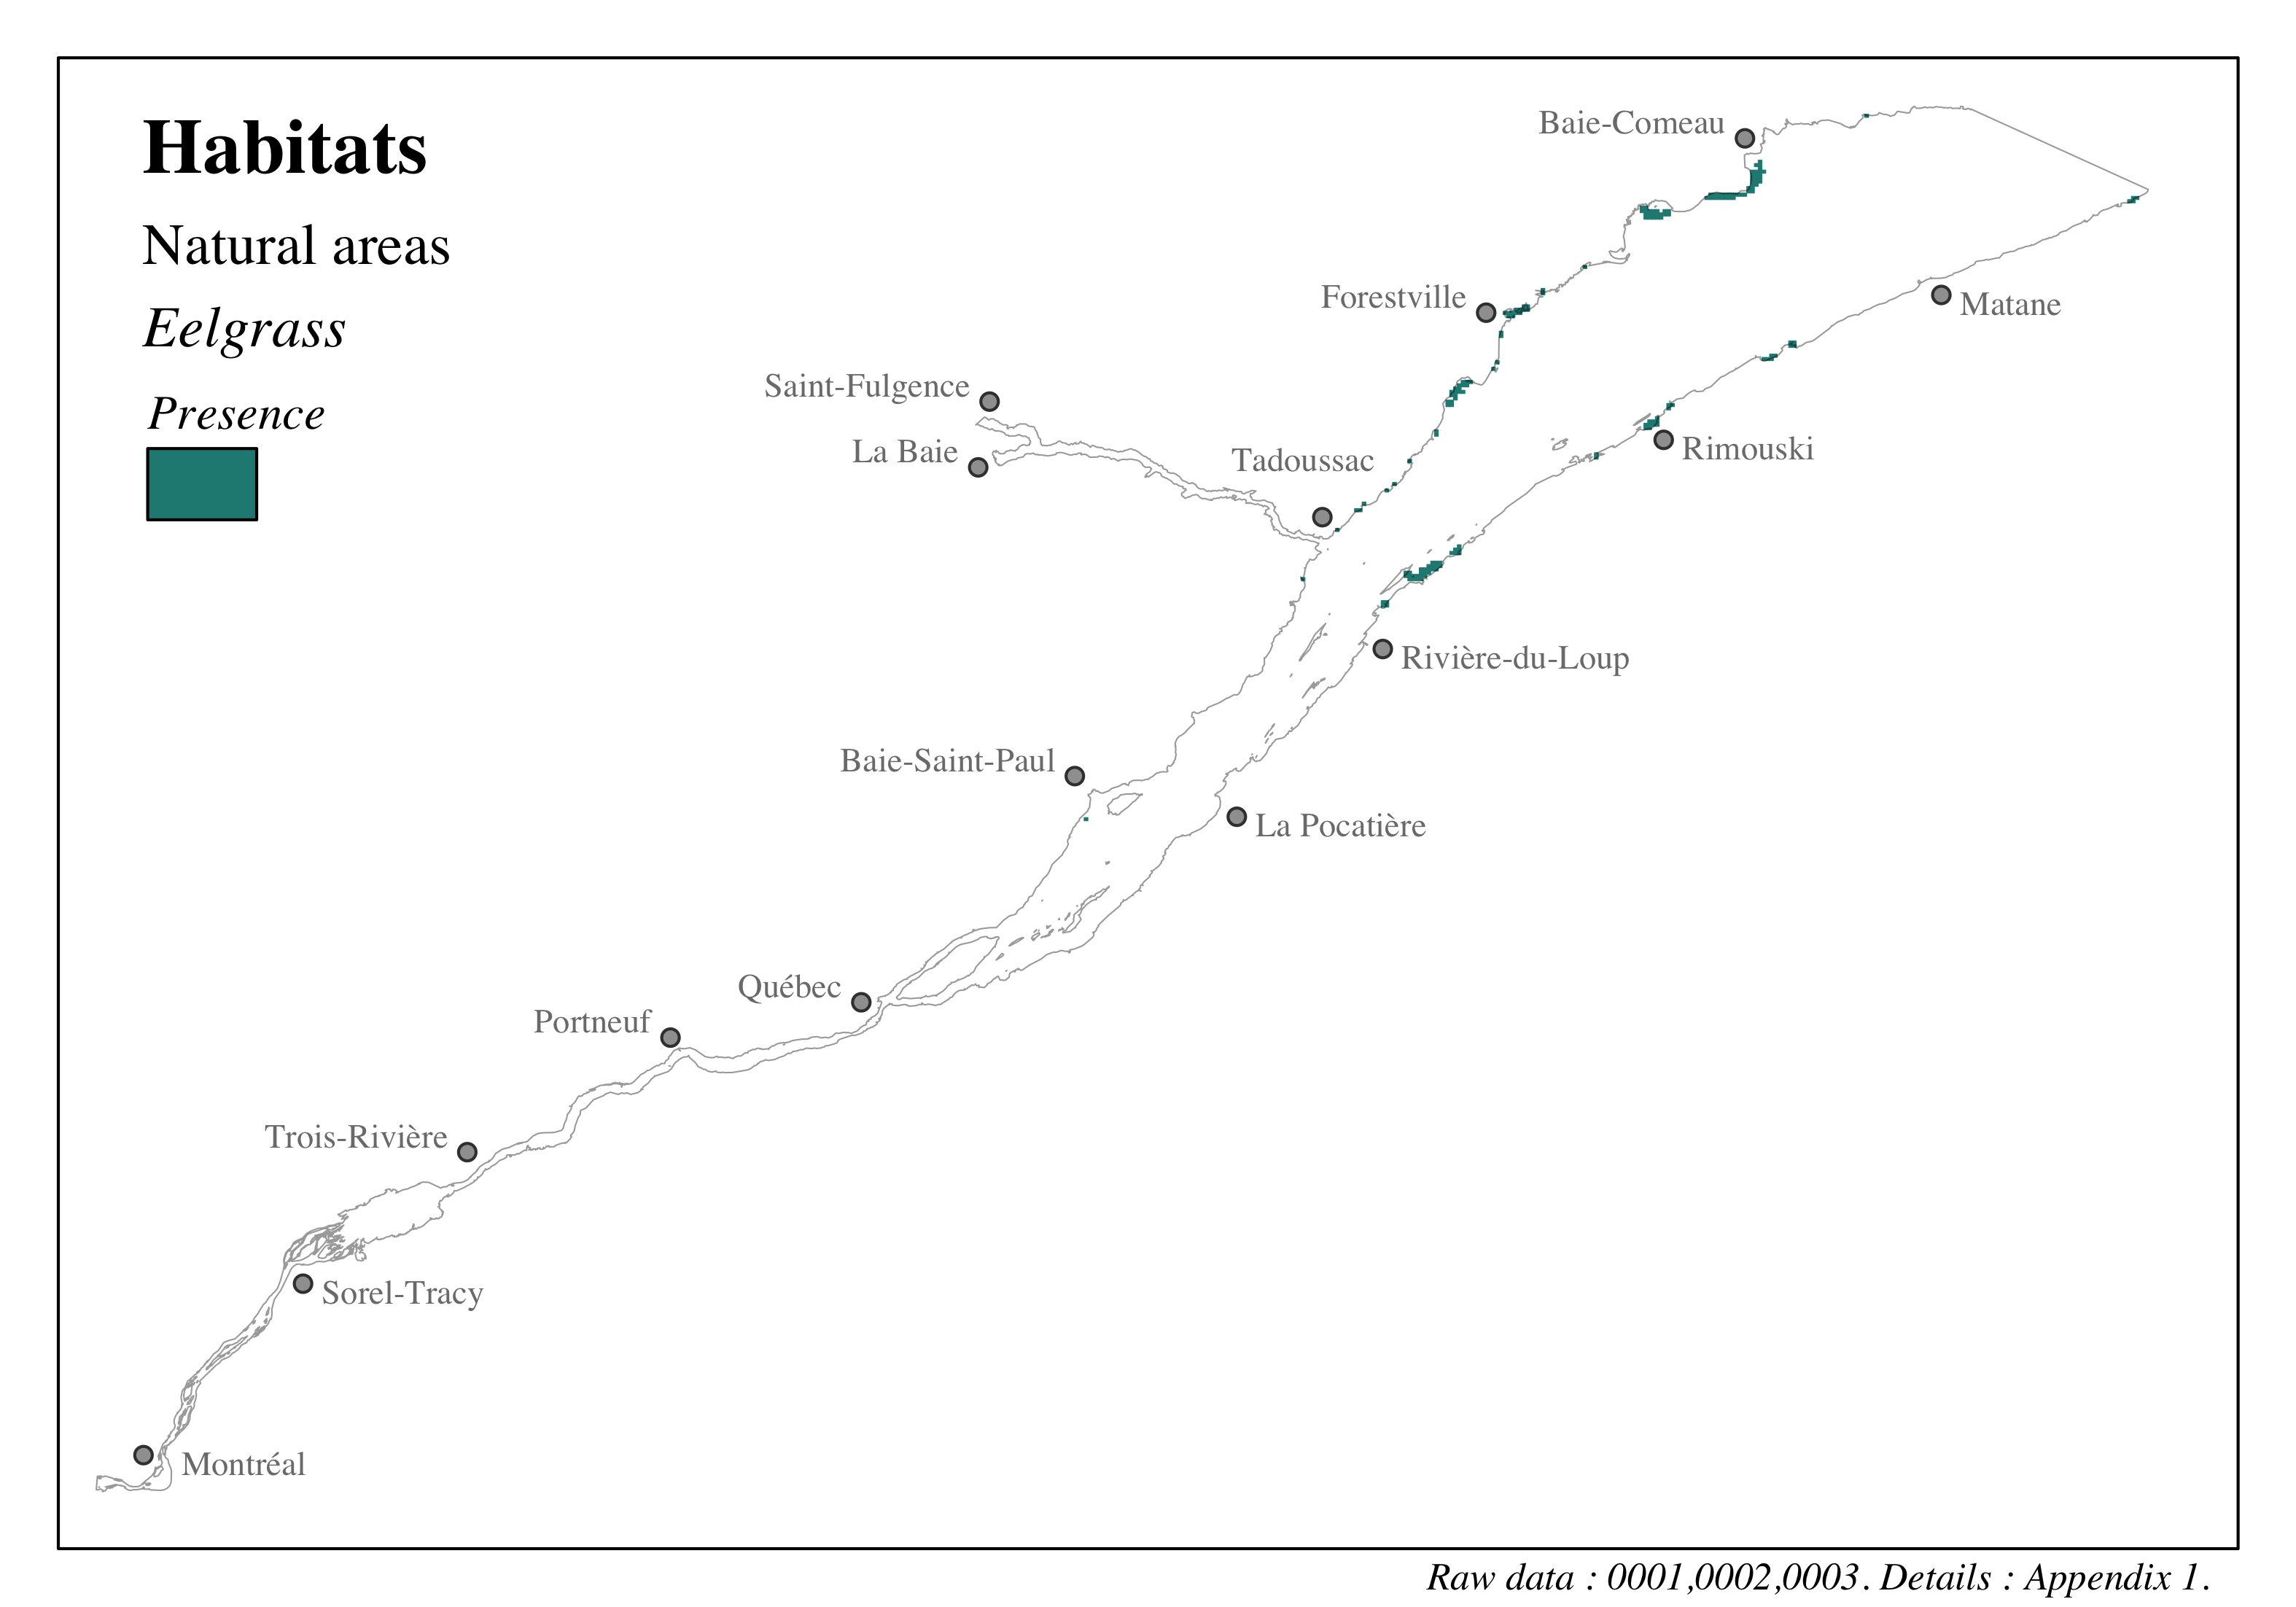
Figure 4.39: Distribution of habitats in the St. Lawrence and the Saguenay river - Eelgrass
4.3.1.3.2 Floodplains
The unique identifiers given to the data presented in this section are: 0013, 0014. Refer to the following section and to Appendix 1 for more details on these data.
The characterization of floodplains in the study area was done by combining data from the Flood Risk Areas Database [BDZI; Ministère de l’Environnement et de la Lutte contre les changements climatiques (2020)] and data on the presence of floodplains prepared by the regional county municipalities (Ministère des Affaires municipales et de l’Habitation, 2020). These databases provide the delineation of coastal areas at risk of flooding in Quebec according to a flood recurrence of 2 years, 20 years, or 100 yeras. We used all the zones identified to characterize floodplains in the study area.
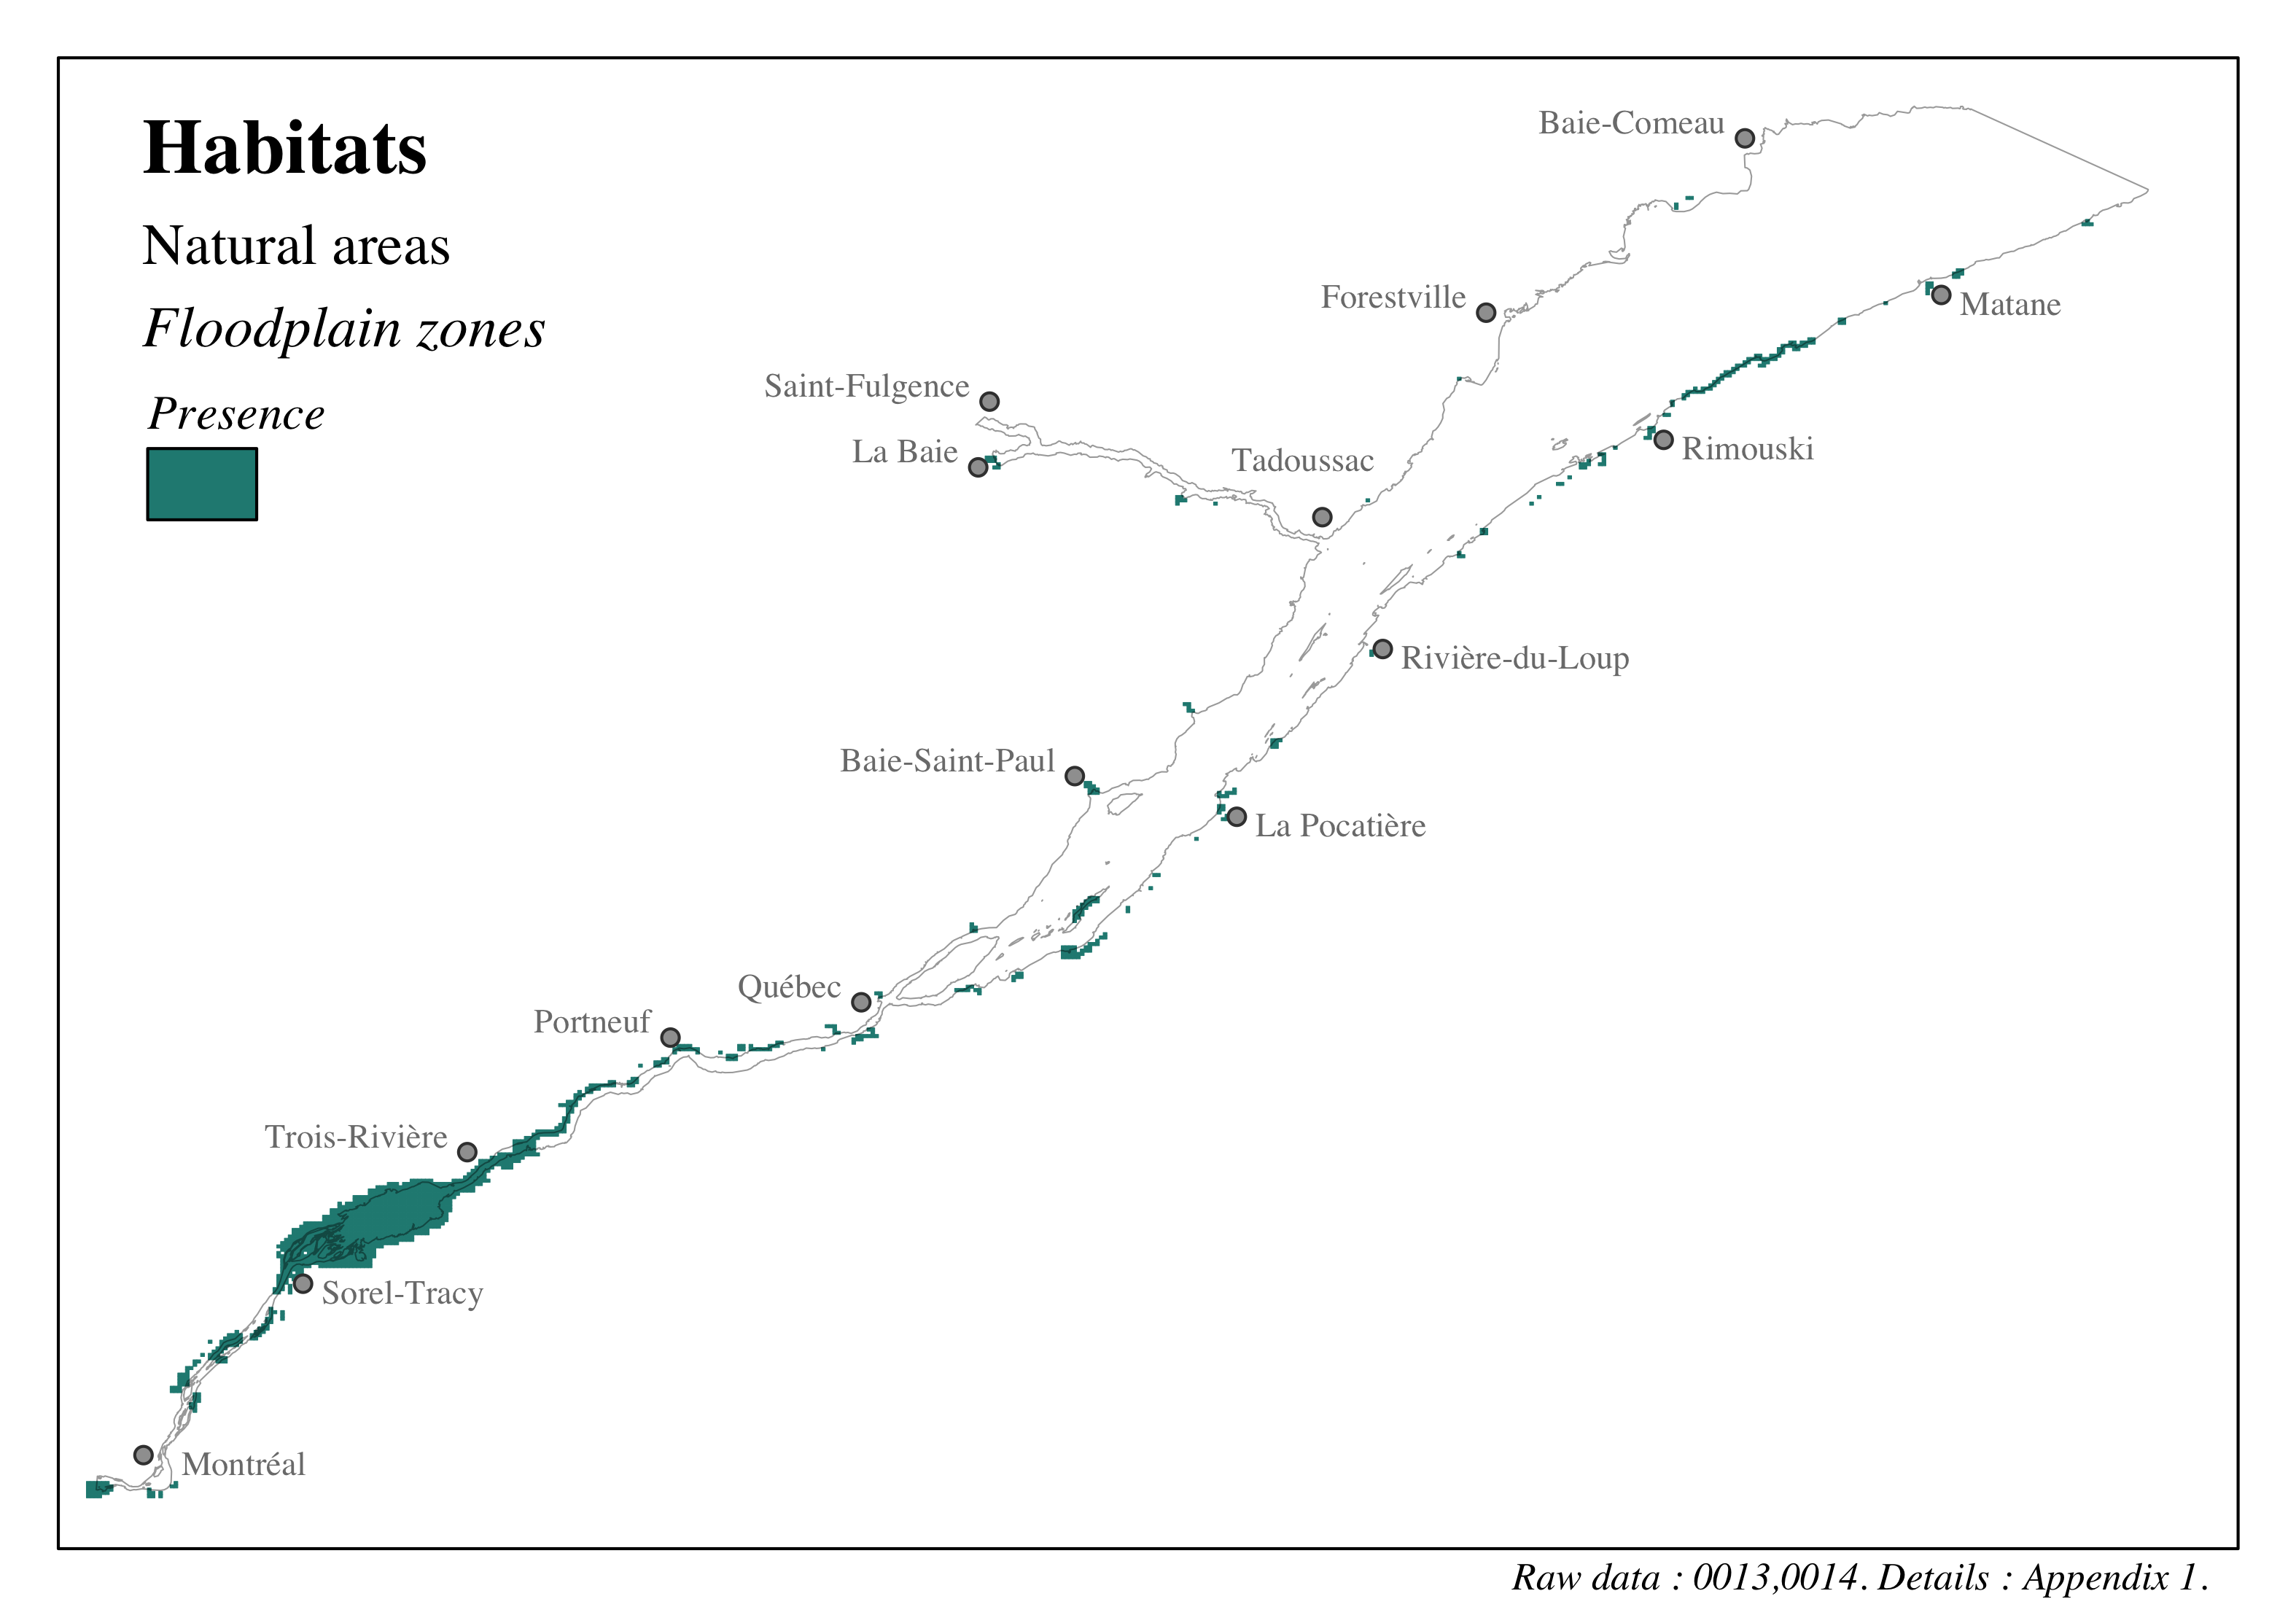
Figure 4.40: Distribution of habitats in the St. Lawrence and the Saguenay river - Floodplains
4.3.1.3.3 Coastal environments
The unique identifier given to the data presented in this section is: 0017. Refer to the following section and to Appendix 1 for more details on these data.
The characterization of coastal environments comes from the bank characterization exercise in the fluvial portion of the St. Lawrence River conducted by Patrick Lajeunesse’s team at Université Laval. This exercise was used to characterize the bank integrity valued component (Bernier et al., 2020; Bernier et al., 2021); this characterization is therefore available solely for the fluvial portion of the St. Lawrence. This database provides a characterization of the types of coasts we use as habitats in our assessment. A total of 5 coastal environments were considered for the assessment (Table 4.13):
- Soft without cliff
- Rocky without bluff
- Rocky without cliff
- Beach terrace
- Fluvial terrace
These environments were mapped using high-resolution mapping approaches combining the data from land surveys, remote sensing, and local community knowledge (Bernier et al., 2020; Bernier et al., 2021).

Figure 4.41: Distribution of habitats in the St. Lawrence and the Saguenay river - Soft without cliff
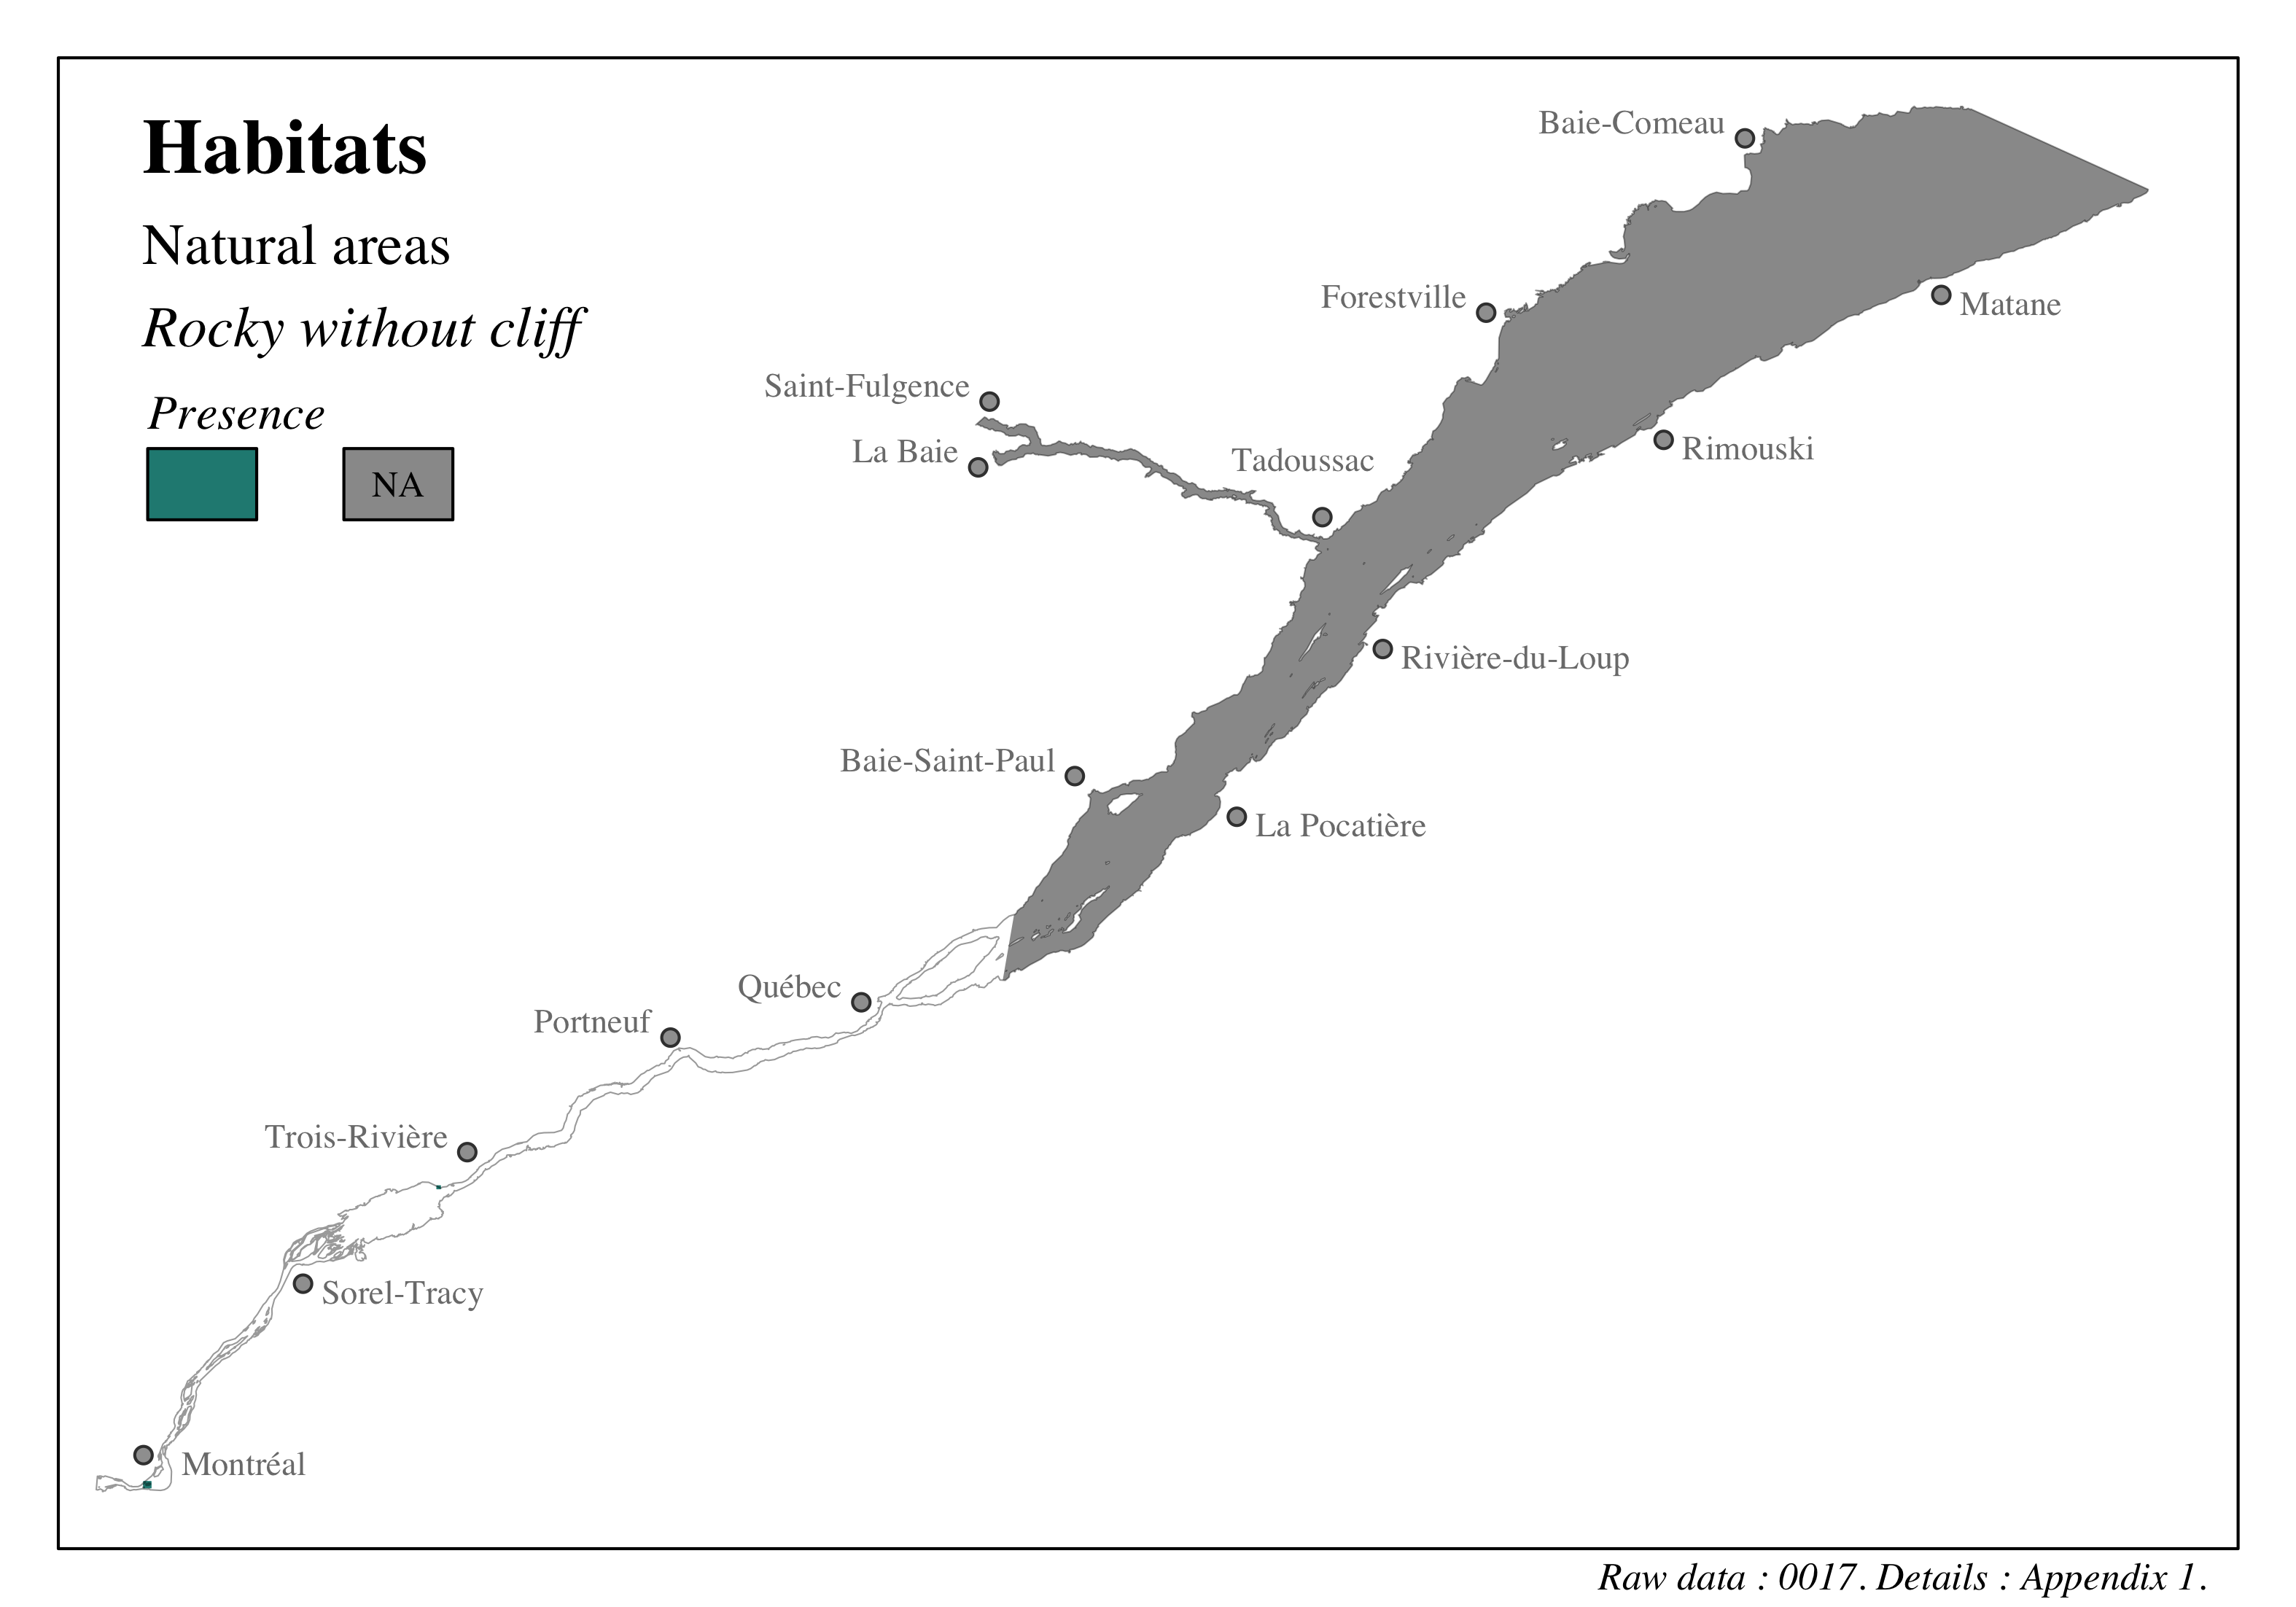
Figure 4.42: Distribution of habitats in the St. Lawrence and the Saguenay river - Rocky without bluff

Figure 4.43: Distribution of habitats in the St. Lawrence and the Saguenay river - Rocky without cliff

Figure 4.44: Distribution of habitats in the St. Lawrence and the Saguenay river - Beach terrace

Figure 4.45: Distribution of habitats in the St. Lawrence and the Saguenay river - Fluvial terrace
4.3.1.3.4 Wetlands
The unique identifier given to the data presented in this section is: 0053. Refer to the following section and to Appendix 1 for more details on these data.
Wetlands are a link between aquatic and land environments, are home to an abundance of wildlife and plants, provide critical habitat during the life cycle of multiple species, and are critical habitats for many species at risk. Wetlands provide essential ecosystem services such as protecting shorelines from erosion, improving water quality, and storing carbon; they are also widely used for cultural and recreational activities such as hunting and tourism (Clarkson et al., 2013). Wetlands encompass a significant diversity of habitat types, ranging from shallow water to swamp, with an increasing proportion of shrubs.
The wetlands were characterized using a mapping of potential wetlands in Quebec (Ministère de l’Environnement et de la Lutte contre les changements climatiques, 2019b, 2019a). This database provides a mapping of wetlands for all of Quebec, classified in broad types: shallow water, marsh, swamp and peatbog (Table 4.13). A general category for uncategorized wetlands is also available. Wetlands occupy a total area of 516.34 \(km^2\) within the study area (Table 4.13).
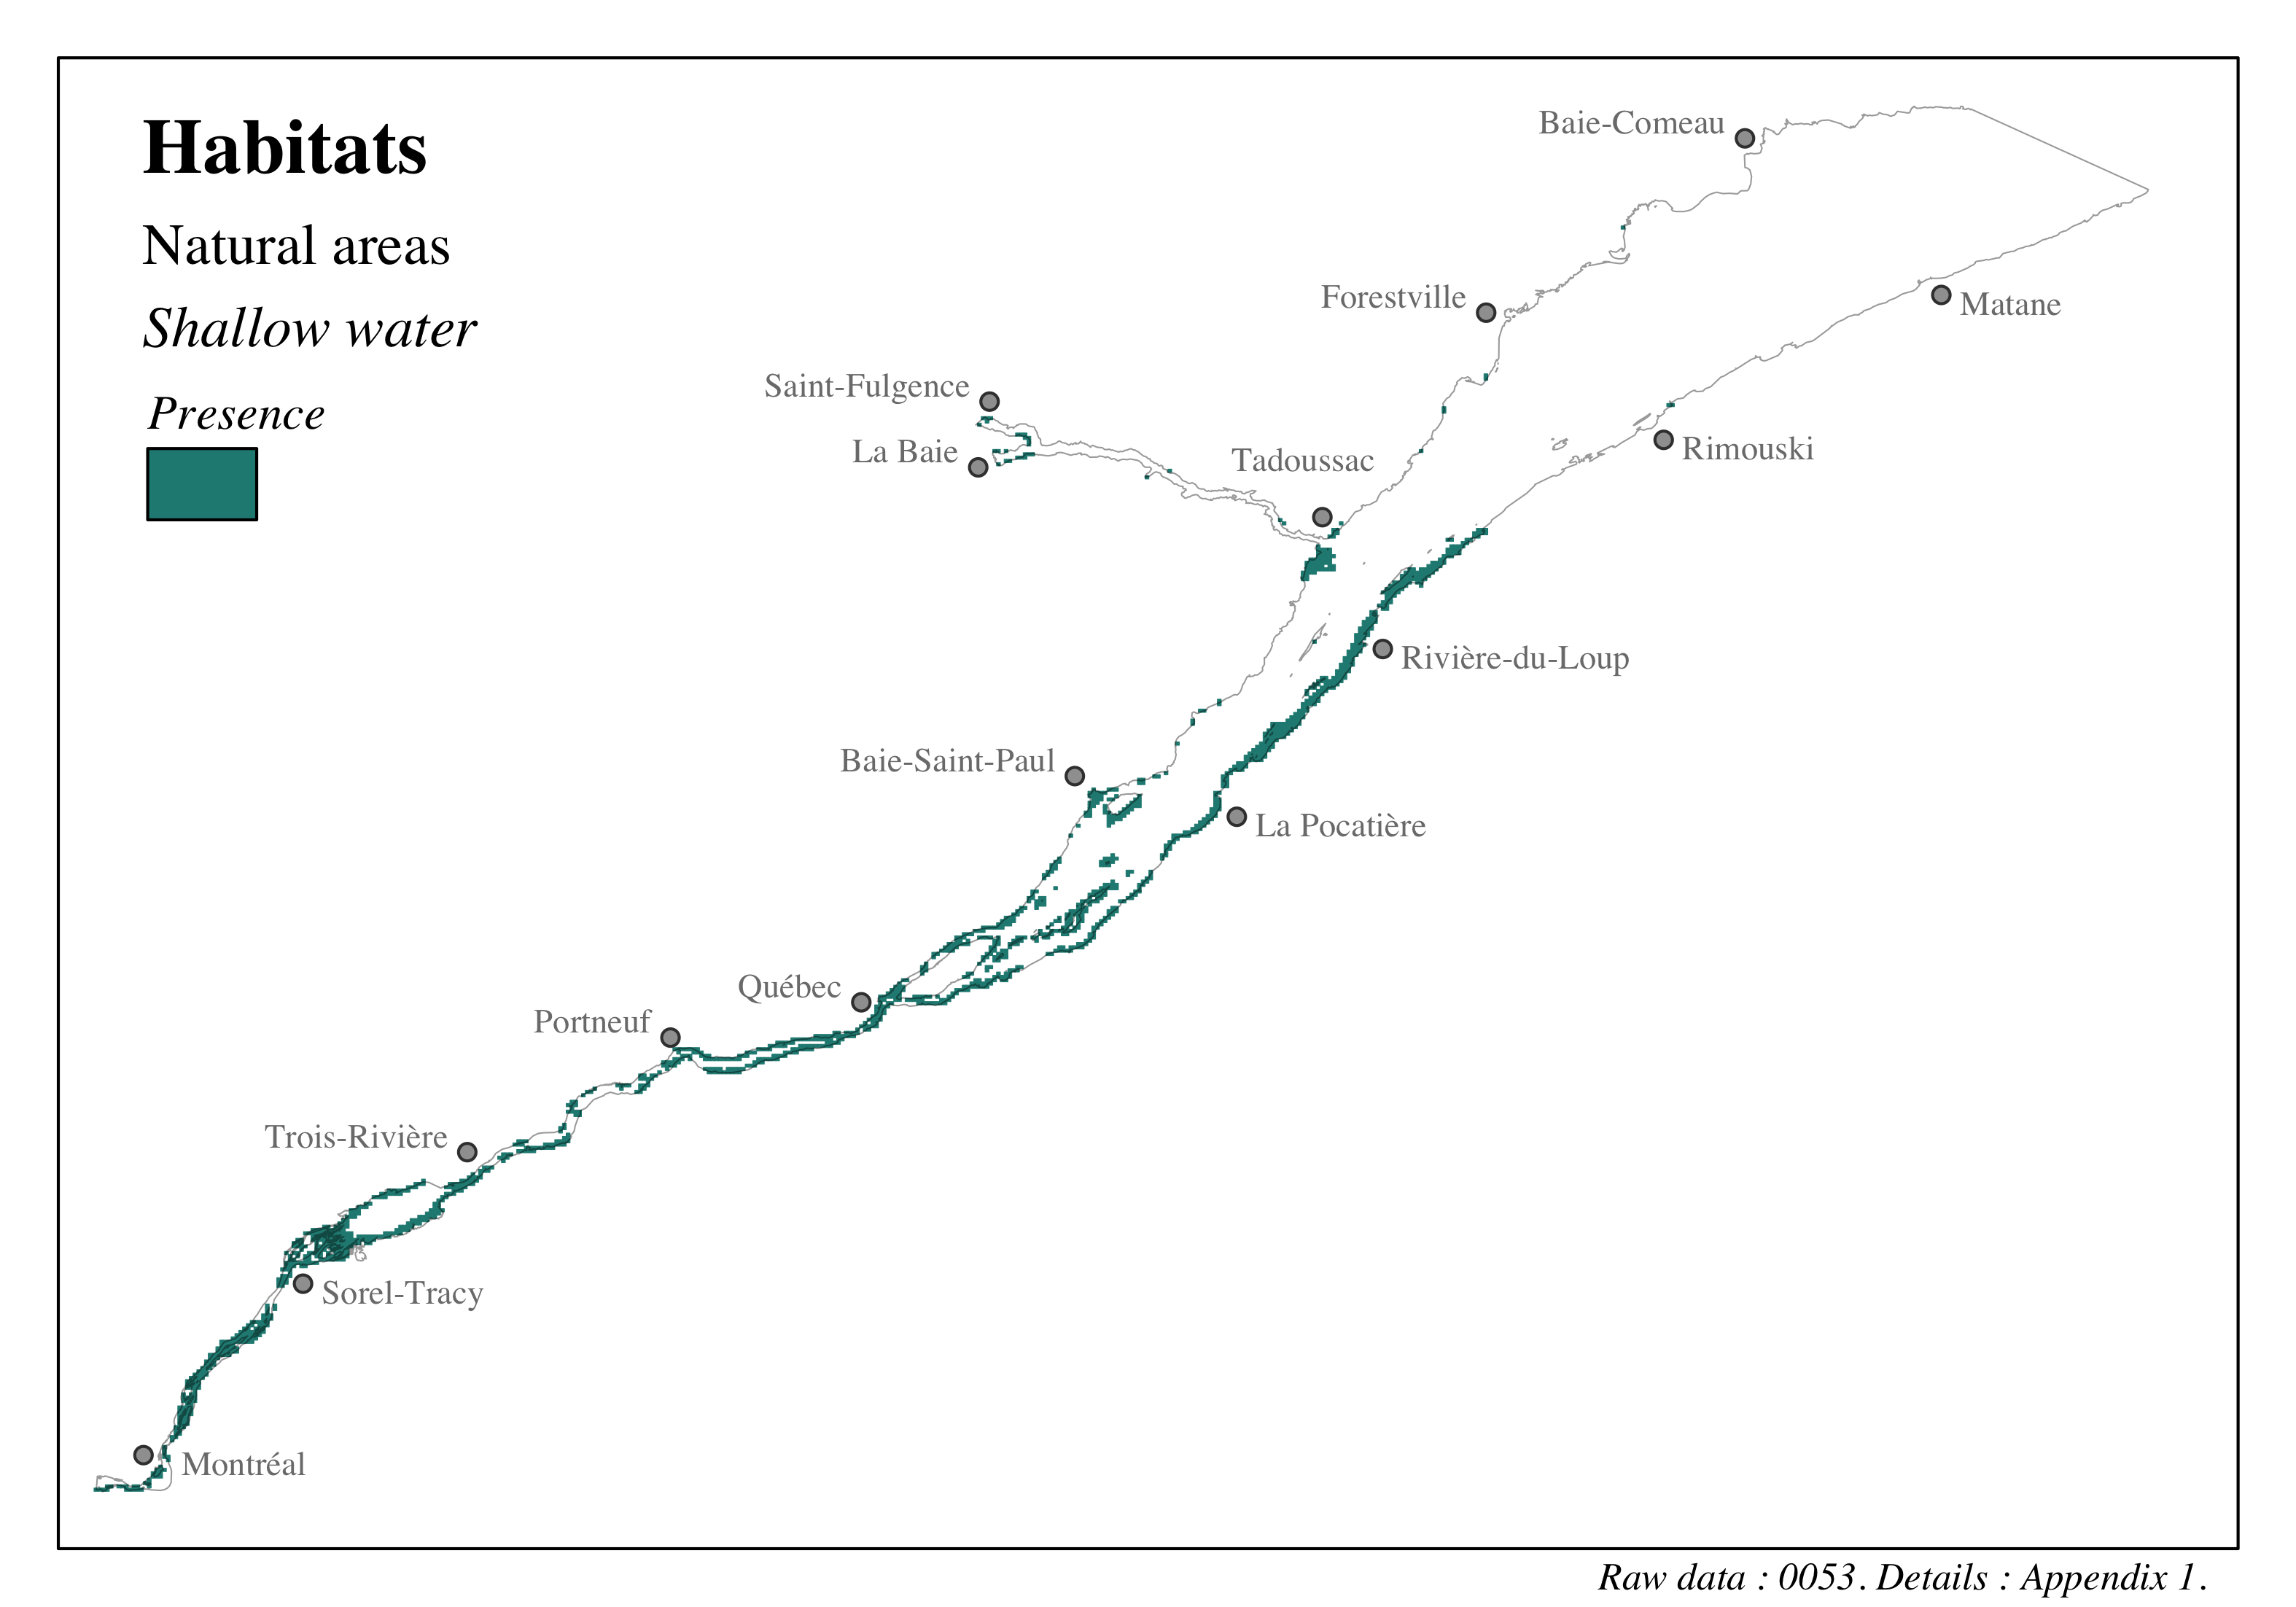
Figure 4.46: Distribution of habitats in the St. Lawrence and the Saguenay river - Shallow water
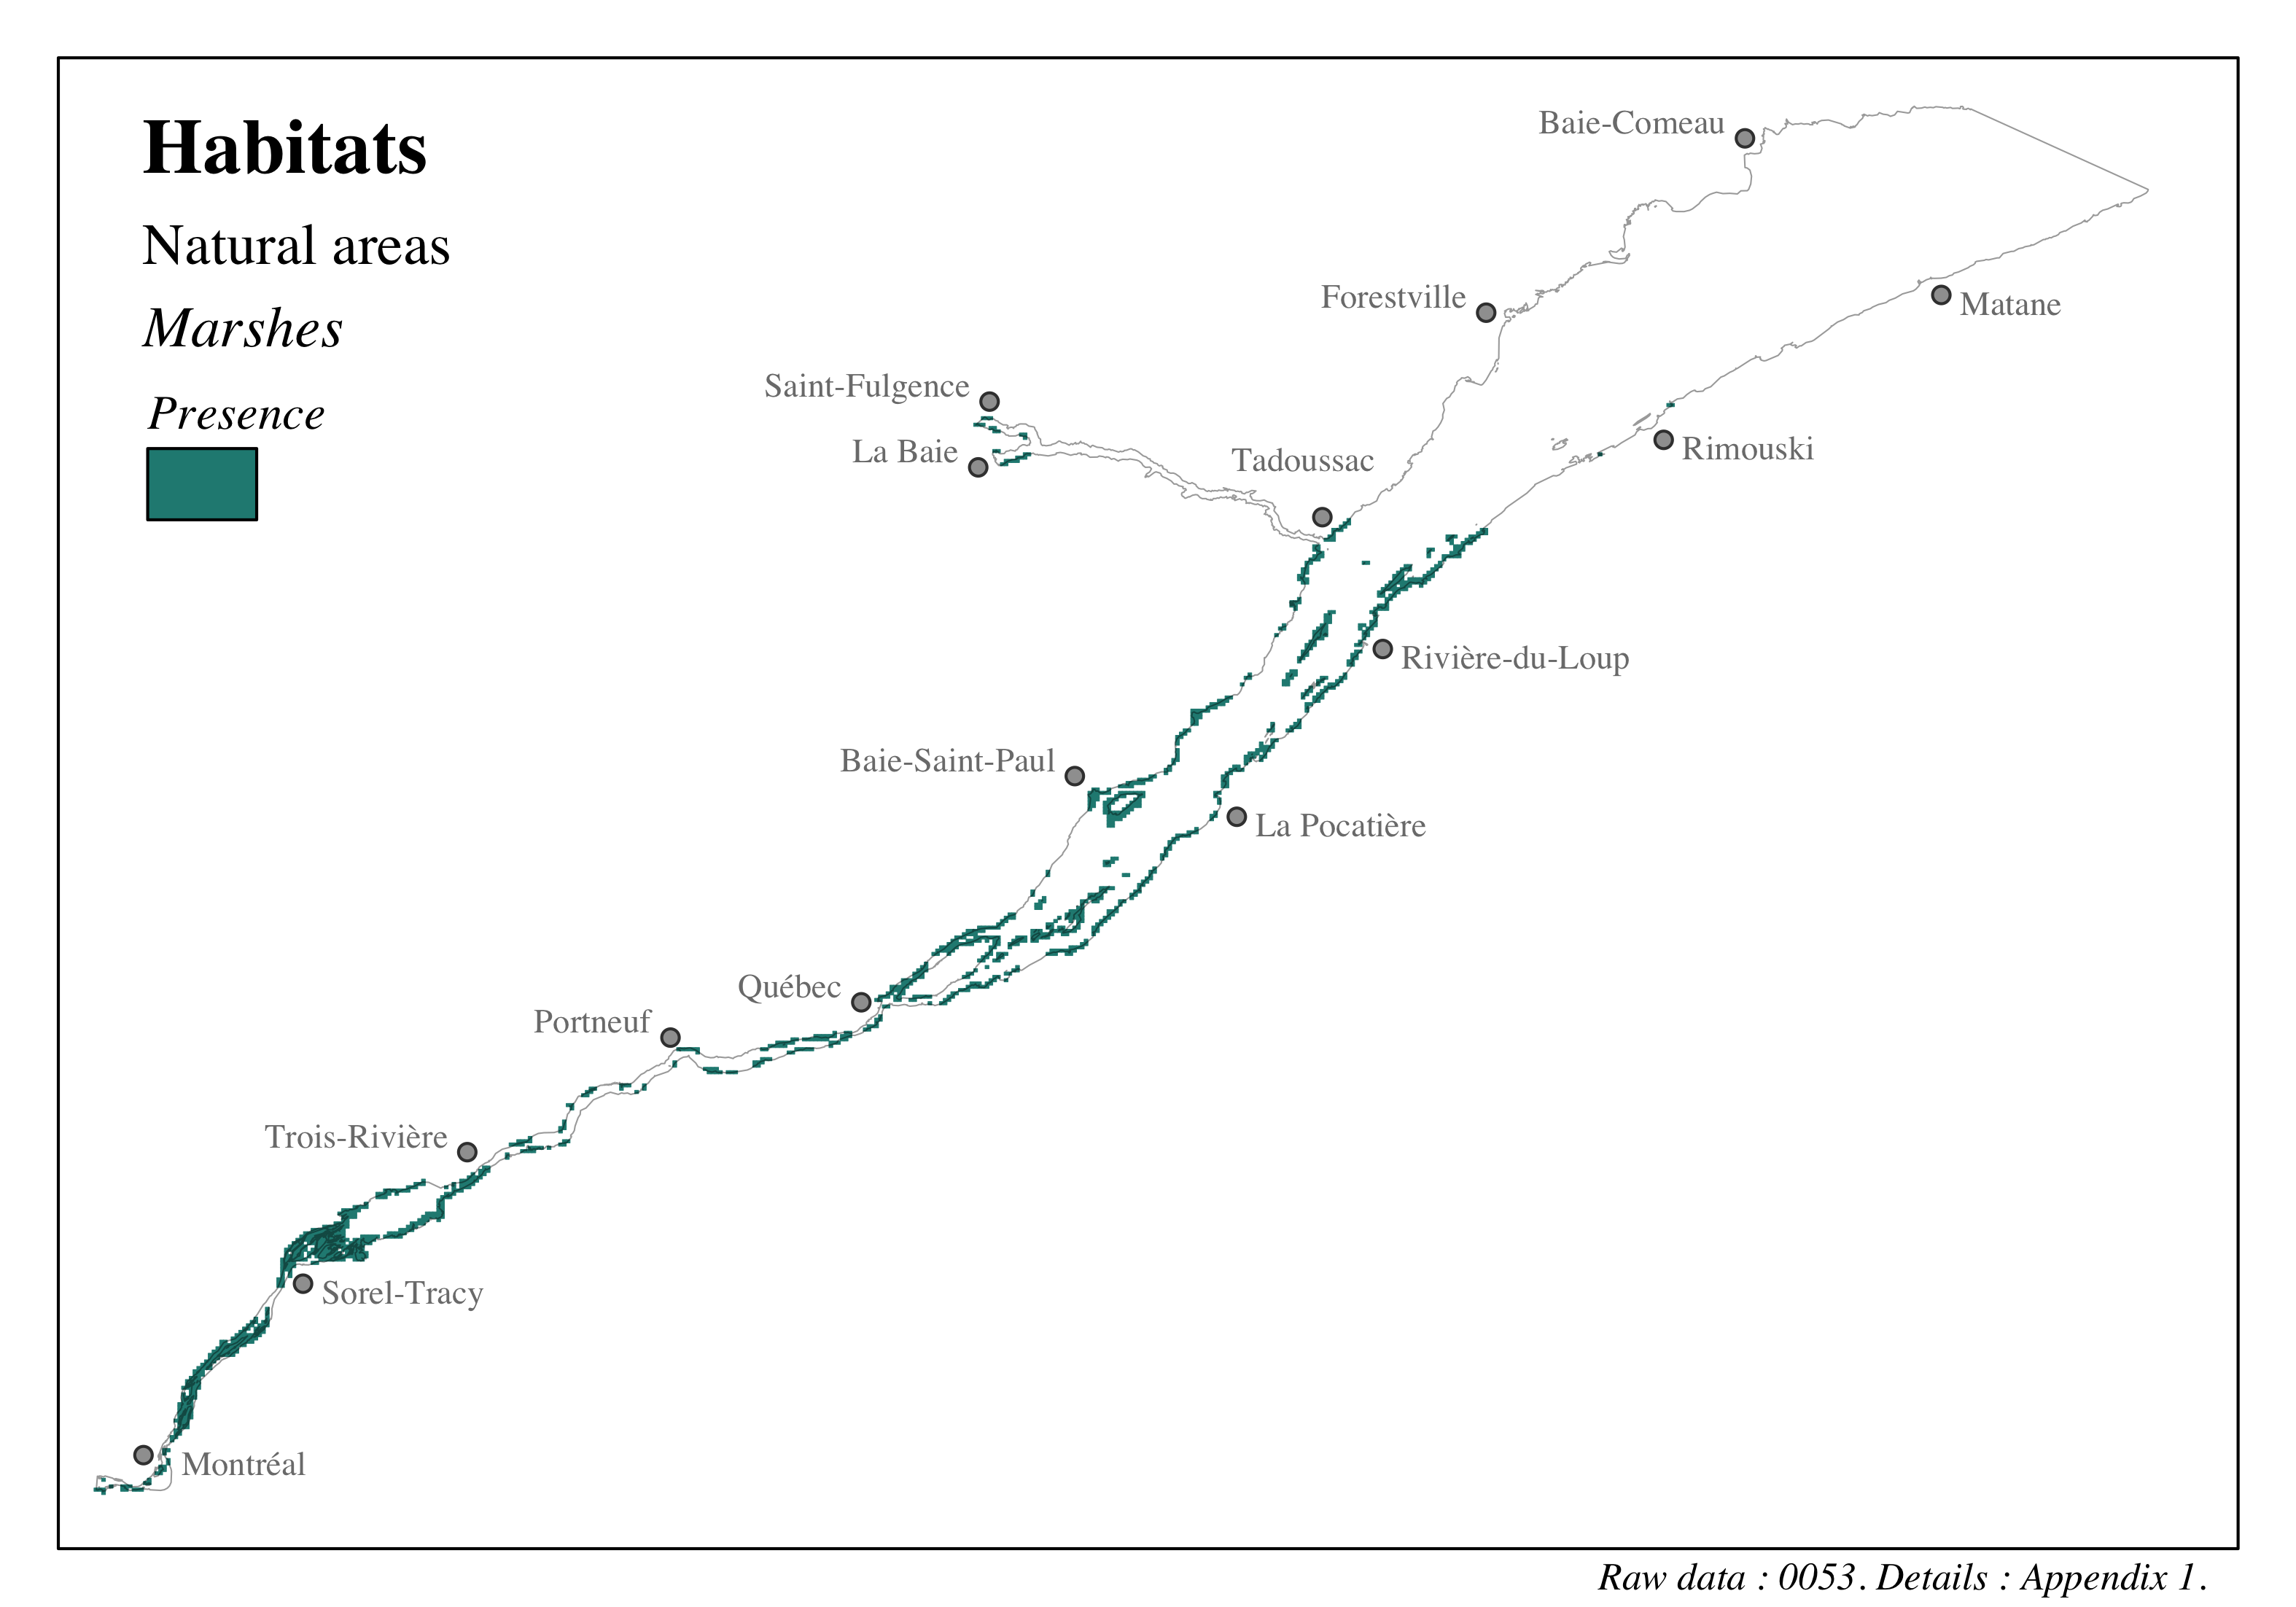
Figure 4.47: Distribution of habitats in the St. Lawrence and the Saguenay river - Marshes
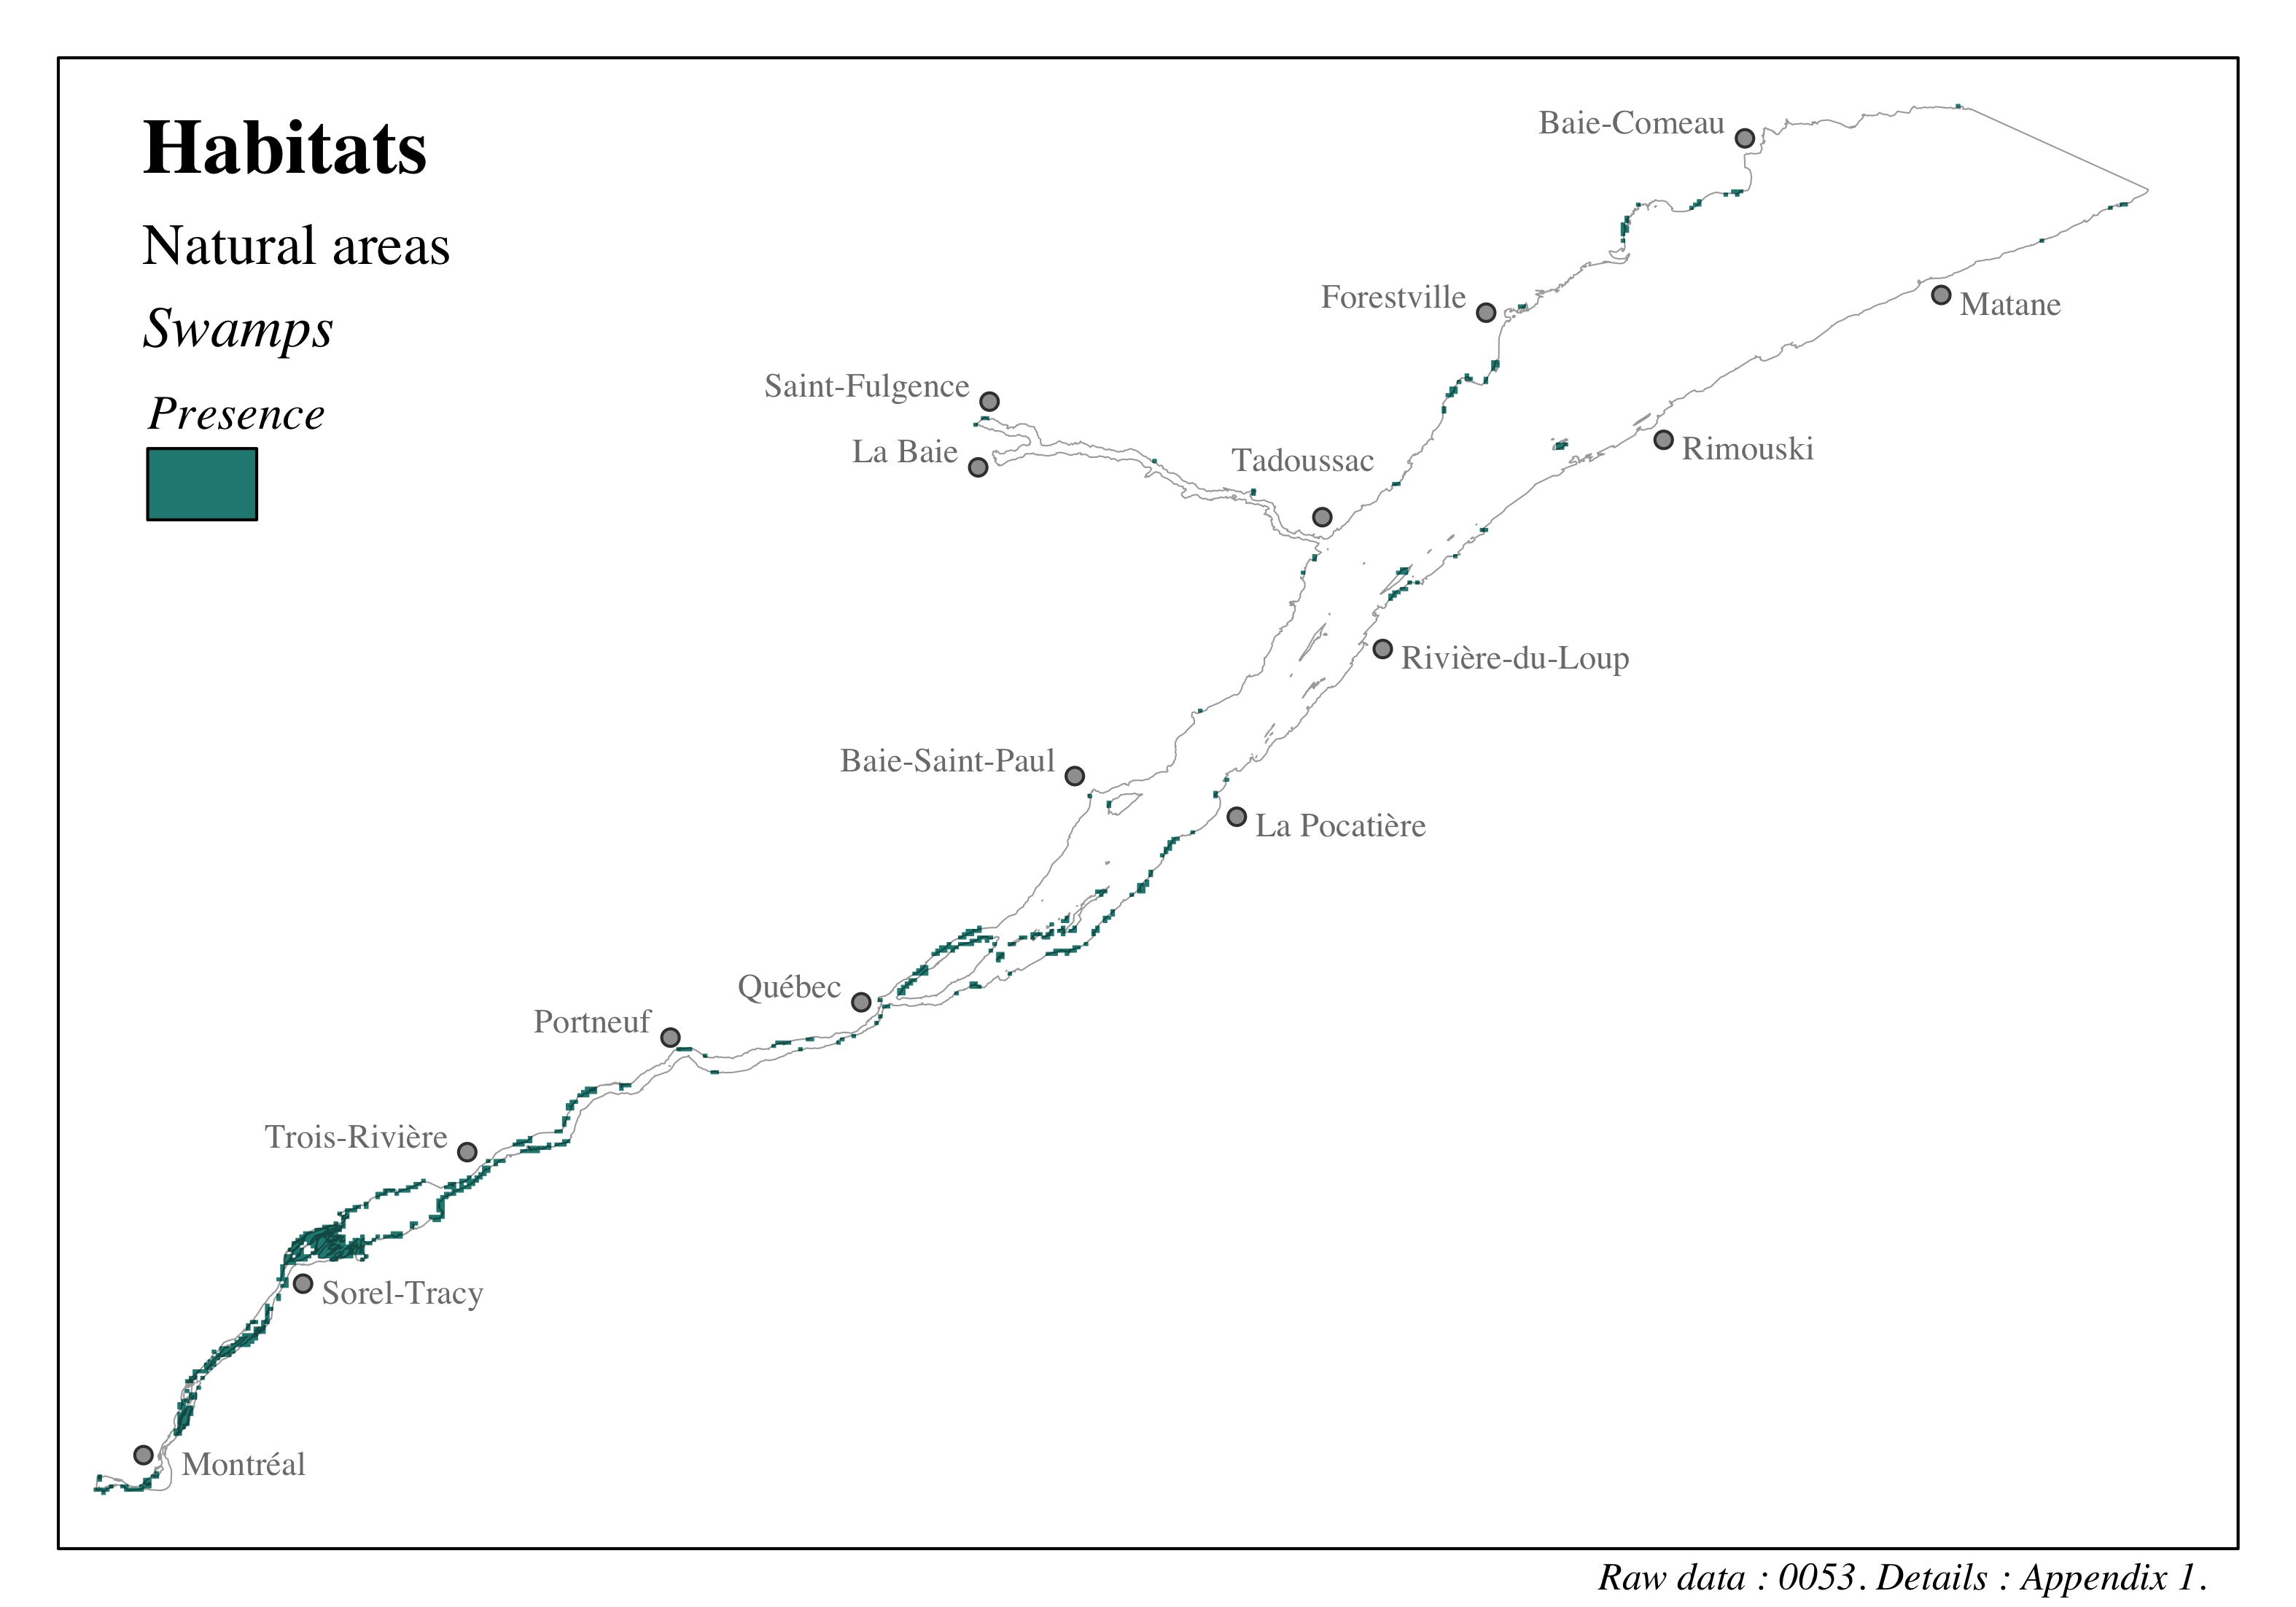
Figure 4.48: Distribution of habitats in the St. Lawrence and the Saguenay river - Swamps
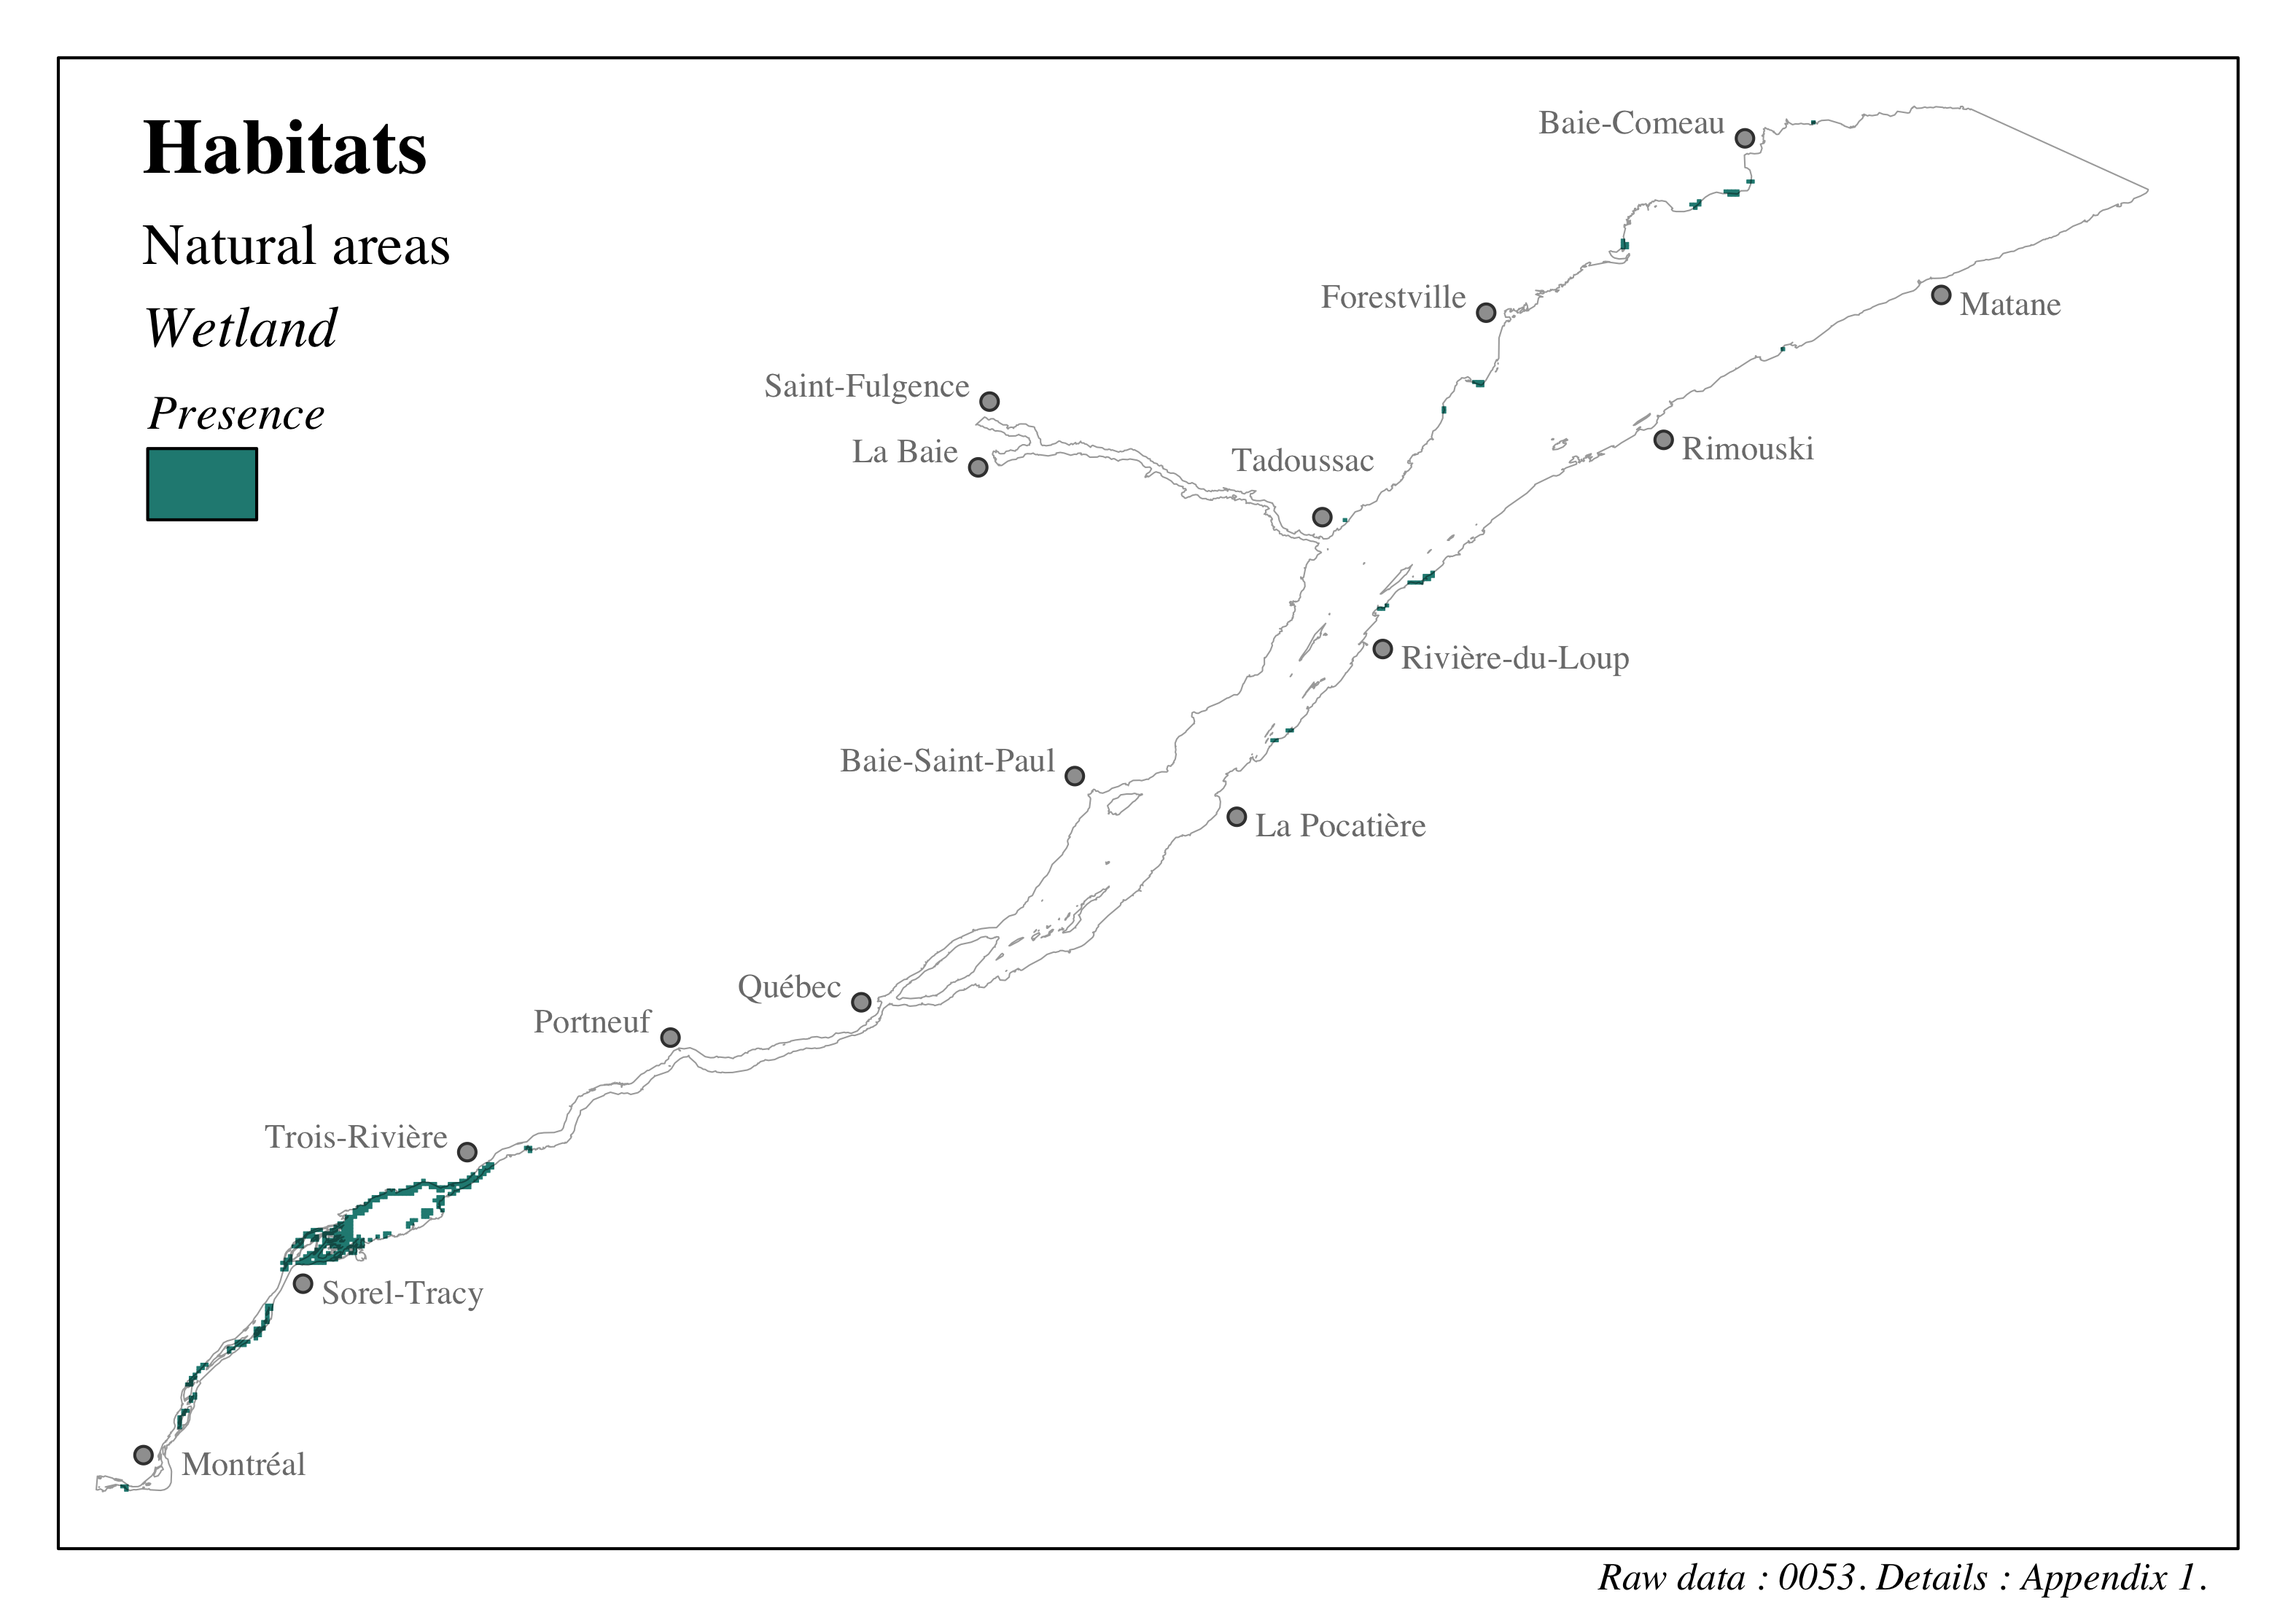
Figure 4.49: Distribution of habitats in the St. Lawrence and the Saguenay river - Wetland
4.3.1.3.5 Mollusk beds
The unique identifiers given to the data presented in this section are: 0057, 0078, 0079, 0081. Refer to the following section and to Appendix 1 for more details on these data.
The data used to characterize the mollusk beds in the study area were taken from a description of surf clam (Mactromeris polynyma) stocks in coastal environments in Quebec (Pêches et Océans Canada, 2019e; Trottier and Goudreau, 2015). The data provide the delimitation of known and commercially harvested deposits, both historically or currently, for the entire Quebec region of the Estuary and Gulf of St. Lawrence.
Those data were com bined with areas of known unharvested or commercially harvested deposits of Arctic clam [Mesodesma arctatum; Pêches et Océans Canada (2022a)], of Atlantic jackknife clam [Ensis leei; Pêches et Océans Canada (2022d)] and of soft-shell clam [Mya arenaria; Pêches et Océans Canada (2022c)]. Those data were prepared by the National Environmental Emergencies Centre (NEMC) and various projects and monitoring surveys of the Department of Fisheries and Oceand Canada.
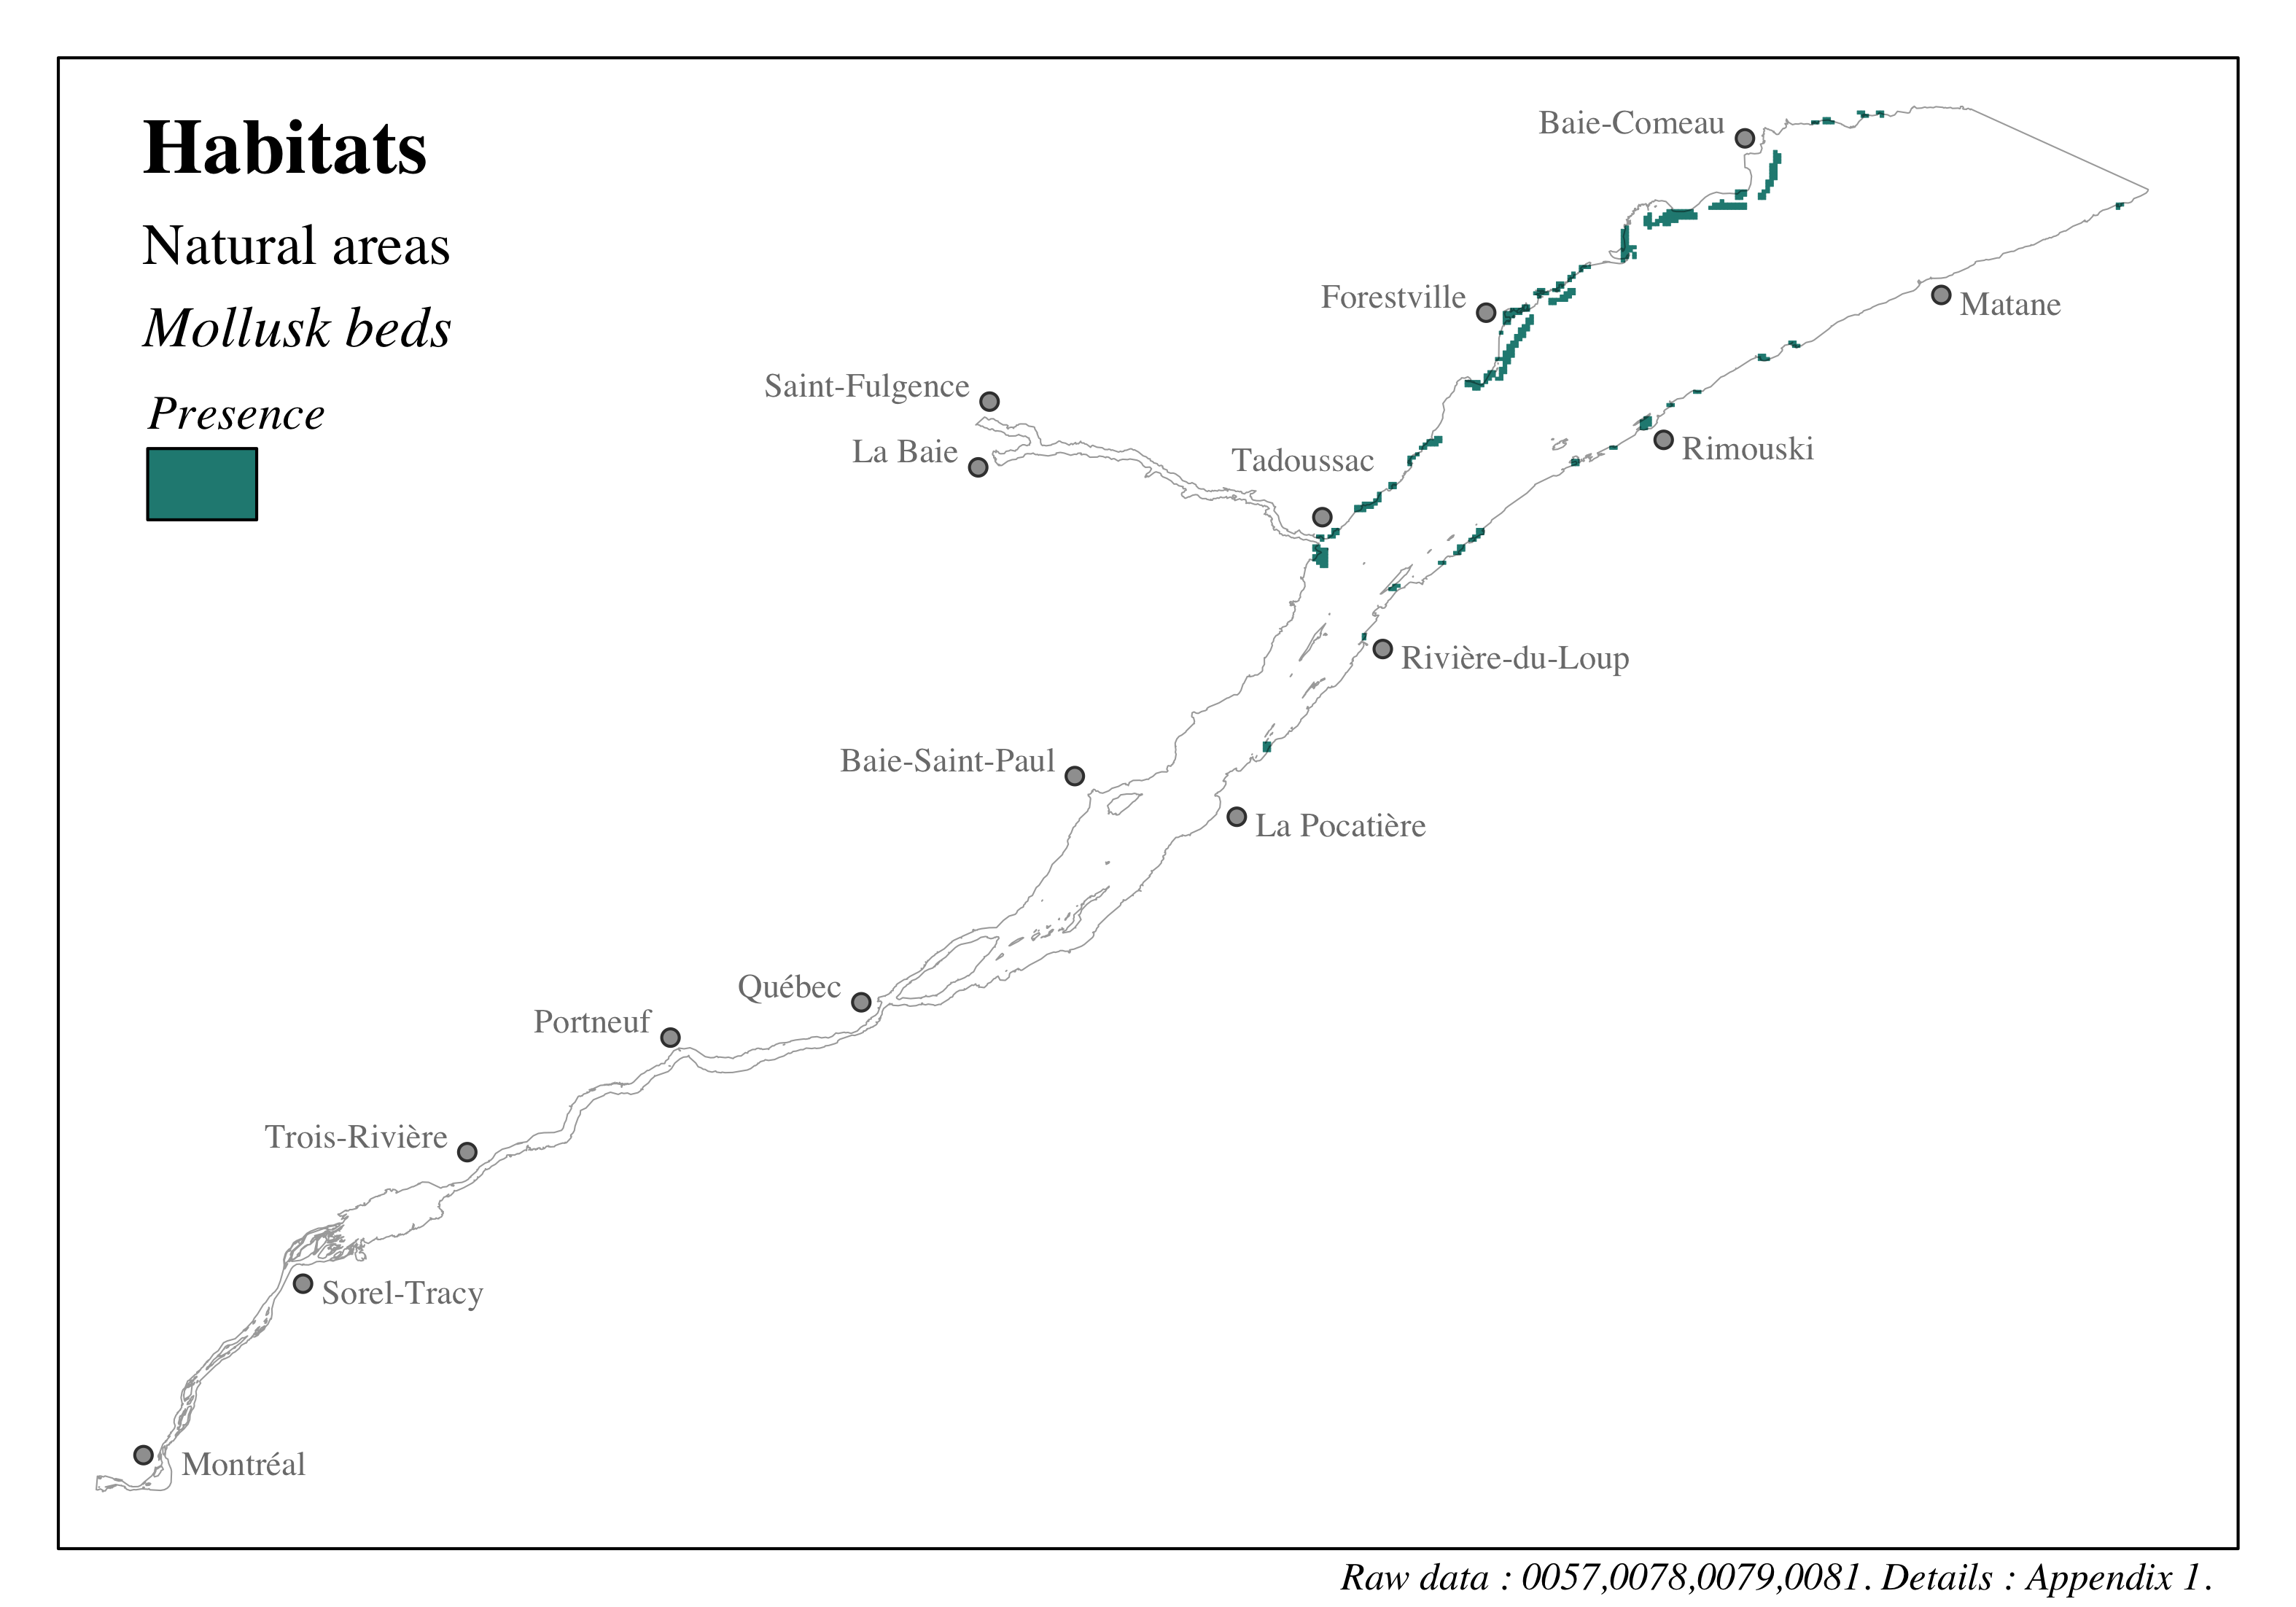
Figure 4.50: Distribution of habitats in the St. Lawrence and the Saguenay river - Mollusk beds
4.3.1.3.6 Aquatic grass beds
We thank Marc Mingelbier and Marie-Josée Gagnon from the Ministère de l’Environnement, de la Lutte contre les changements climatiques, de la Faune et des Parcs du Québec for the discussions and support.
The unique identifier given to the data presented in this section is: 0084. Refer to the following section and to Appendix 1 for more details on these data.
Biovolumes of aquatic grass beds were obtained from sonar data from 2021 surveys in the fluvial sector of the study area (Ministère de l’Environnement, de la Lutte contre les changements climatiques, de la Faune et des Parcs, 2022). Only areas with biovolumes higher than 0.1 were included to characterize aquatic grass beds in this assessment. Grass beds were divided in 3 biovolume categories: low (19.27 \(km^2\)), moderate (9.57 \(km^2\)) and high (13.98 \(km^2\)), by using the 33rd and 66th quantile of observed biovolumes in the complete dataset. The biovolume categories were then added to the study grid by ensuring that each cell could contain only a single category. When multiple categories overlapped with a single cell, the highest category was retained. It should be noted that other surveys to characterize aquatic grass beds are planned for future years.
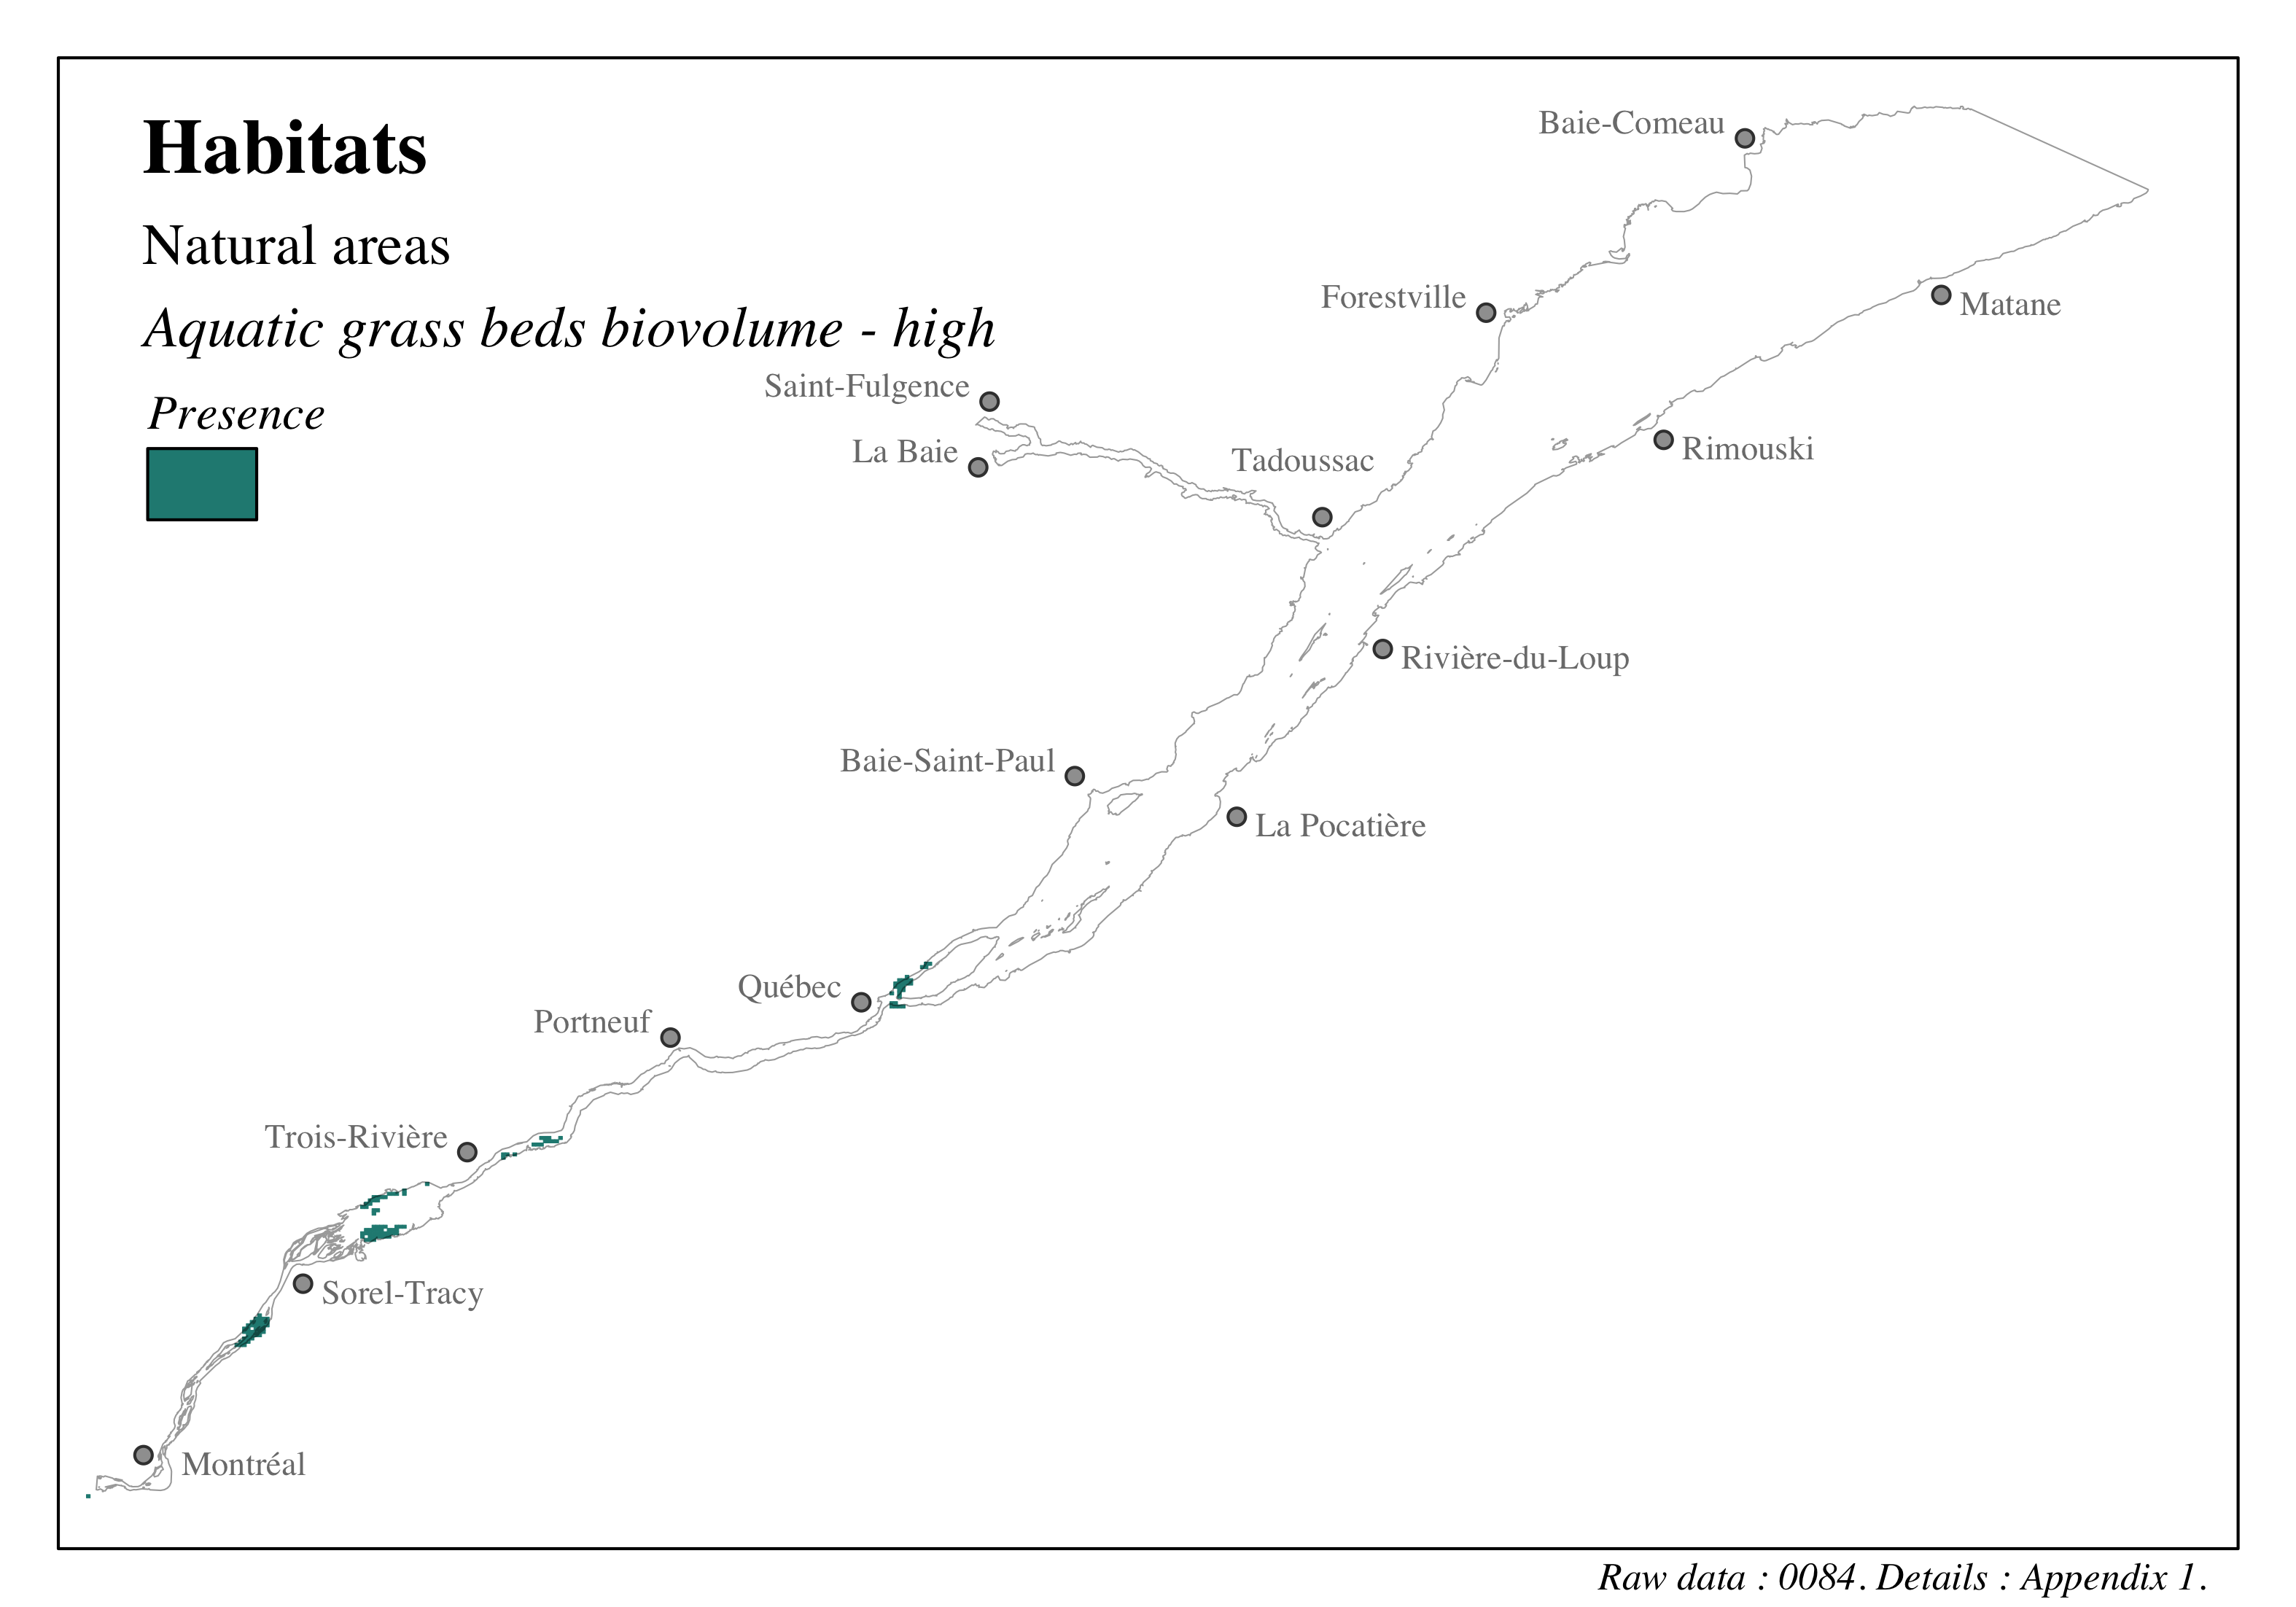
Figure 4.51: Distribution of habitats in the St. Lawrence and the Saguenay river - Aquatic grass beds biovolume - high
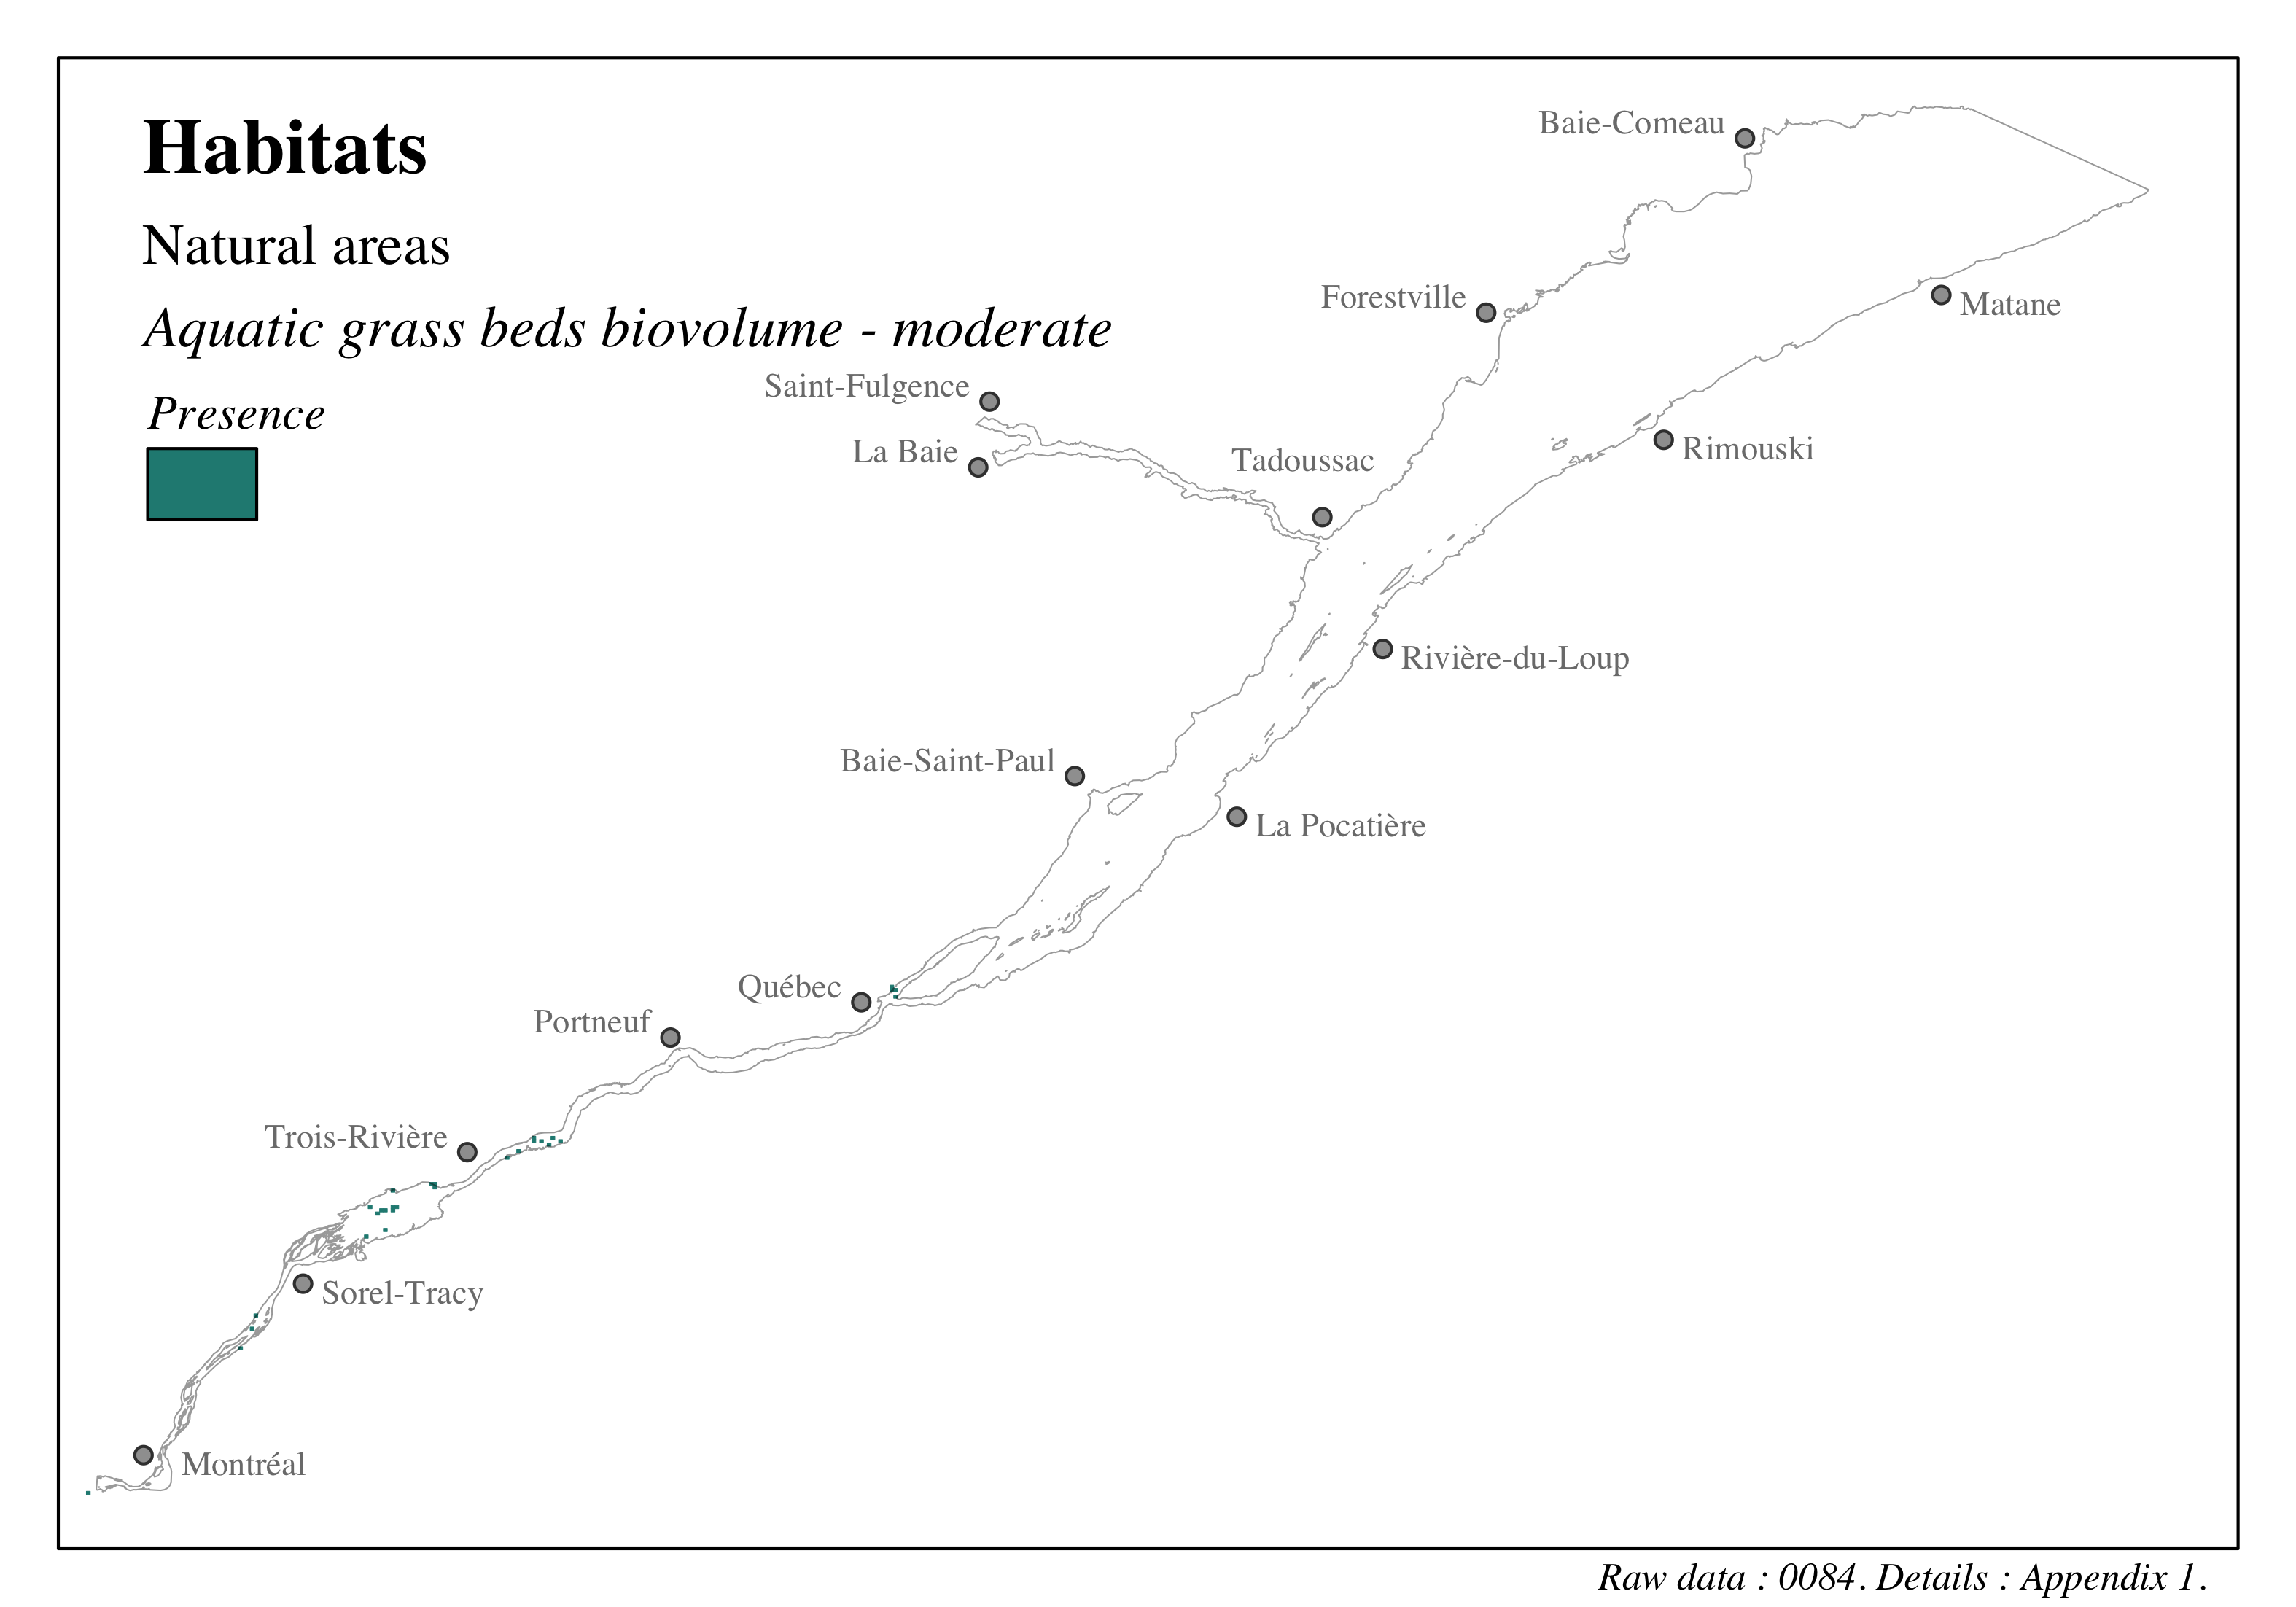
Figure 4.52: Distribution of habitats in the St. Lawrence and the Saguenay river - Aquatic grass beds biovolume - moderate
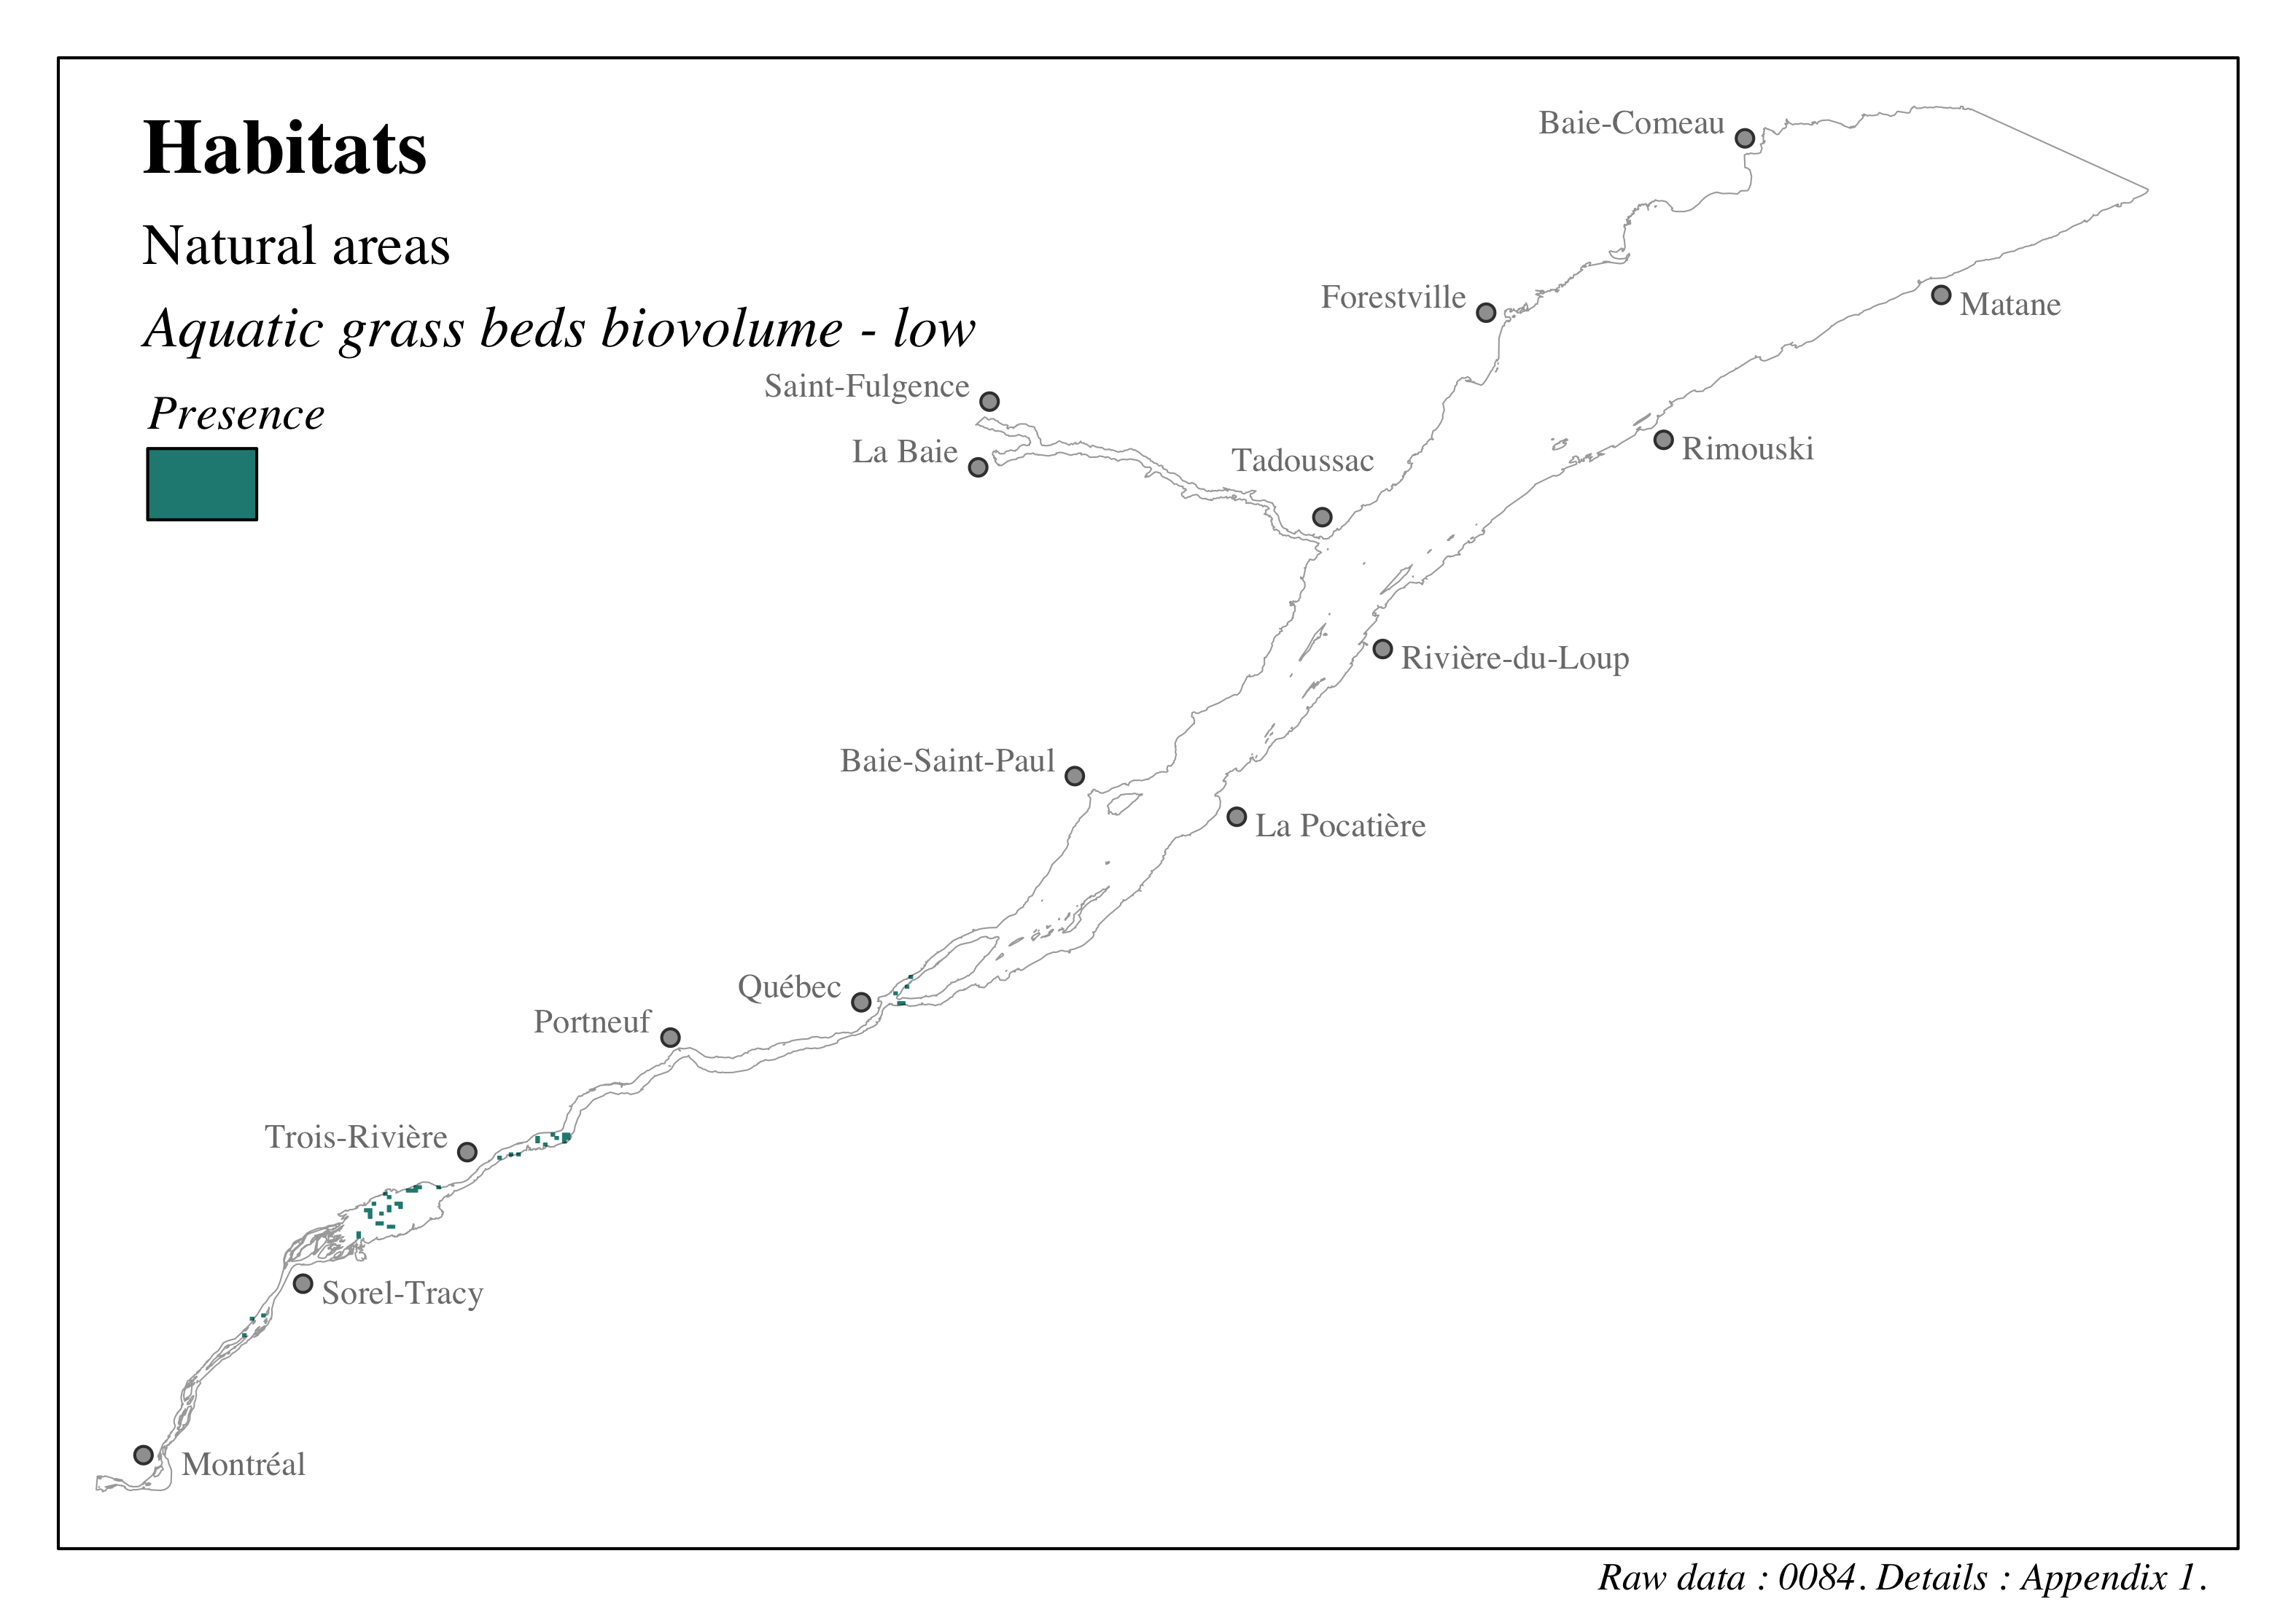
Figure 4.53: Distribution of habitats in the St. Lawrence and the Saguenay river - Aquatic grass beds biovolume - low
4.3.2 Bank integrity
We thank Patrick Lajeunesse and Jean-François Bernier at Université Laval for the discussions and support.
The unique identifier given to the data presented in this section is: 0017. Refer to the following section and to Appendix 1 for more details on these data.
The bank integrity valued component was characterized using geospatial data from a recent bank characterization exercise in the fluvial portion of the St. Lawrence River by Patrick Lajeunesse’s team at Université Laval (Bernier et al., 2020; Bernier et al., 2021). This characterization was conducted using a high-resolution mapping approach to spatially position, characterize and assess natural and artificial banks’ susceptibility to erosion; this was done using a combination of data from land surveys, remote sensing, and local community knowledge (Bernier et al., 2020; Bernier et al., 2021). The geospatial data from this project provide a characterization of bank erosion susceptibility by classifying their state in a three-level erosion index (EI; Figure 2 in Bernier et al., 2021):
- Active (EI = 2): Apparent erosion or vegetation cover < 25%
- Semi-vegetated (EI = 1): Apparent erosion or vegetation cover of 25 to 75%
- Stable or vegetated (EI = 0): No apparent signs of erosion, and vegetation cover > 75% or presence of a protective structure
For our study, we consider only those banks that have apparent signs of erosion, i.e., banks with an EI > 0. We also distinguish between natural and artificial banks; this distinction is made to separate the effects of shipping on natural banks, which have a higher ecological value than artificial banks. Combining the condition of the banks as described in Bernier et al. (2020) and Bernier et al. (2021) and the degraded state of the artificialities thus results in four categories of banks susceptible to the effects of erosion (Table 4.17).
| Categories | Length (km) |
|---|---|
| Artificial - Semi-vegetated (EI = 1) | 239.77 |
| Artificial - Active (EI = 2) | 55.57 |
| Natural - Semi-vegetated (EI = 1) | 390.91 |
| Natural - Active (EI = 2) | 257.64 |
These four categories were then incorporated into the grid to assess the presence of the various categories of erosion-sensitive banks within the study area. It is important to note that since this valued component has only been identified for the fluvial portion of the St. Lawrence, no characterization has been done for the estuary and the Saguenay River. However, a similar characterization was recently published through the Coastal Resilience Project Projet Résilience côtière led by Pascal Bernatchez’s team at the Université du Québec à Rimouski.
4.3.2.1 Artificial banks
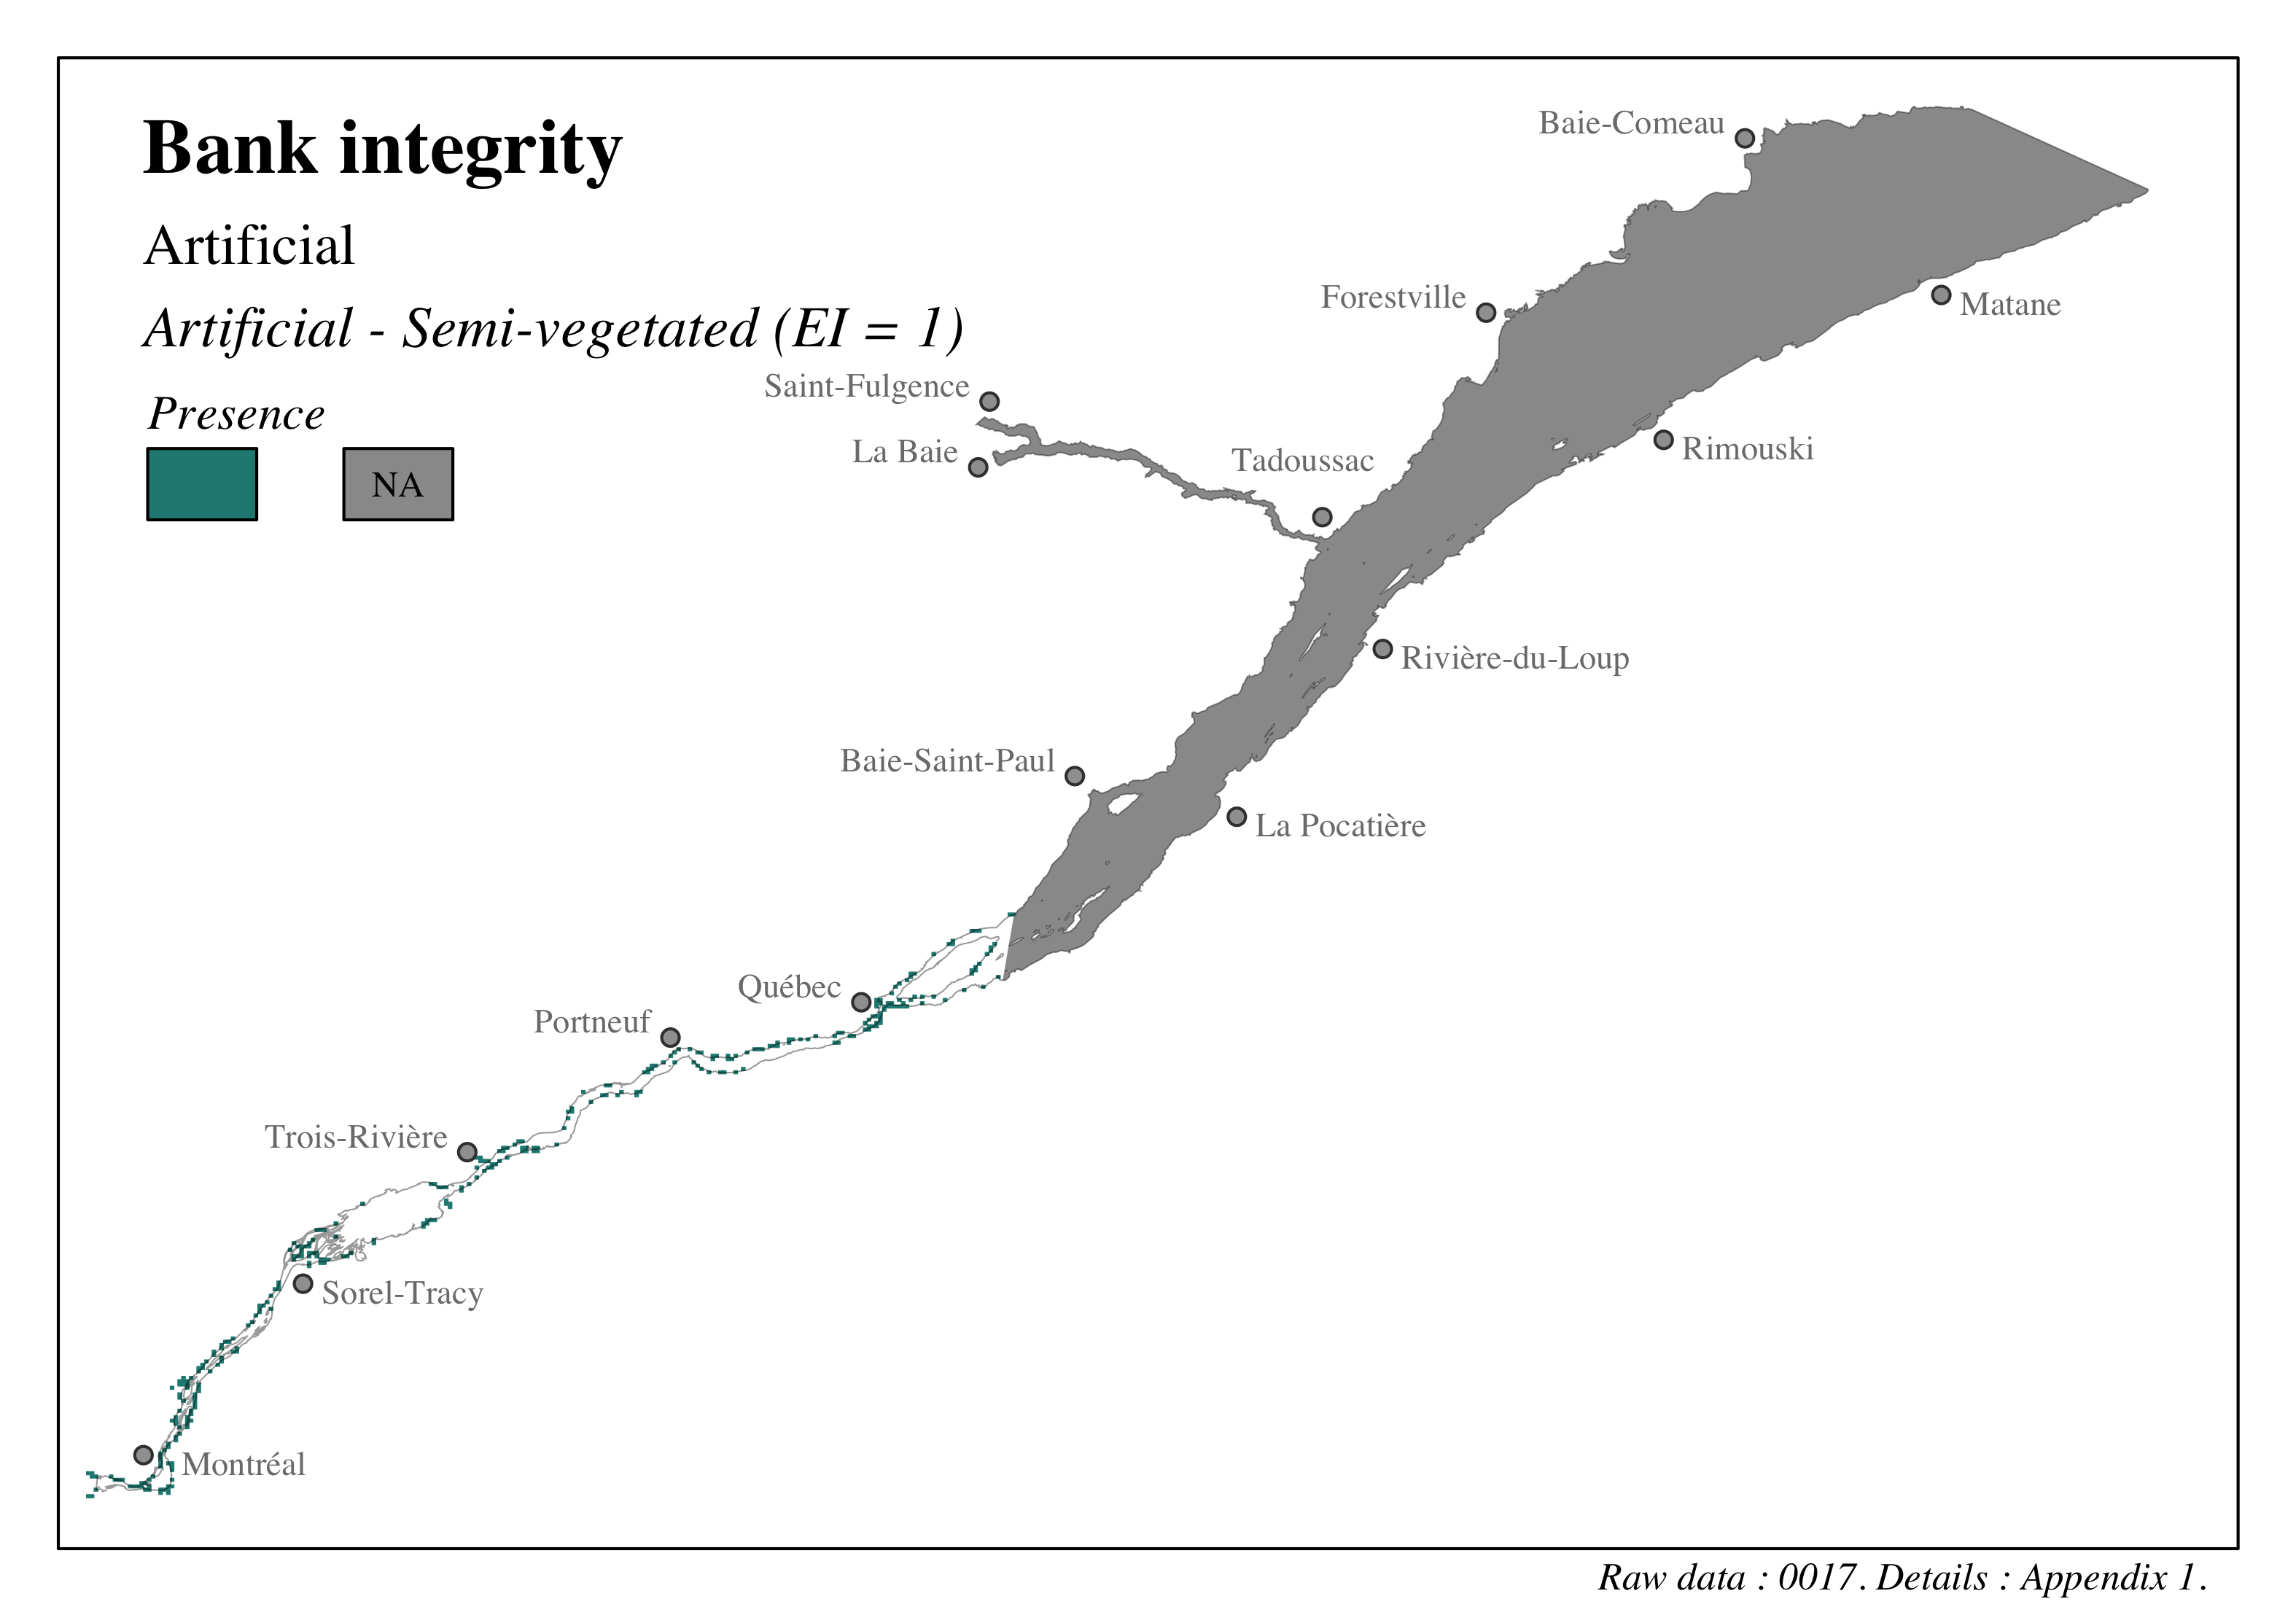
Figure 4.54: Distribution of coastlines sensitive to erosion in the St. Lawrence and the Saguenay river - Artificial - Semi-vegetated (EI = 1)
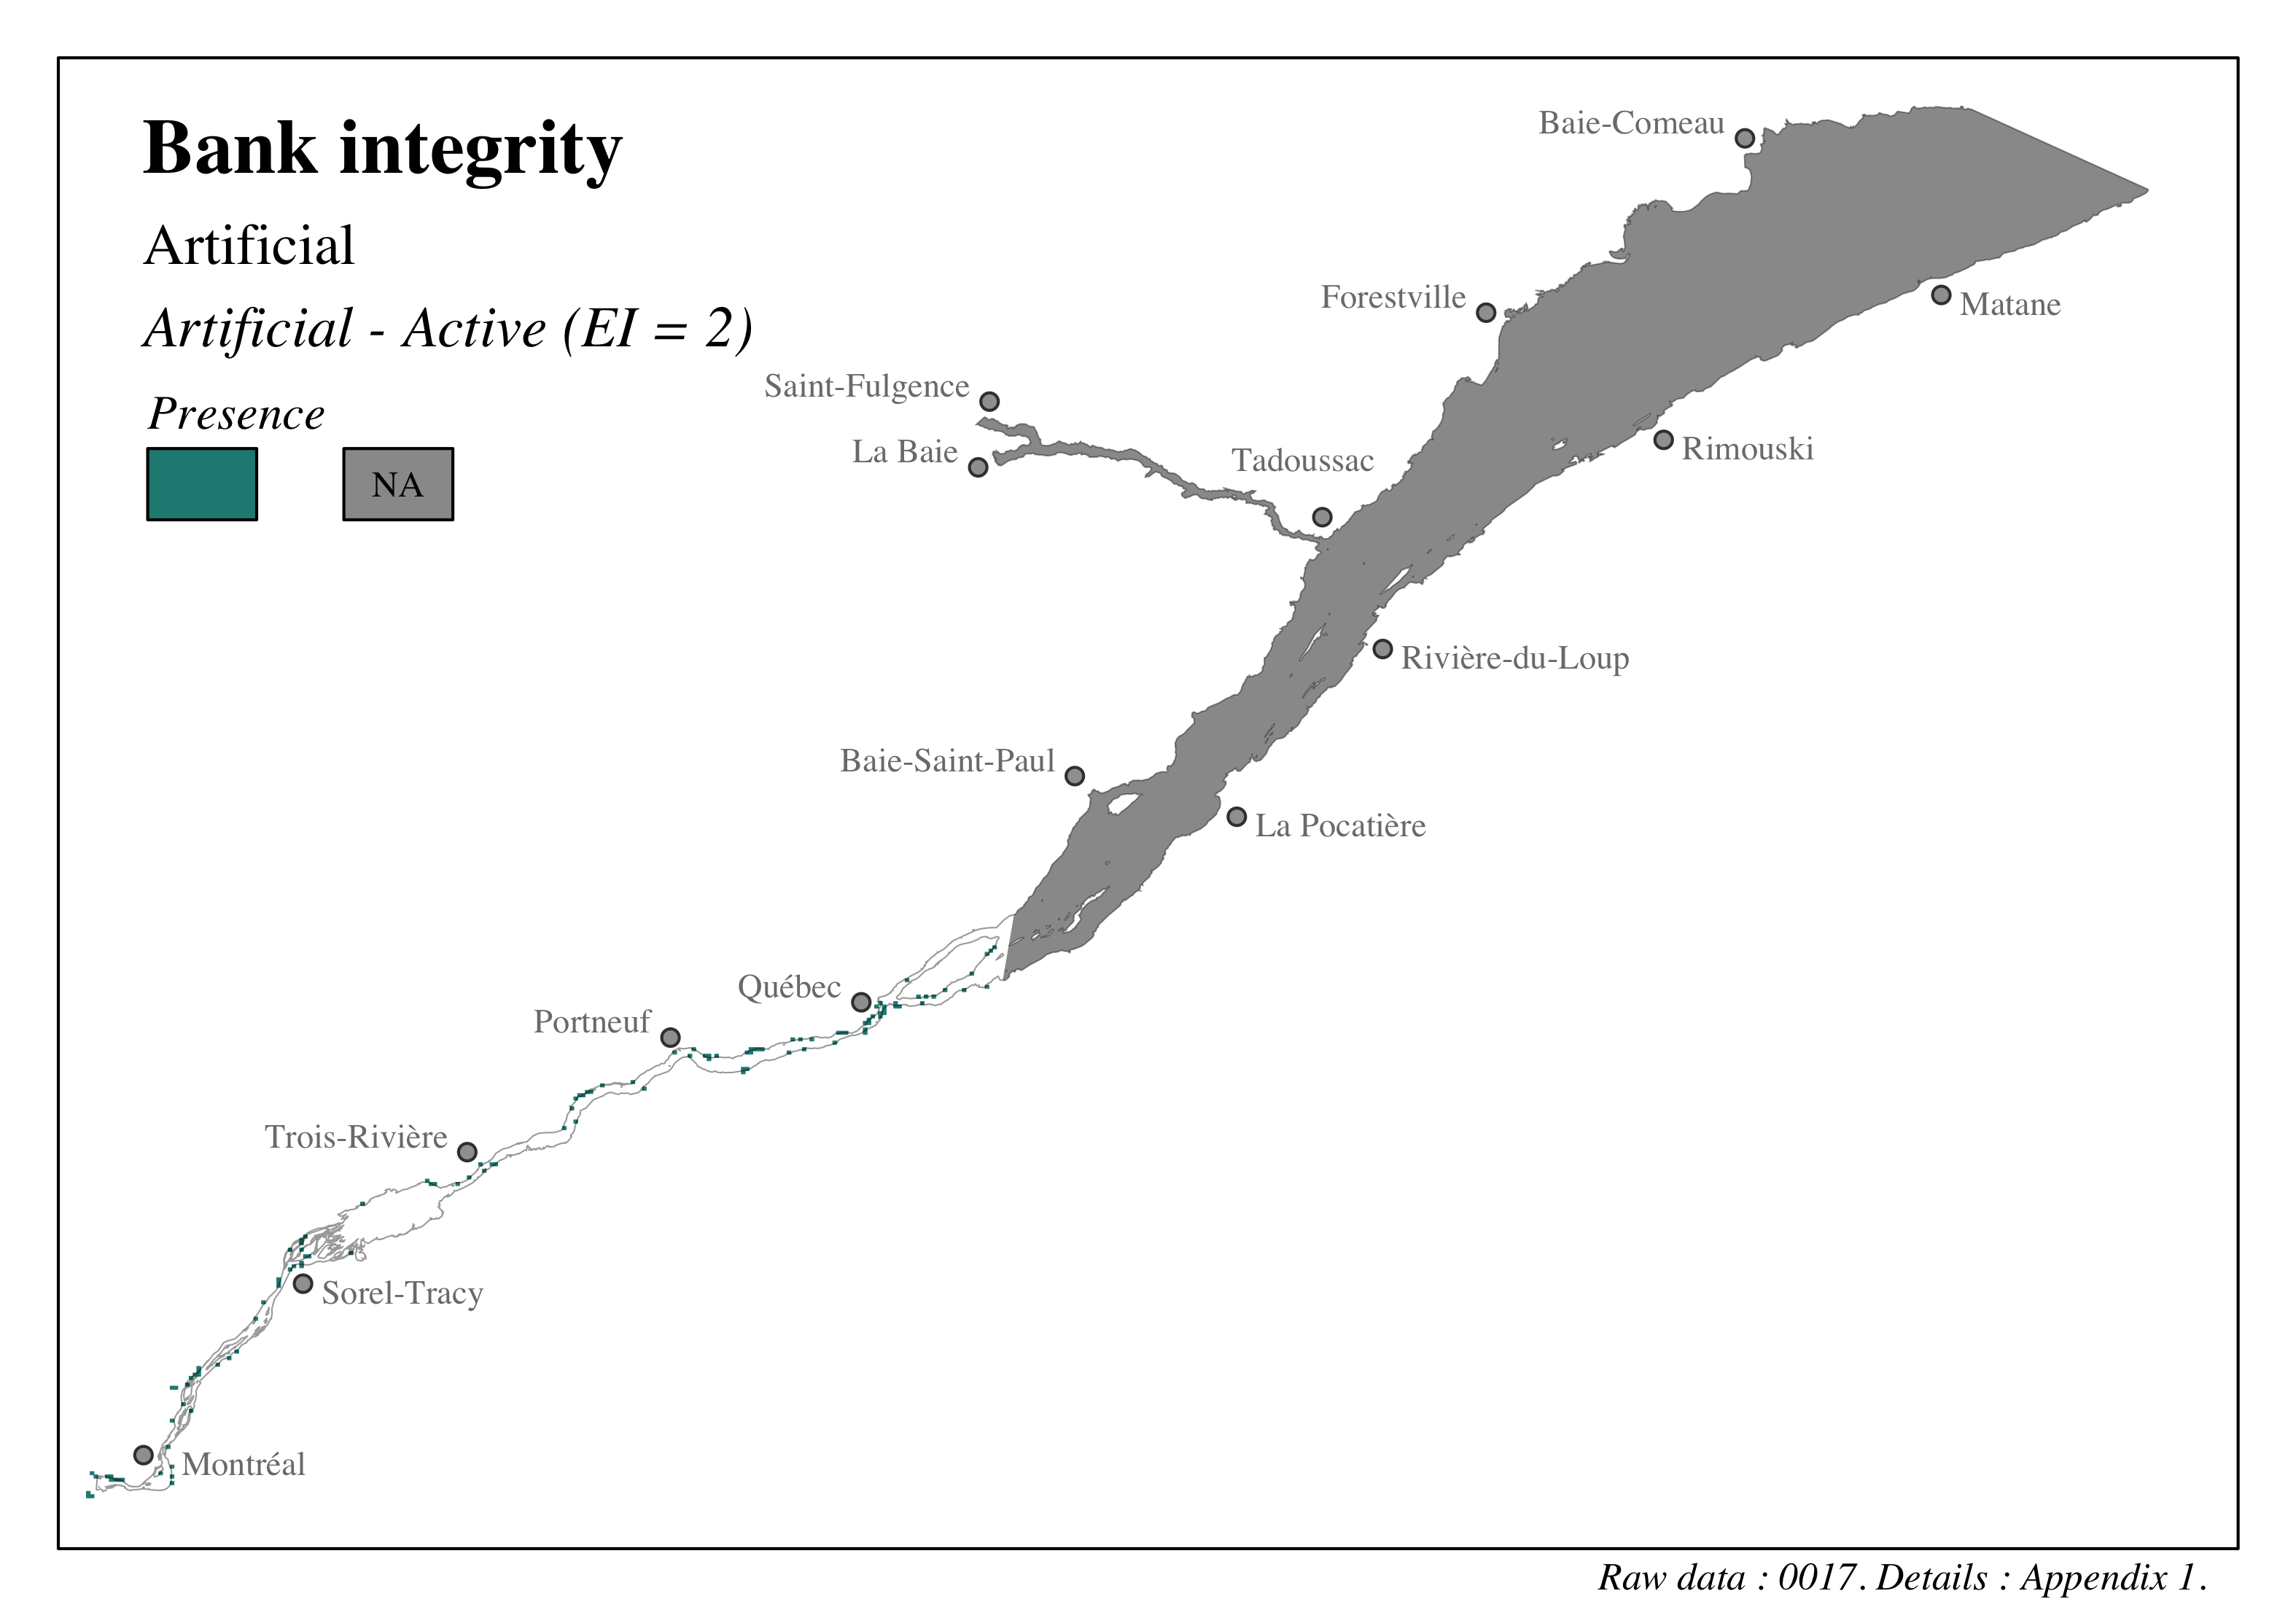
Figure 4.55: Distribution of coastlines sensitive to erosion in the St. Lawrence and the Saguenay river - Artificial - Active (EI = 2)
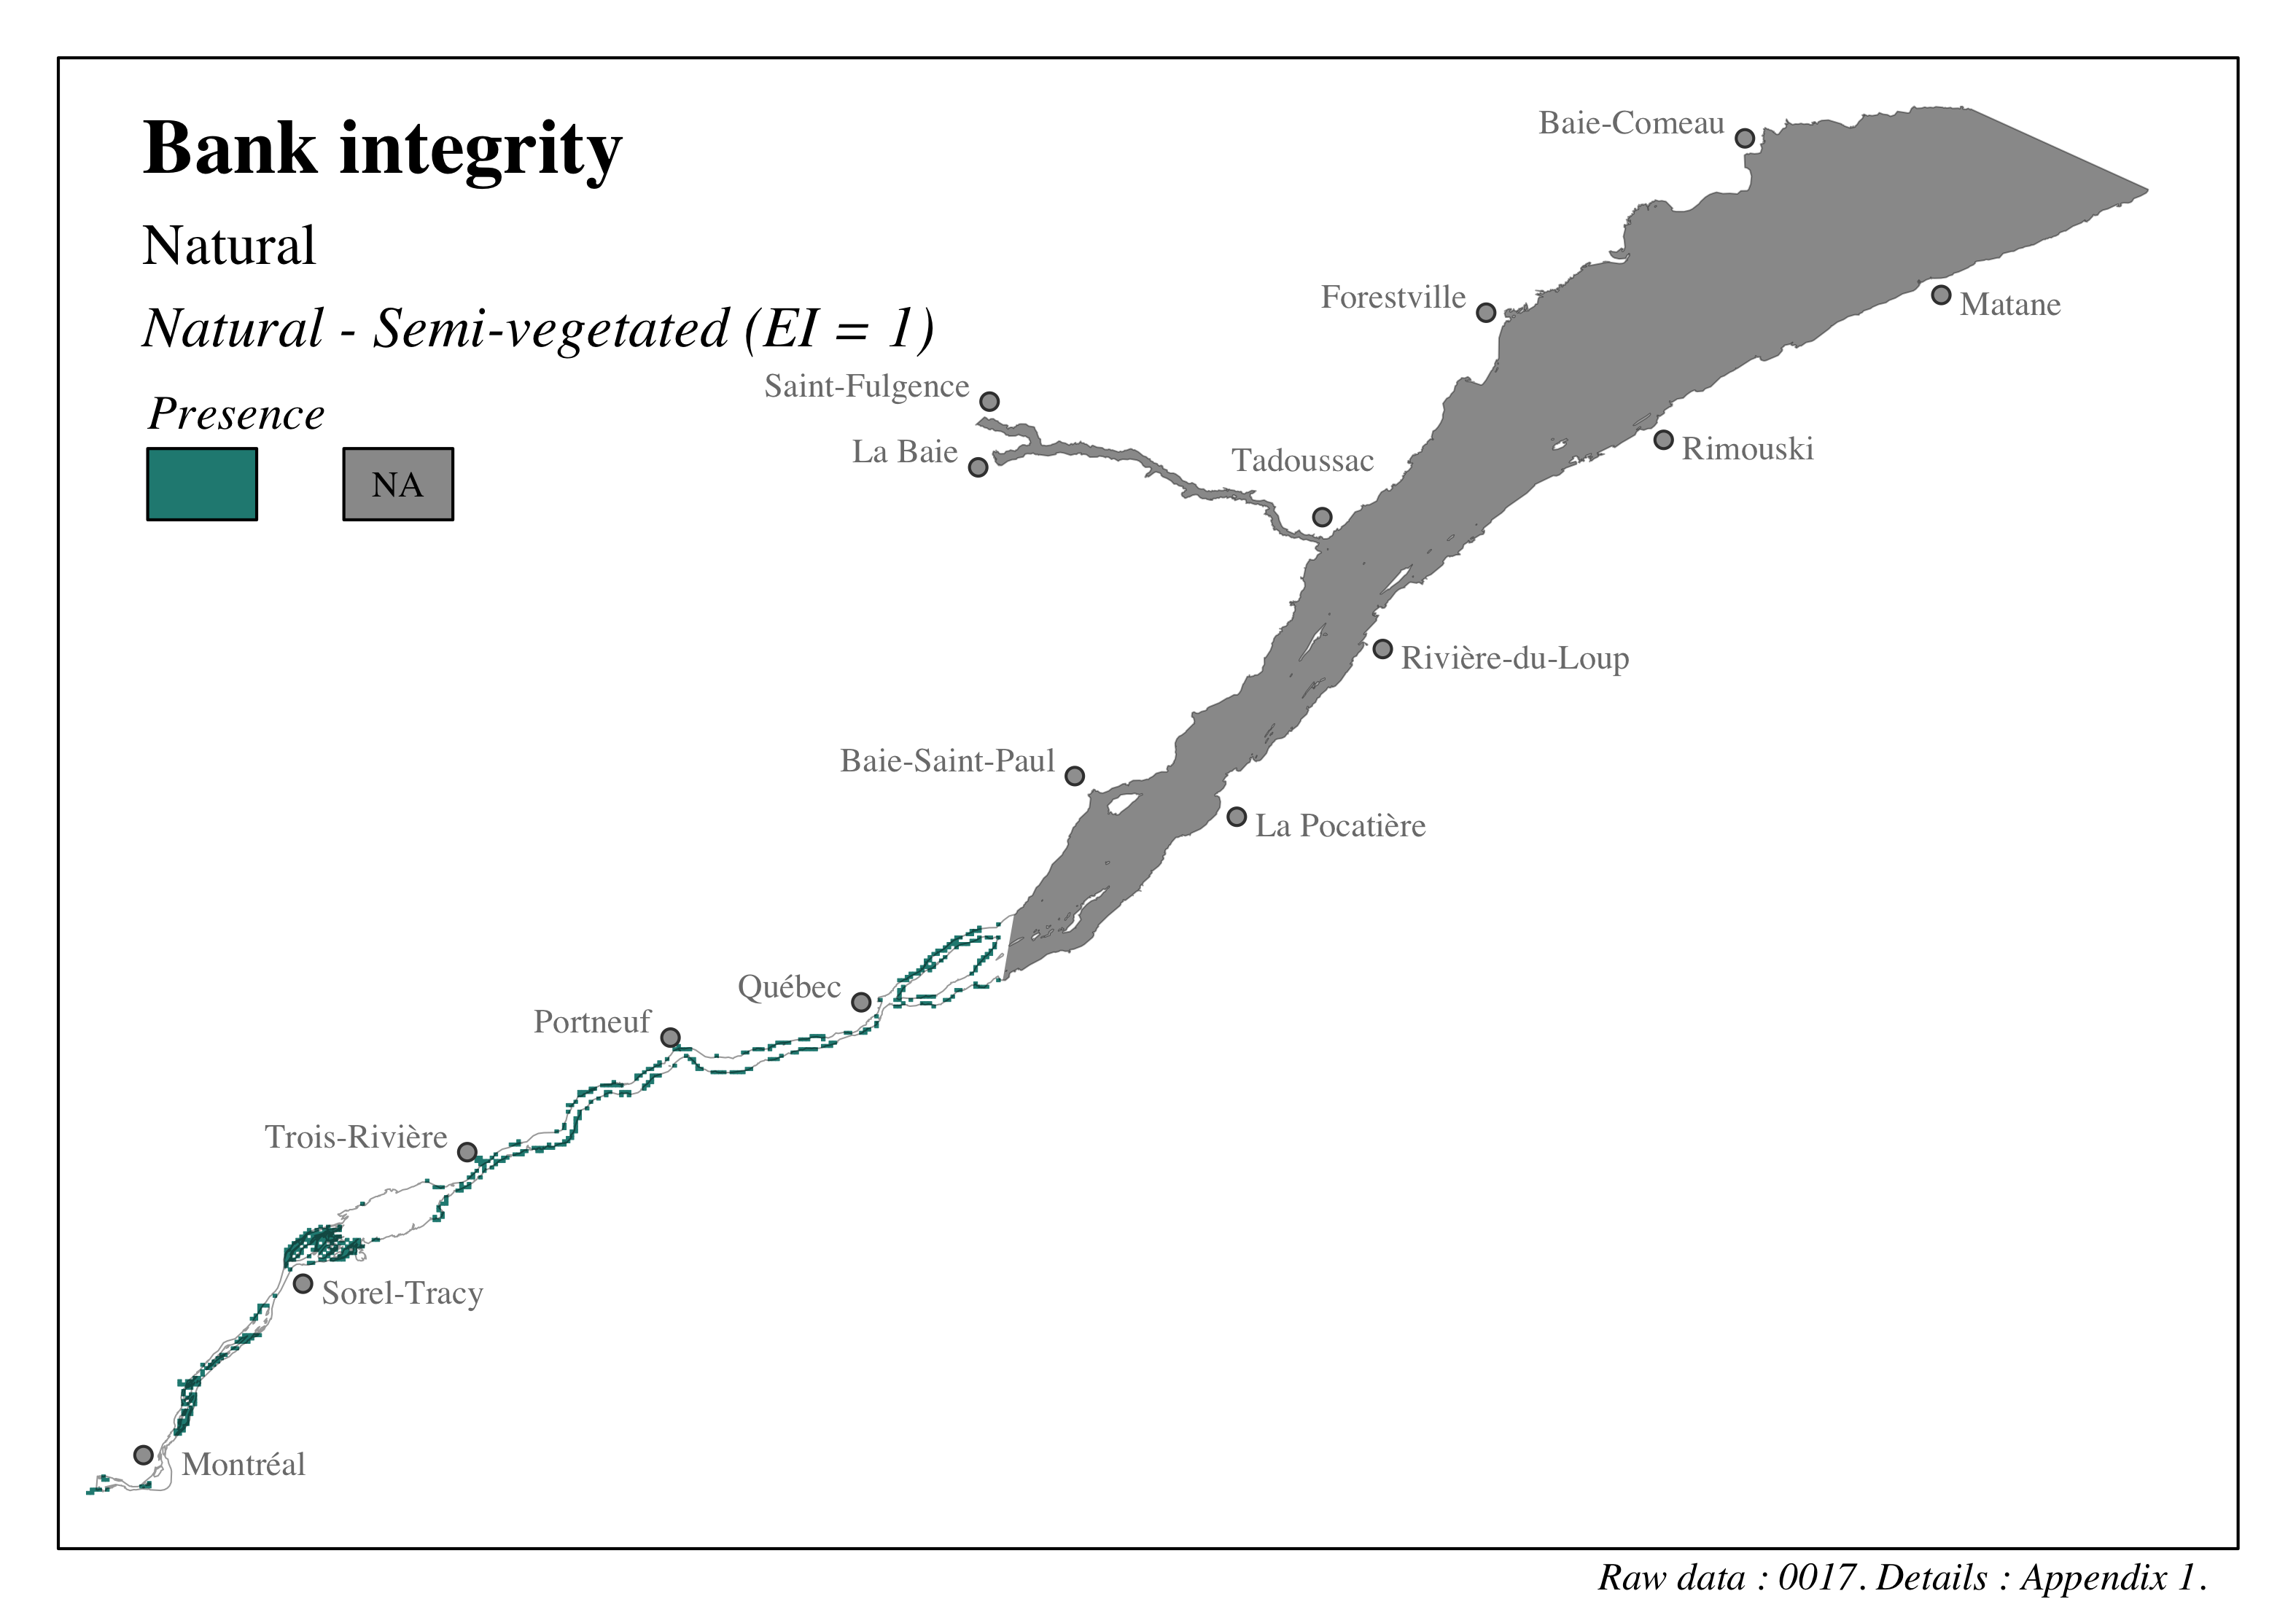

4.3.3 Marine mammals
We thank Sonia Giroux of the Marine Mammal Observation Network (Réseau d’observation de mammifères marins, ROMM) and Aurélie Cosandey-Godin of WWF-Canada for their discussions and support.
We also thank Arnaud Mosnier from Fisheries and Oceans Canada for the data and for the discussions during the 2023 update of data on marine mammals of the St. Lawrence.
The unique identifiers given to the data presented in this section are: 0027, 0054, 0085. Refer to the following section and to Appendix 1 for more details on these data.
The original characterization of marine mammal distribution in the study area was taken from the second edition of a guidebook published for mariners who frequent the Northwest Atlantic (Le WWF-Canada et le Réseau d’observation de mammifères marins, 2021a). The purpose of this guide is to inform mariners on the problem of collisions between vessels and whales, how to minimize such incidents, the various species of whales and leatherback turtles in the area and where they might be present, and on areas where heightened vigilance is required. This guide provides distribution maps for nine species of marine mammals that frequent the Northwest Atlantic (Le WWF-Canada et le Réseau d’observation de mammifères marins, 2021a, 2021b). These species were selected because of their conservation status and their known risk of collision with vessels.
Distribution maps were assessed by integrating 14 separate datasets from scientific and opportunistic sightings (Table 4.18; Le WWF-Canada et le Réseau d’observation de mammifères marins (2021c)). Sighting data covering the period 2010-2015 and geographic boundaries of \(40^o\) to \(55^o\) N and -72\(^o\) to -48\(^o\) W were selected to create the maps shared in the guide. The study area was divided into a regular 0.05\(^o\) x 0.05\(^o\) grid. For each species, the number of sightings recorded in 14 available databases was assessed for each cell of the study grid. A Gaussian smoothing – i.e. an interpolation method based on a normal distribution – of 0.2\(^o\) was then applied to the grid. The values obtained in each cell were normalized by the total number of sightings for a species; the value in a cell therefore represents the proportion of the total number of sightings per species within the study area. Lastly, a log transformation was then applied to minimize the effect of extreme values on the resulting maps.
Caveats accompany these maps and are reported verbatim in this report:
- Sighting effort was not quantified and varies considerably in time and space. The data represent the relative occurrence of reported sightings rather than the actual density or abundance of the species.
- The quality of some of the sighting data is unknown. Sightings are reported from individuals with varying degrees of expertise in identifying marine mammals.
| Name of dataset | Temporal series | Owner | Species (n) | Observations (n) | Scientific (S) or Opportunistic (O) |
|---|---|---|---|---|---|
| Whitehead, Université Dalhousie | 1988-2019 | Université Dalhousie | 27 | 2464 | S/O |
| WWAM | 2015-2019 | Parcs Canada | 7 | 1353 | S |
| WWAM_C | 2015-2019 | Parcs Canada | 7 | 1774 | S |
| Predator pelagic prey | 2015-2018 | Parcs Canada | 7 | 816 | S |
| NAISS | 2016 | Pêches et Océans Canada | 39 | 2508 | S |
| NARW | 2017 | Pêches et Océans Canada | 31 | 2910 | S |
| NARW | 2018 | Pêches et Océans Canada | 39 | 7312 | S |
| WSDB | 1963-2019 | Base de données des observations de mammifères marins et d’animaux pélagiques, Pêches et Océans Canada, Dartmouth, N.-É. [2020/02/13] | 67 | 24538 | O |
| TC | 2018 | Transports Canada | 19 | 3517 | S |
| MICS | 2014-2018 | Station de recherche des îles Mingan | 11 | 4808 | S |
| NOAA | 2018-2020 | National Oceanic and Atmospheric Administration | 5 | 2699 | S |
| NARWC | 2015-2019 | North Atlantic Right Whale Consortium | 16 | 18190 | S |
| AOM_MMON | 2014-2019 | Réseau d’observation de mammifères marins | 8 | 4705 | S |
| Shipping_MMON | 2015-2019 | Réseau d’observation de mammifères marins | 35 | 5891 | O |
Of the nine species for which mappings are available, five frequent the St. Lawrence Estuary and the Saguenay River: the St. Lawrence beluga whale (Delphinapterus leucas), the minke whale (Balaenoptera acutorostrata), the humpback whale (Megaptera novaeangliae), the blue whale (Balaenoptera musculus), and the fin whale (Balaenoptera physalus; Table 4.19). For our study, we resampled the distribution maps produced (Le WWF-Canada et le Réseau d’observation de mammifères marins, 2021b) to integrate them into our 1 \(km^2\) study grid using the average value of the guide grid cells that intersect each cell in our grid. The values were then normalized between 0 and 1 by dividing each value by the maximum value observed within the grid for each species. The resulting values can be interpreted as the relative density of marine mammal sightings, with values of 0 representing a low relative density and a value of 1 a high relative density.
Data describing the distribution of minke whales, humpback whales, blue whales and fin whales have been replaced by data from Fisheries and Oceans Canada describing the distribution of these four whale species within the St. Lawrence during the 2023 update of the assessment (Mosnier et al., 2022). The data is the result of a modeling exercise using sea and aerial sighting data between 1995 and 2017. The maps used present relative occurrence probabilities obtained from Generalized Additive Models (GAM) explicitly considering biases associated with sampling effort; the resulting data is considered the best representation currently available of the distribution of these four species of baleen whales within the estuary. Outliers were identified using the upper interquartile range multiplied by 3 (Tukey, 1977); the 95th percentile value was then assigned to these extreme values. The relative probabilities of occurrence were then normalized between 0 and 1. This normalization is done so as not to minimize the cumulative effects on these species compared to other marine mammal species whose values used vary between 0 and 1.
To complete this characterization of marine mammals, we used data from the Marine Mammal Observation Network [MMON; Réseau d’observation de mammifères marins (2021)] available on the St. Lawrence Global Observatory website (https://ogsl.ca/bio/?lg=en). This database is made up of marine mammal sightings recorded by member observers who have been trained by MMON; the sightings are reported by the public and systematically collected by the MMON team, which then validates these sightings. More information about the program is available on a dedicated page on the SLGO website.
This database contains nearly 50,000 marine mammal sightings of 21 different species between 1996 and 2021 (Réseau d’observation de mammifères marins, 2021). Of these, we selected data for the period from 2000 to 2021 for species not described in the guide that had more than 50 unique sightings. We applied the same methodology described for the guide to characterize the distribution of four additional species frequenting the St. Lawrence and Saguenay rivers: harbour porpoise (Phocoena phocoena), harbour seal (Phoca vitulina), harp seal (Phoca groenlandica) and grey seal (Halichoerus grypus; Table 4.19).
It is important to note that the resulting distribution maps for these species are not informed by a process and amount of data similar to what was used to create the marine industry guide (Le WWF-Canada et le Réseau d’observation de mammifères marins, 2021a). As with the maps created from Guide data, the resulting values can be interpreted as the relative density of marine mammal sightings, with values of 0 representing a low relative density and a value of 1 a high relative density. An additional caveat must also accompany these data:
- A lack of data in a sector must not be interpreted as an absence of marine mammals. There are currently no data available on marine mammal traffic for some sectors and some periods of the year.
| Species | Scientific names |
|---|---|
| Blue whale | Balaenoptera musculus |
| Fin whale | Balaenoptera physalus |
| Harbour porpoise | Phocoena phocoena |
| Humpback whale | Megaptera novaeangliae |
| Minke whale | Balaenoptera acutorostrata |
| St. Lawrence beluga whale | Delphinapterus leucas |
| Grey seal | Halichoerus grypus |
| Harbor seal | Phoca vitulina |
| Harp seal | Phoca groenlandica |
4.3.3.1 Whales
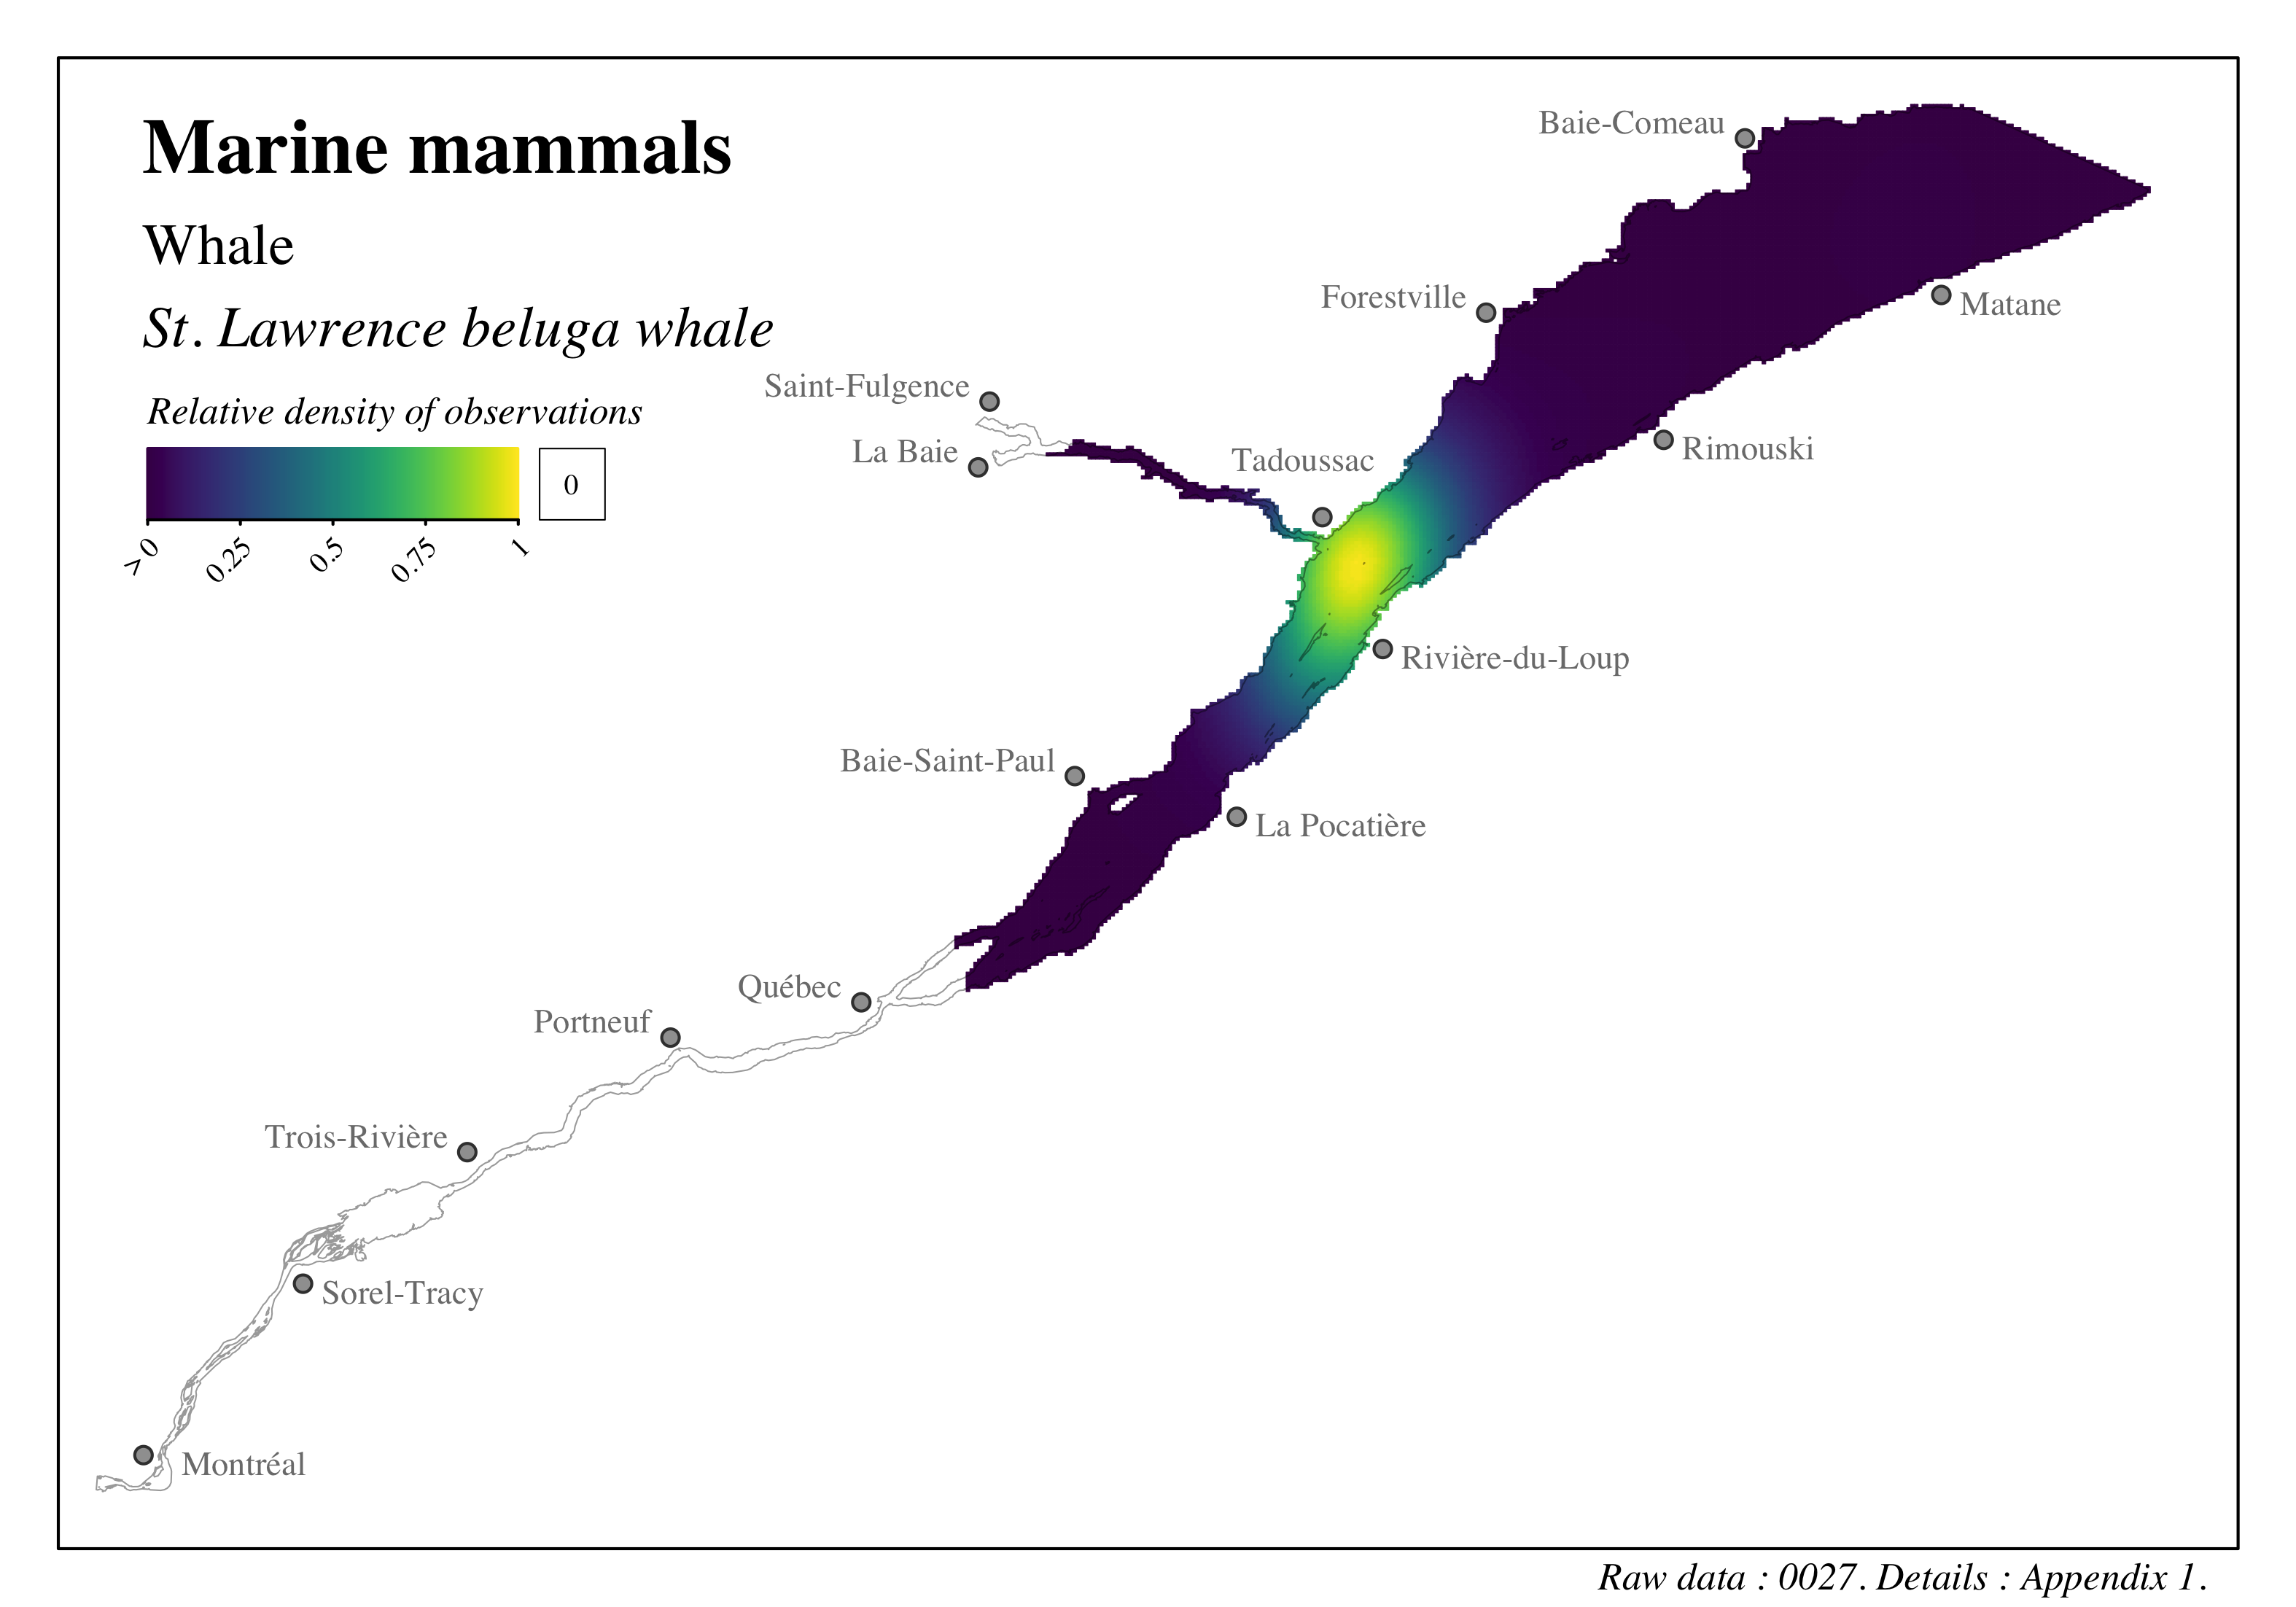
Figure 4.58: Distribution of marine mammals in the St. Lawrence and the Saguenay river - Beluga

Figure 4.59: Distribution of marine mammals in the St. Lawrence and the Saguenay river - Harbour porpoise
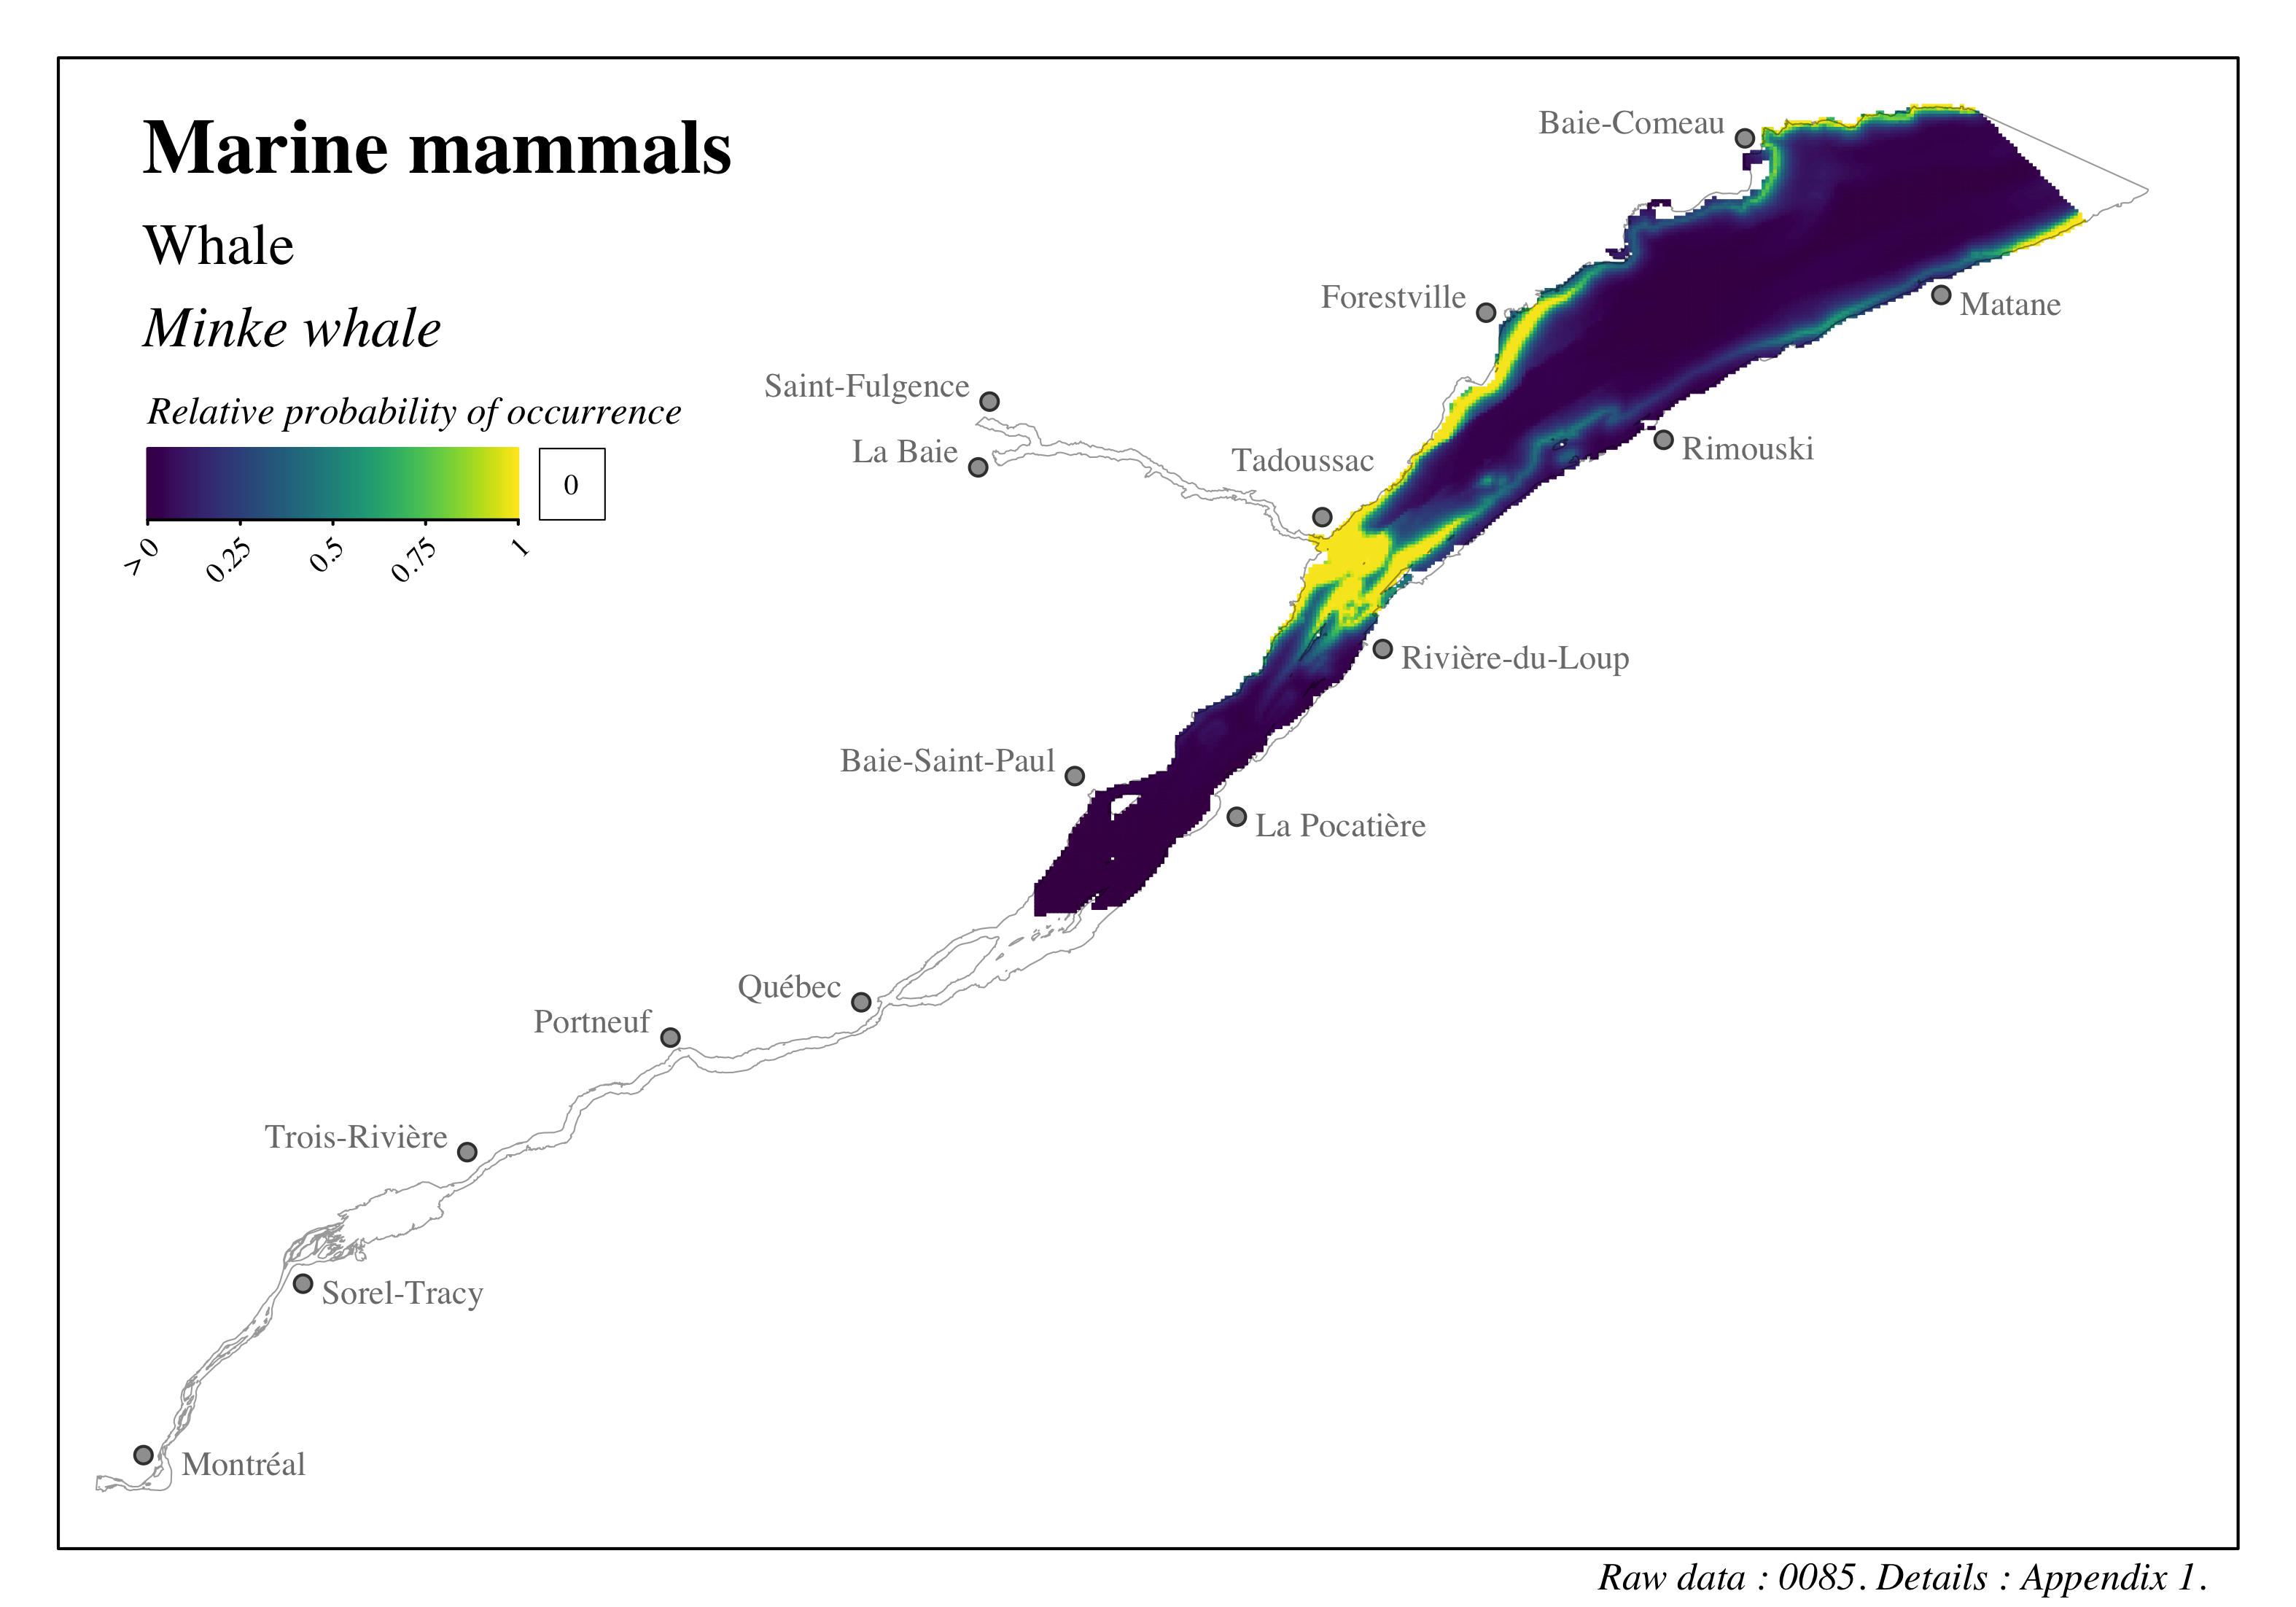
Figure 4.60: Distribution of marine mammals in the St. Lawrence and the Saguenay river - Minke whale
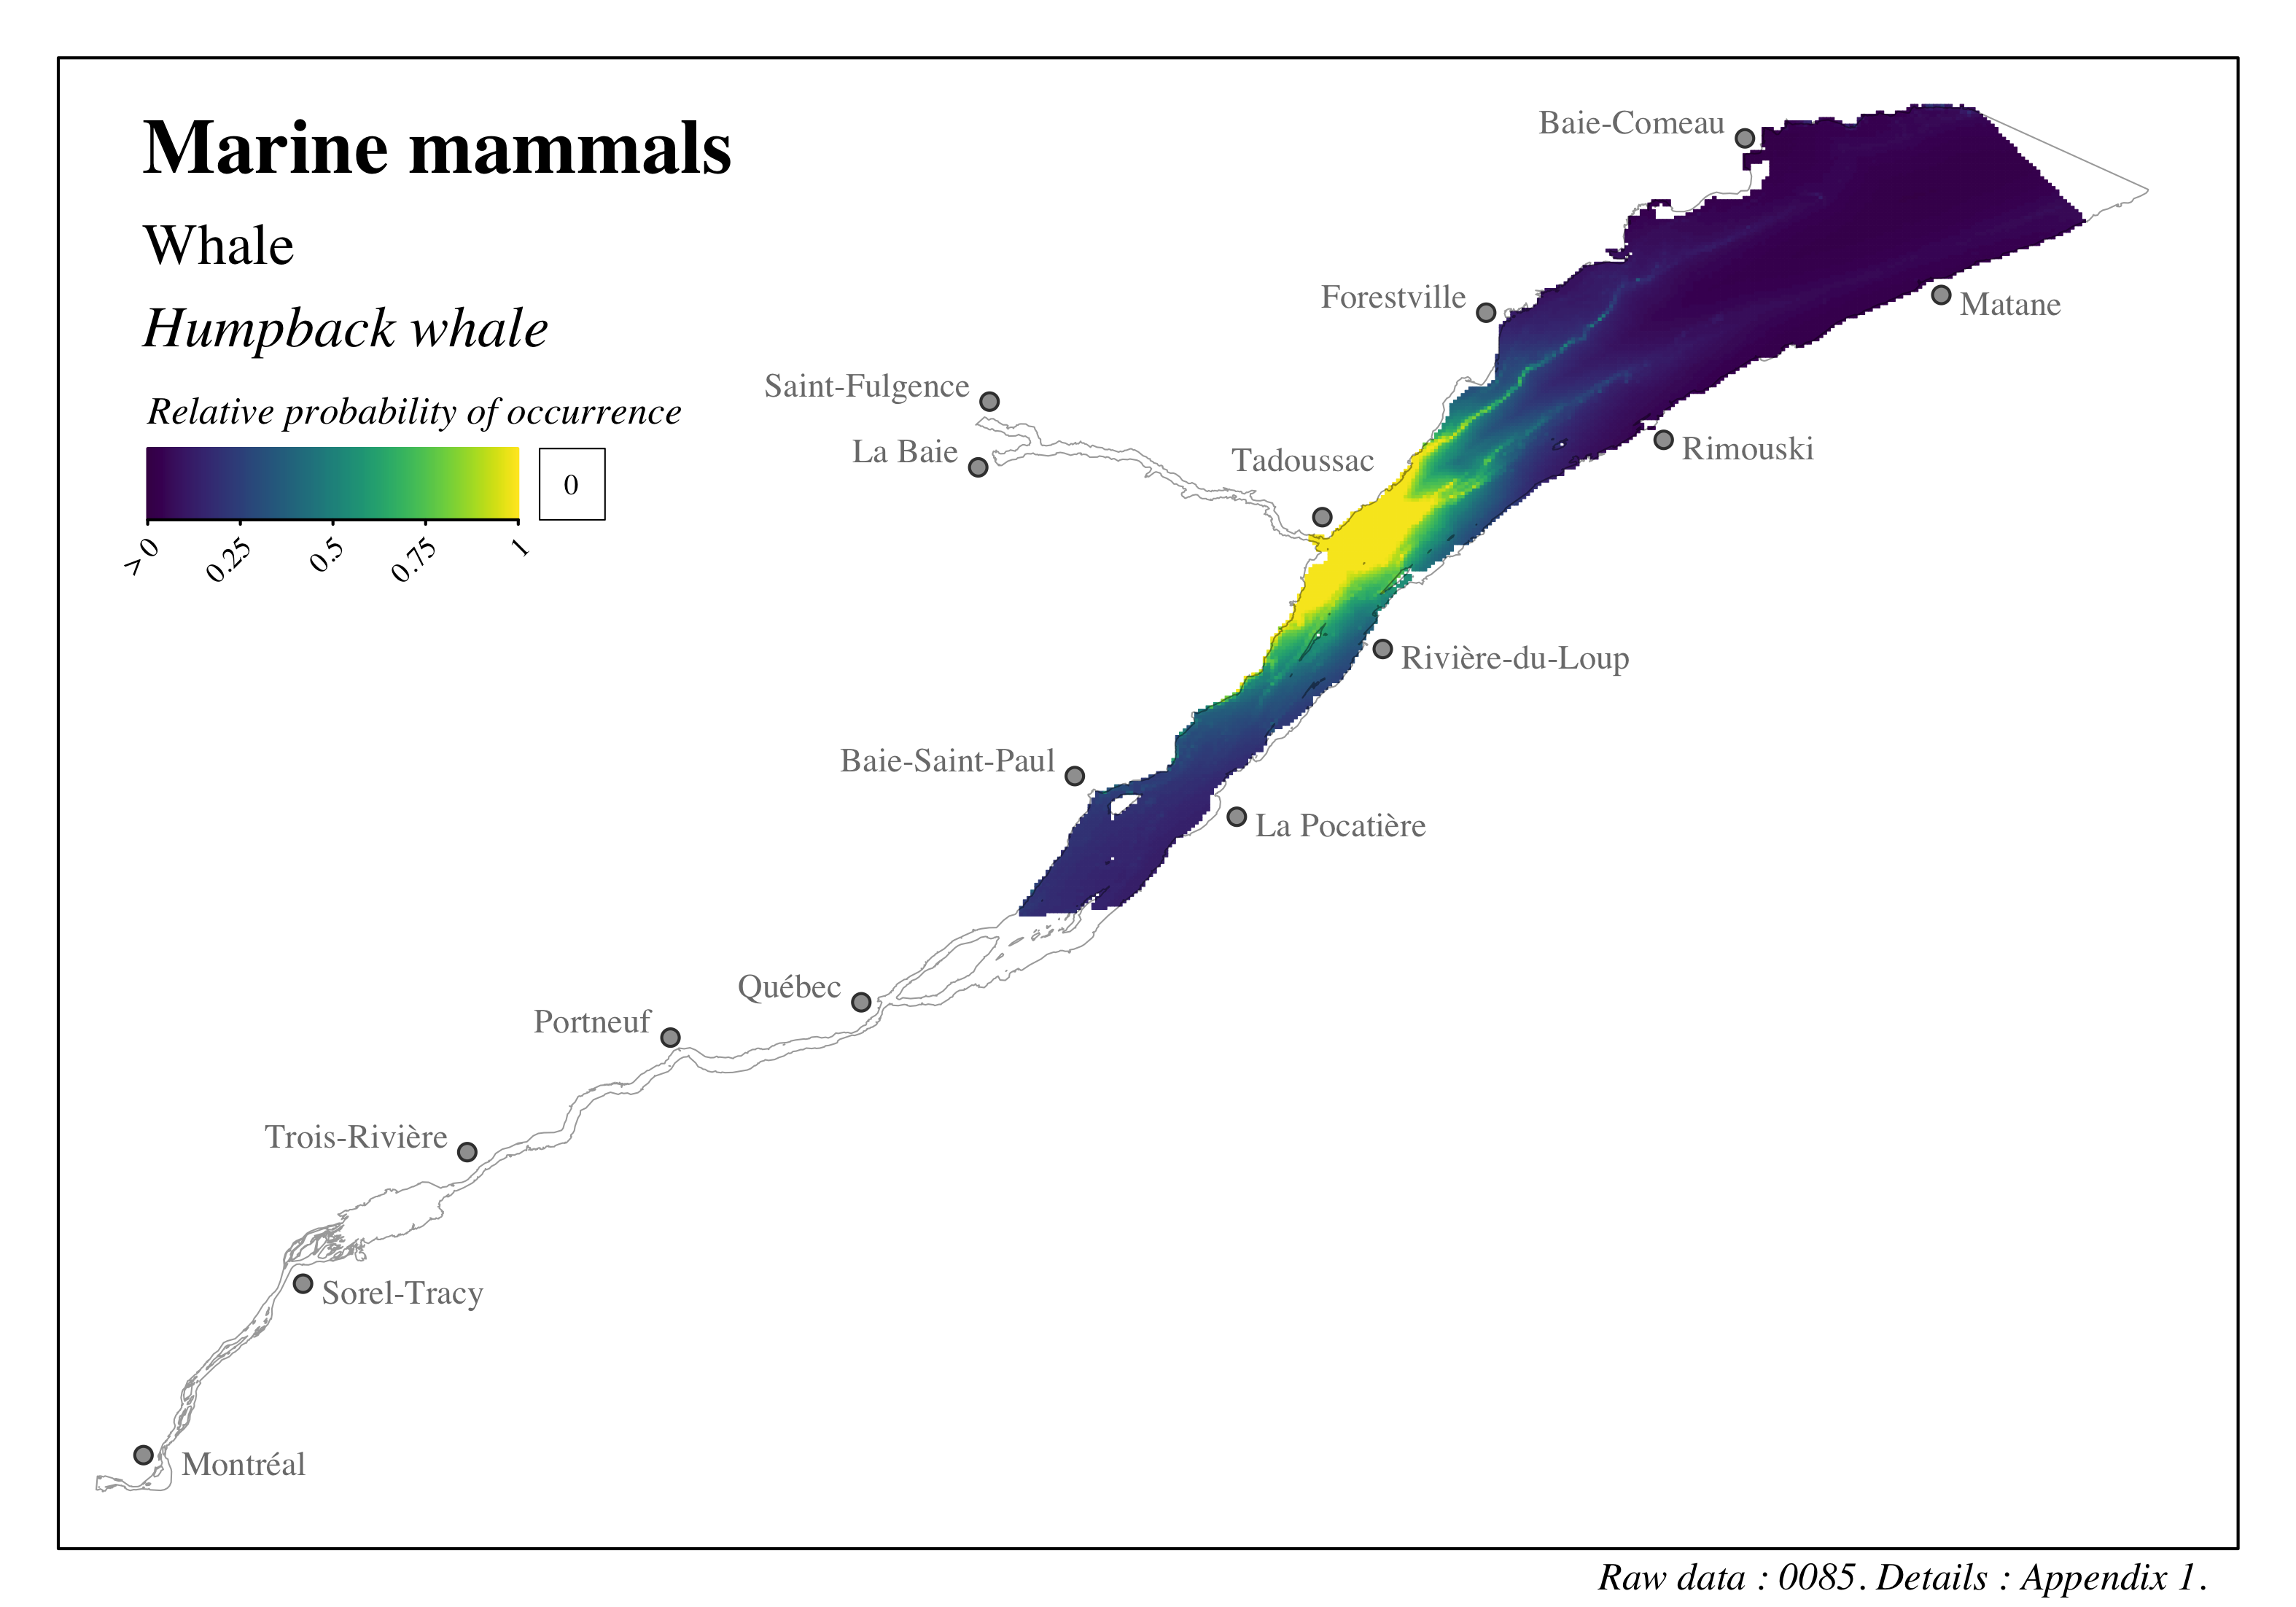
Figure 4.61: Distribution of marine mammals in the St. Lawrence and the Saguenay river - Humpback whale
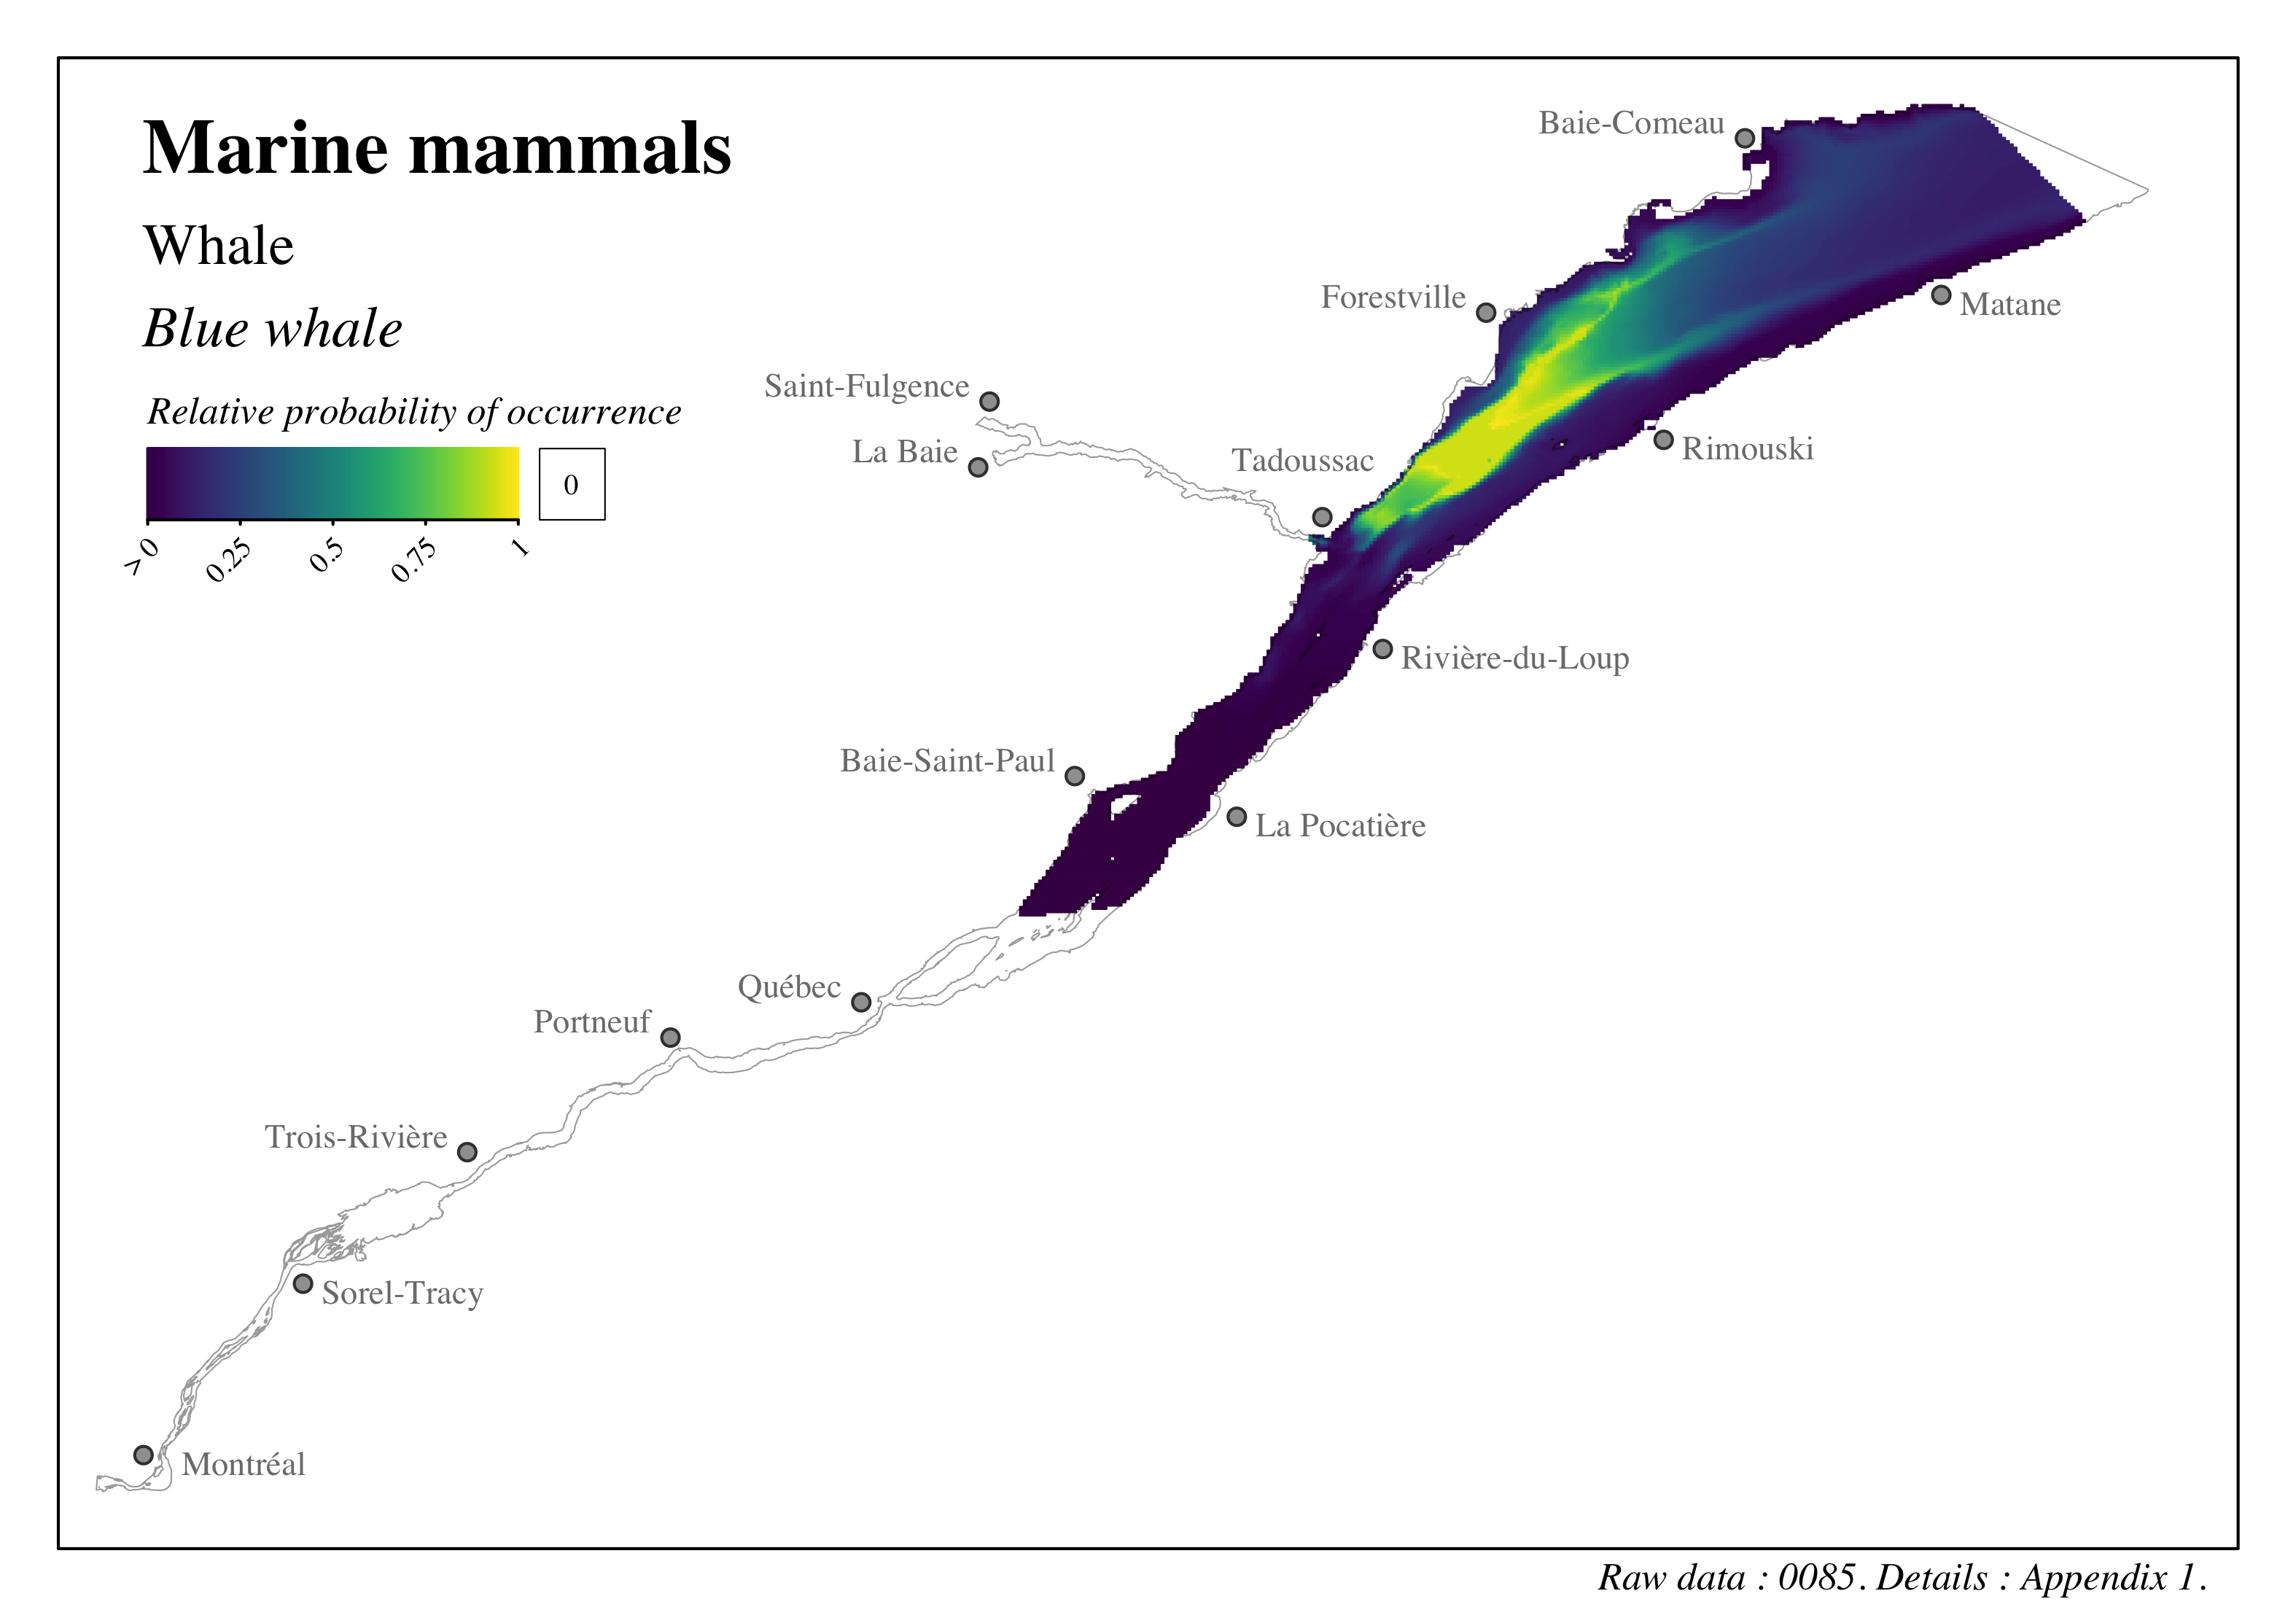
Figure 4.62: Distribution of marine mammals in the St. Lawrence and the Saguenay river - Blue whale
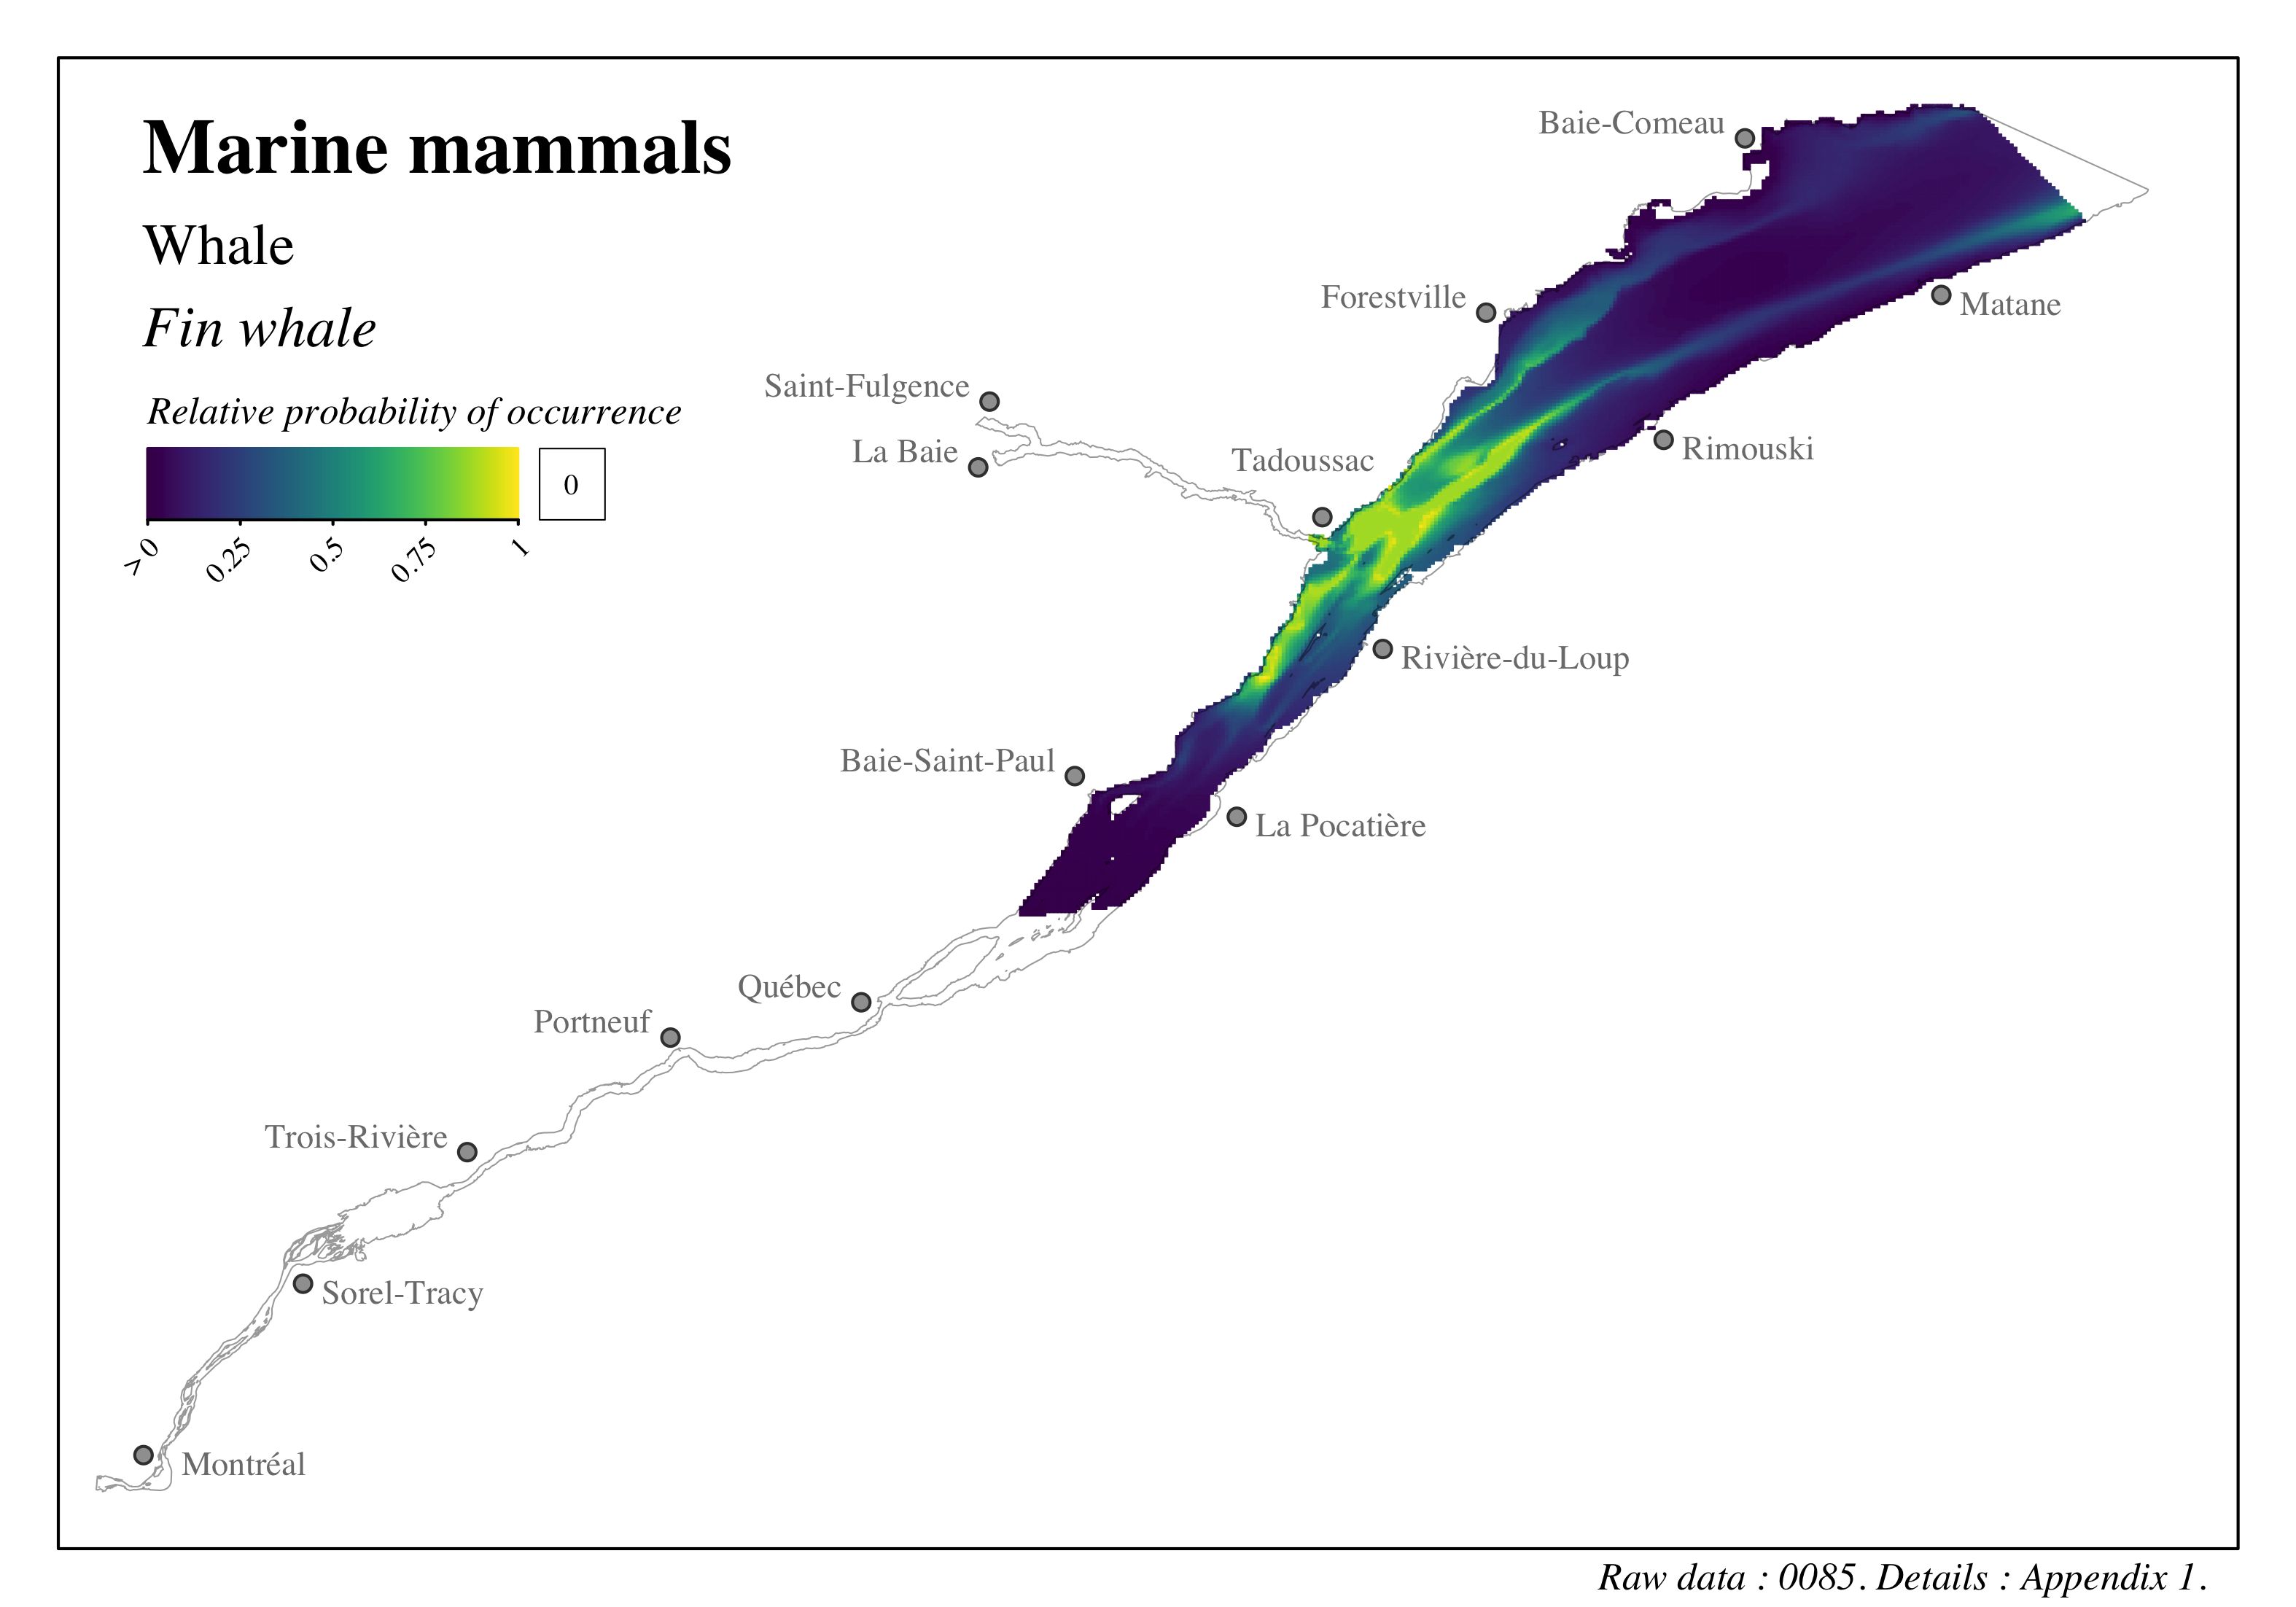
Figure 4.63: Distribution of marine mammals in the St. Lawrence and the Saguenay river - Fin whale
4.3.3.2 Seals
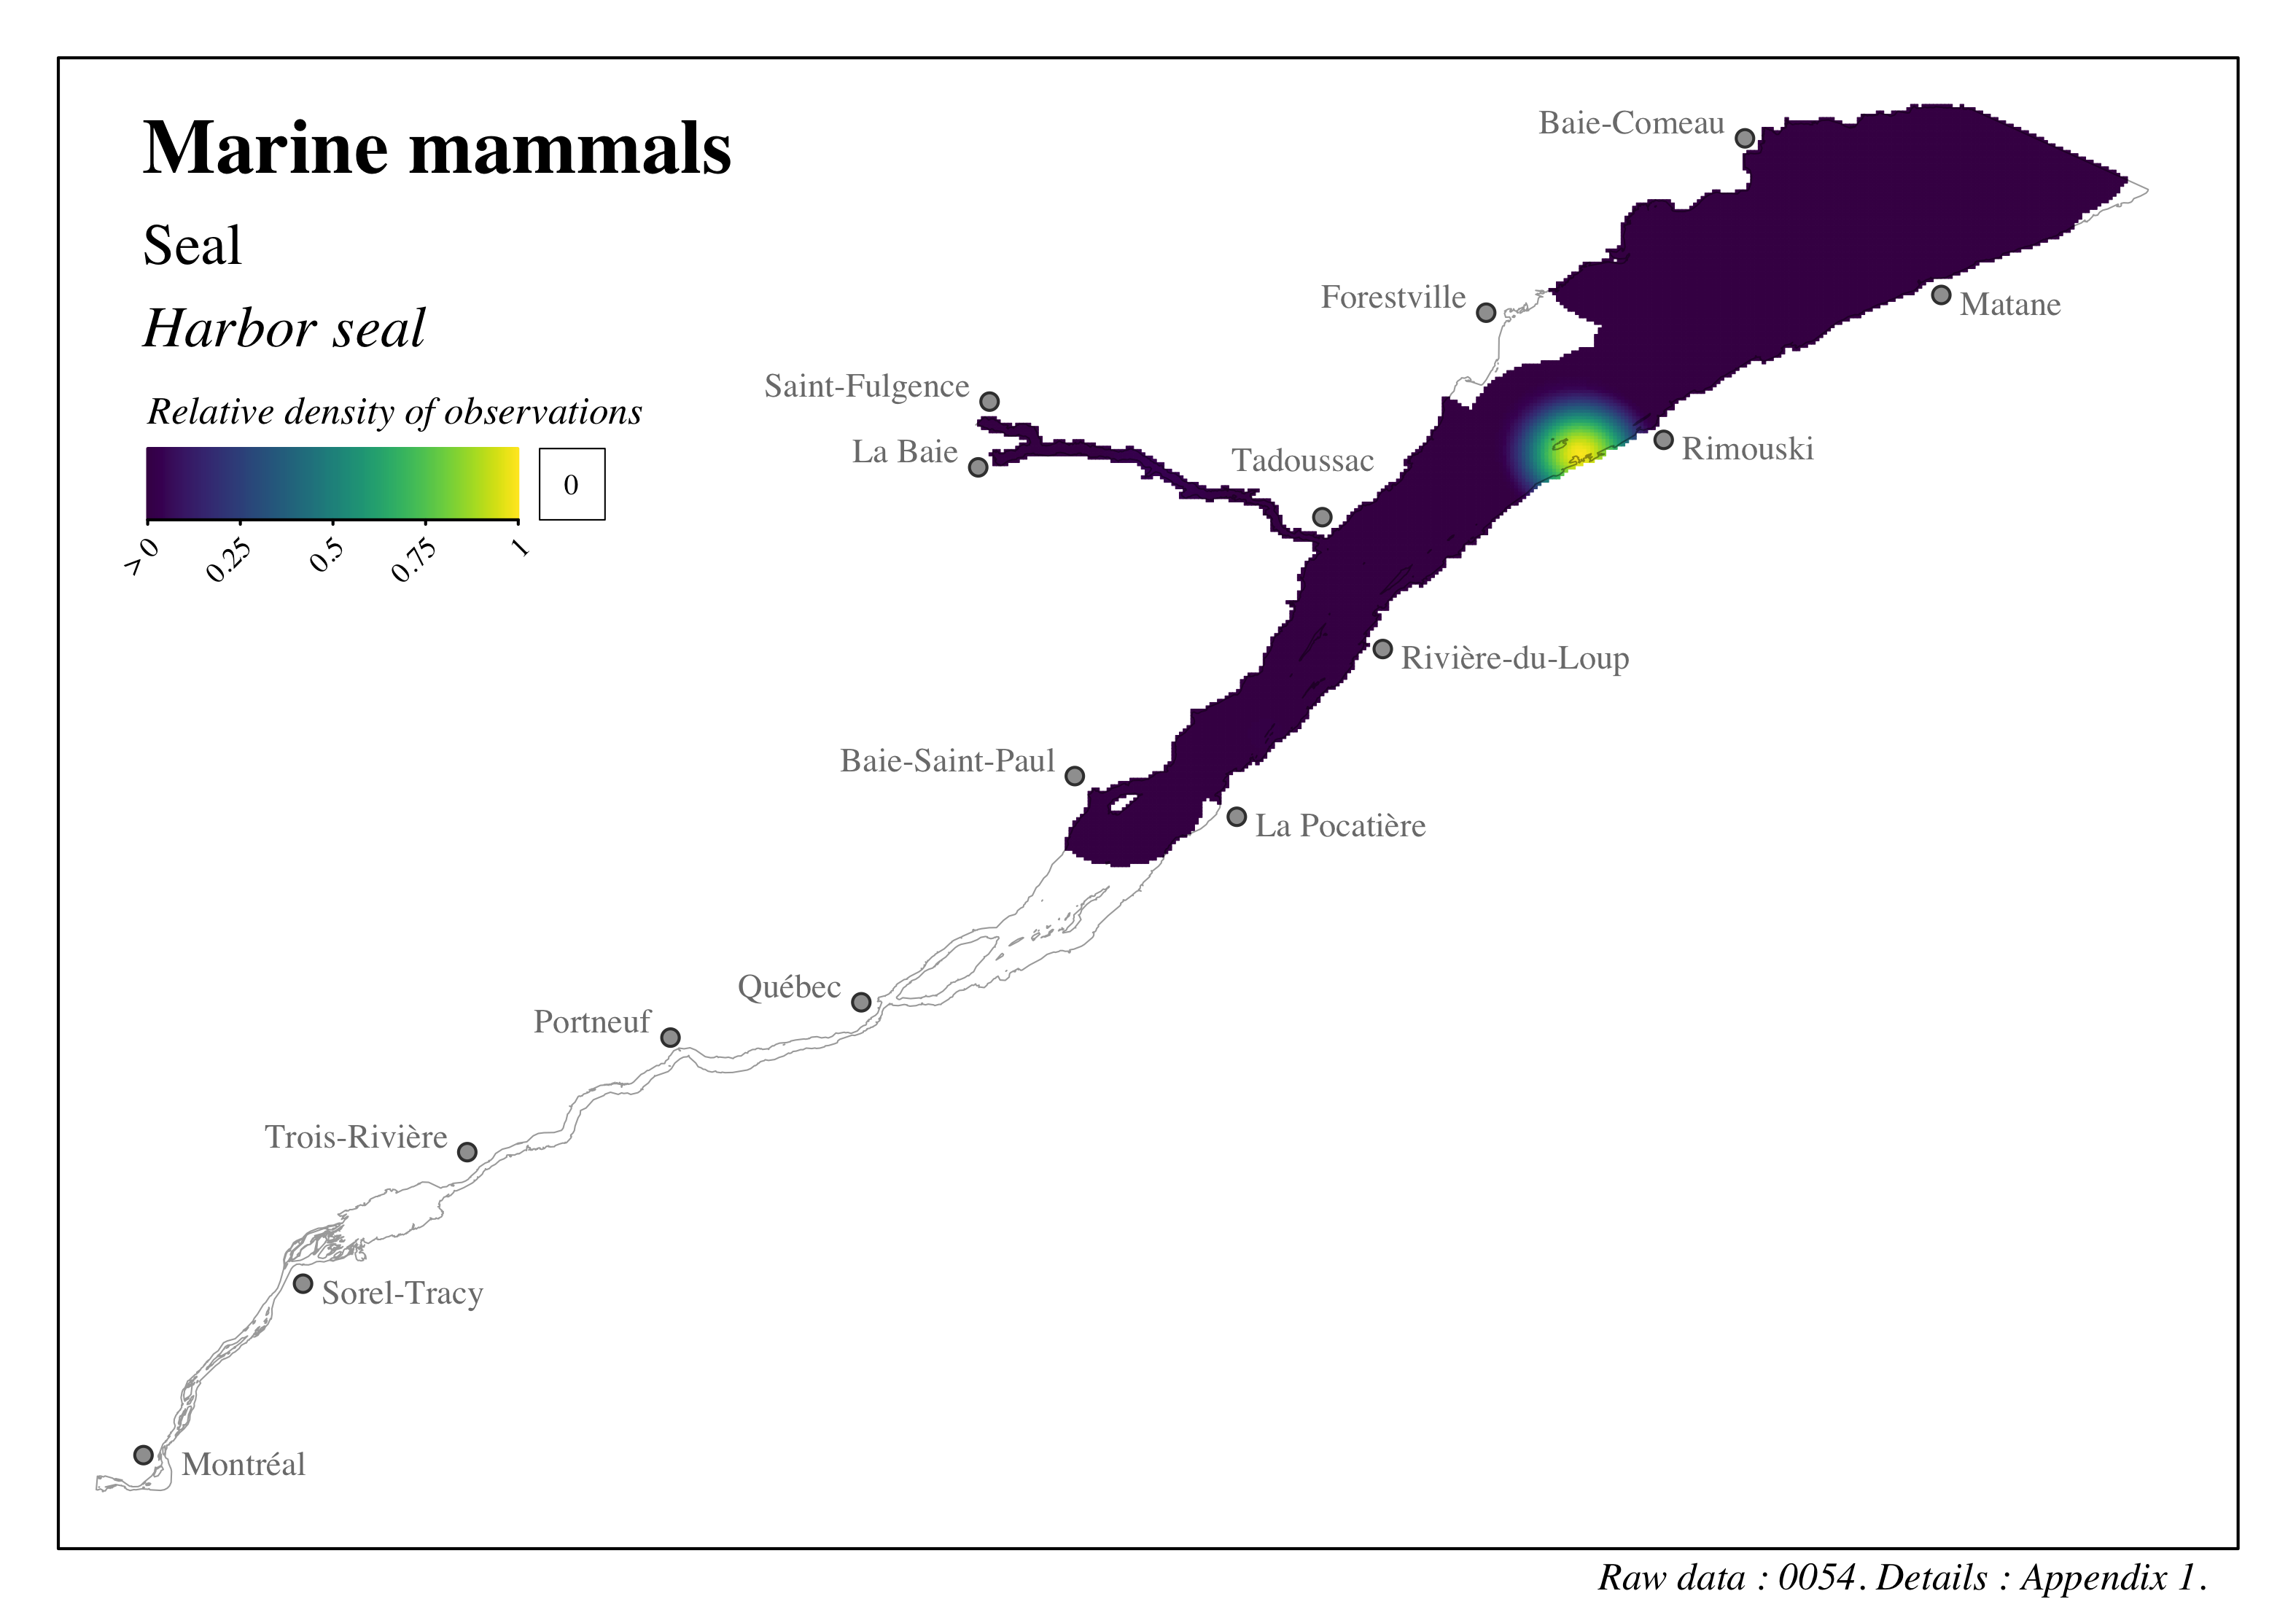
Figure 4.64: Distribution of marine mammals in the St. Lawrence and the Saguenay river - Harbor seal
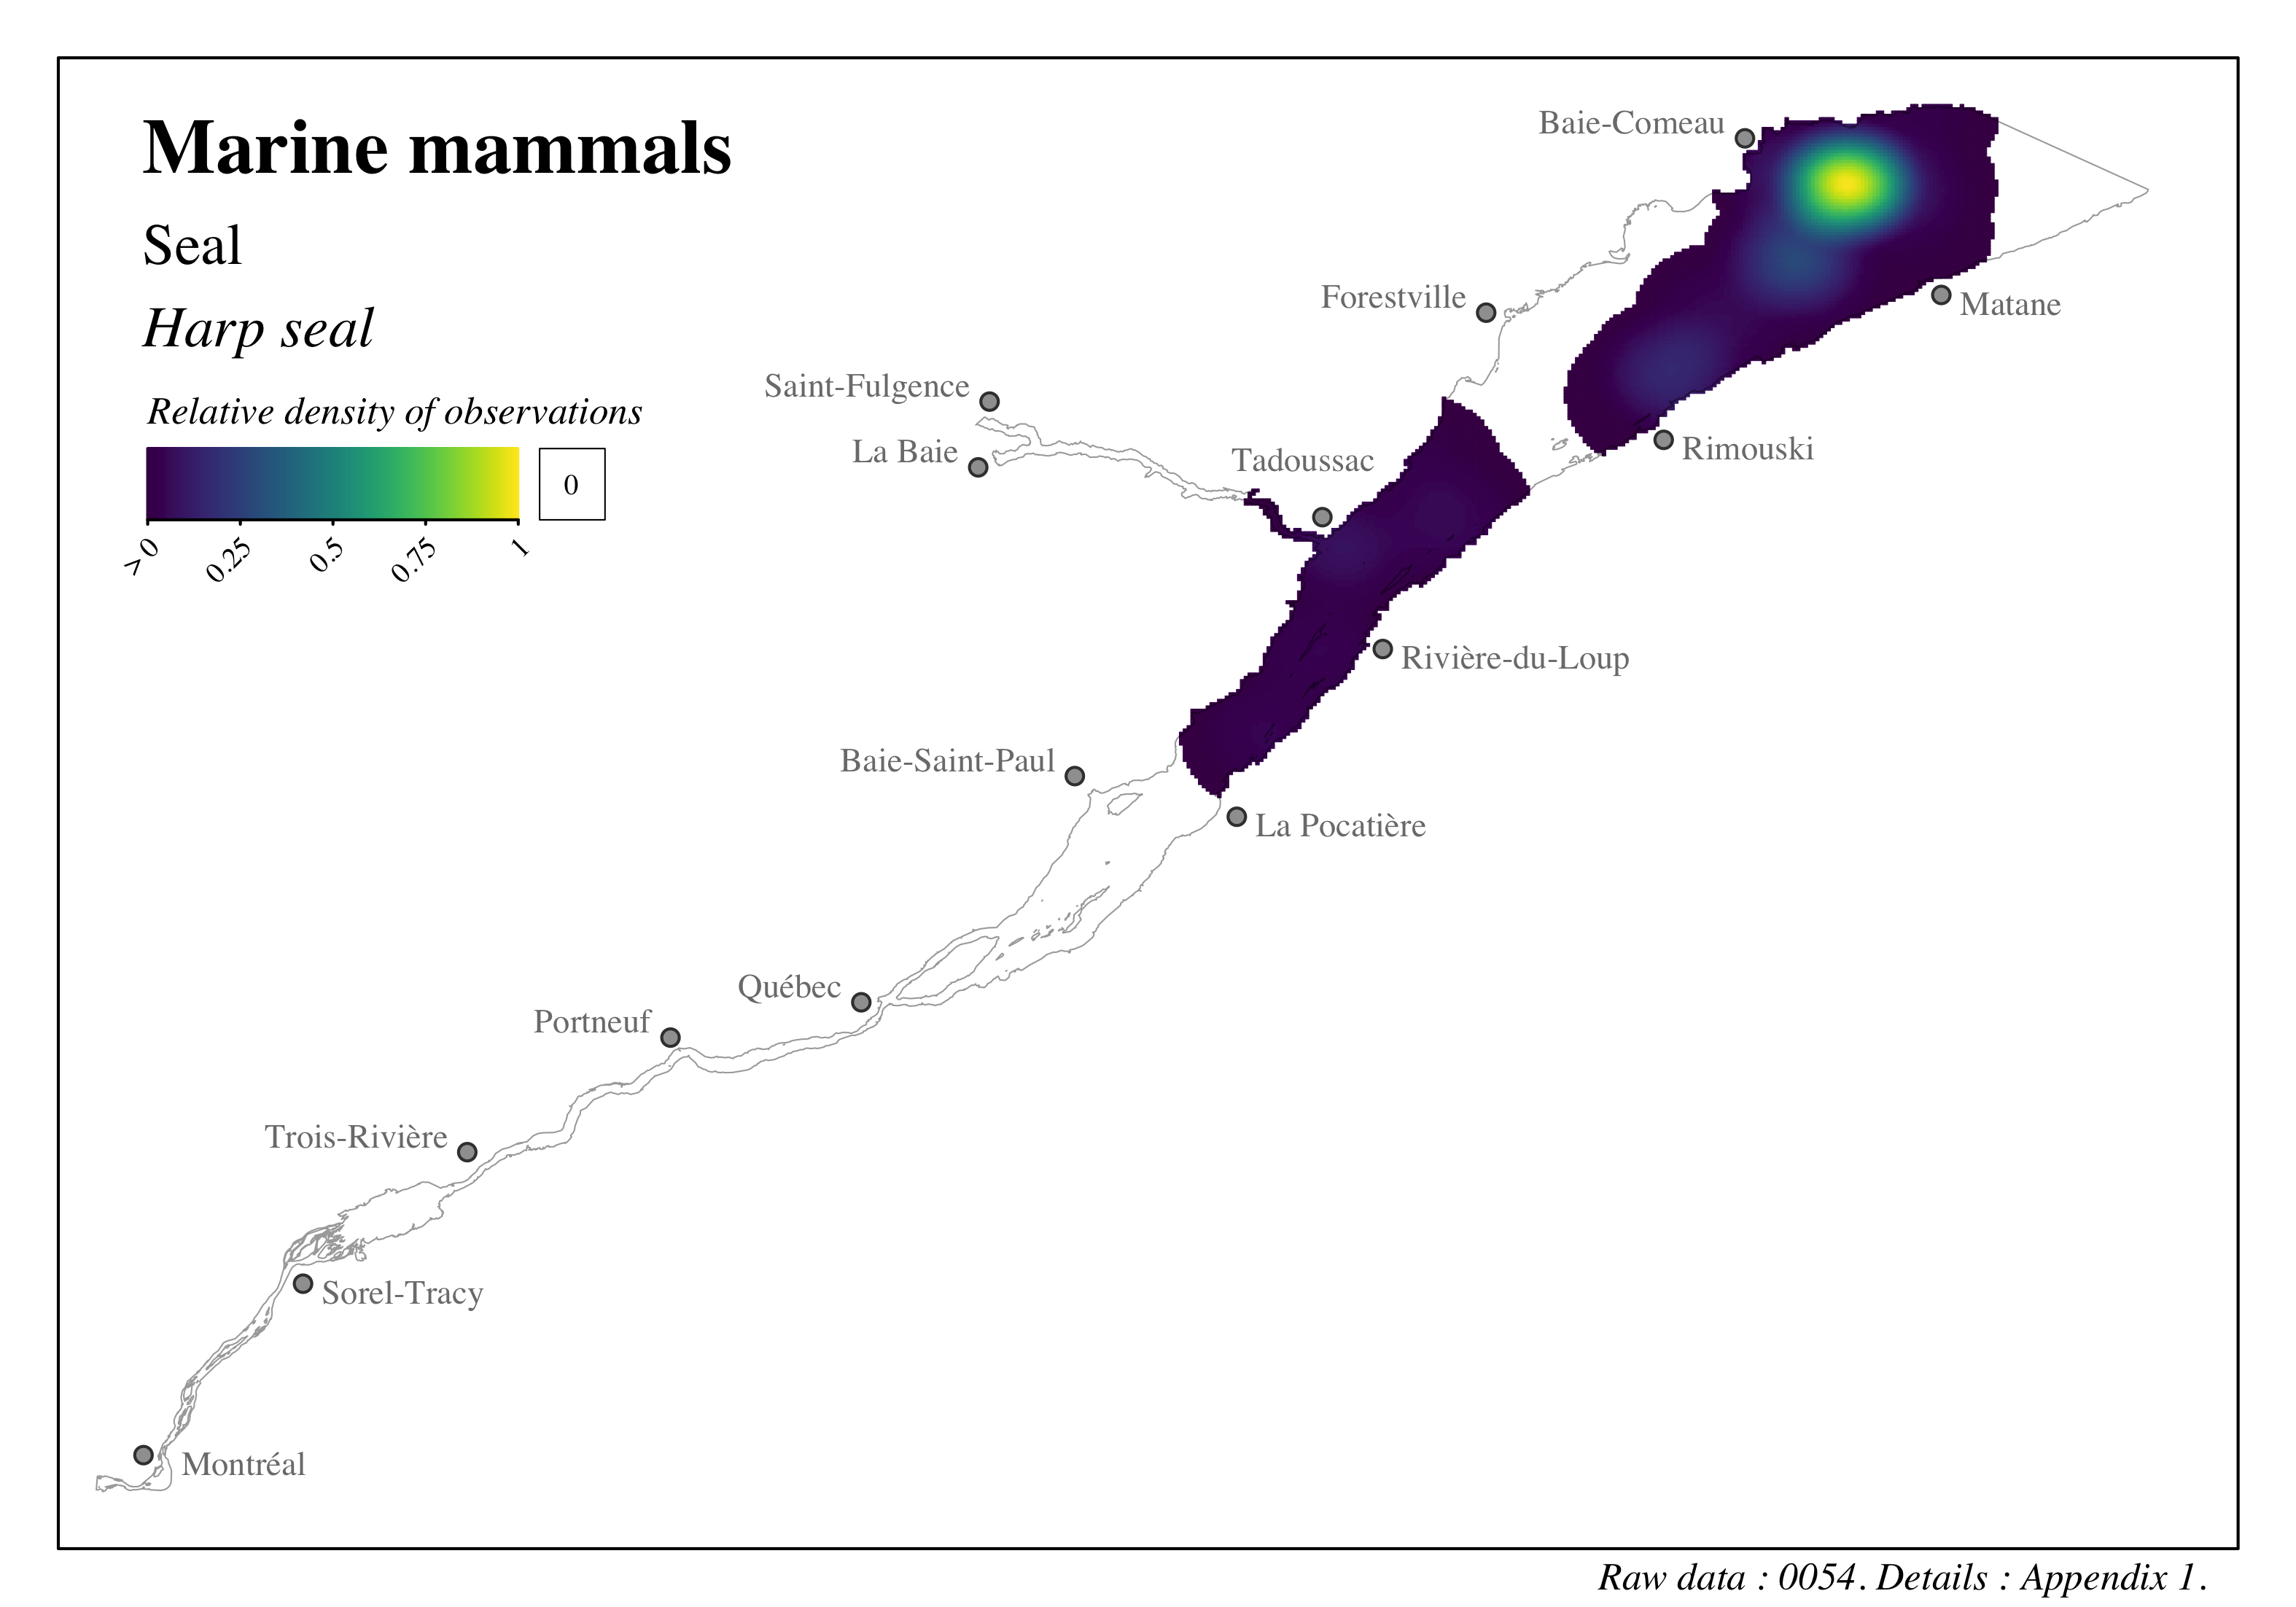
Figure 4.65: Distribution of marine mammals in the St. Lawrence and the Saguenay river - Harp seal
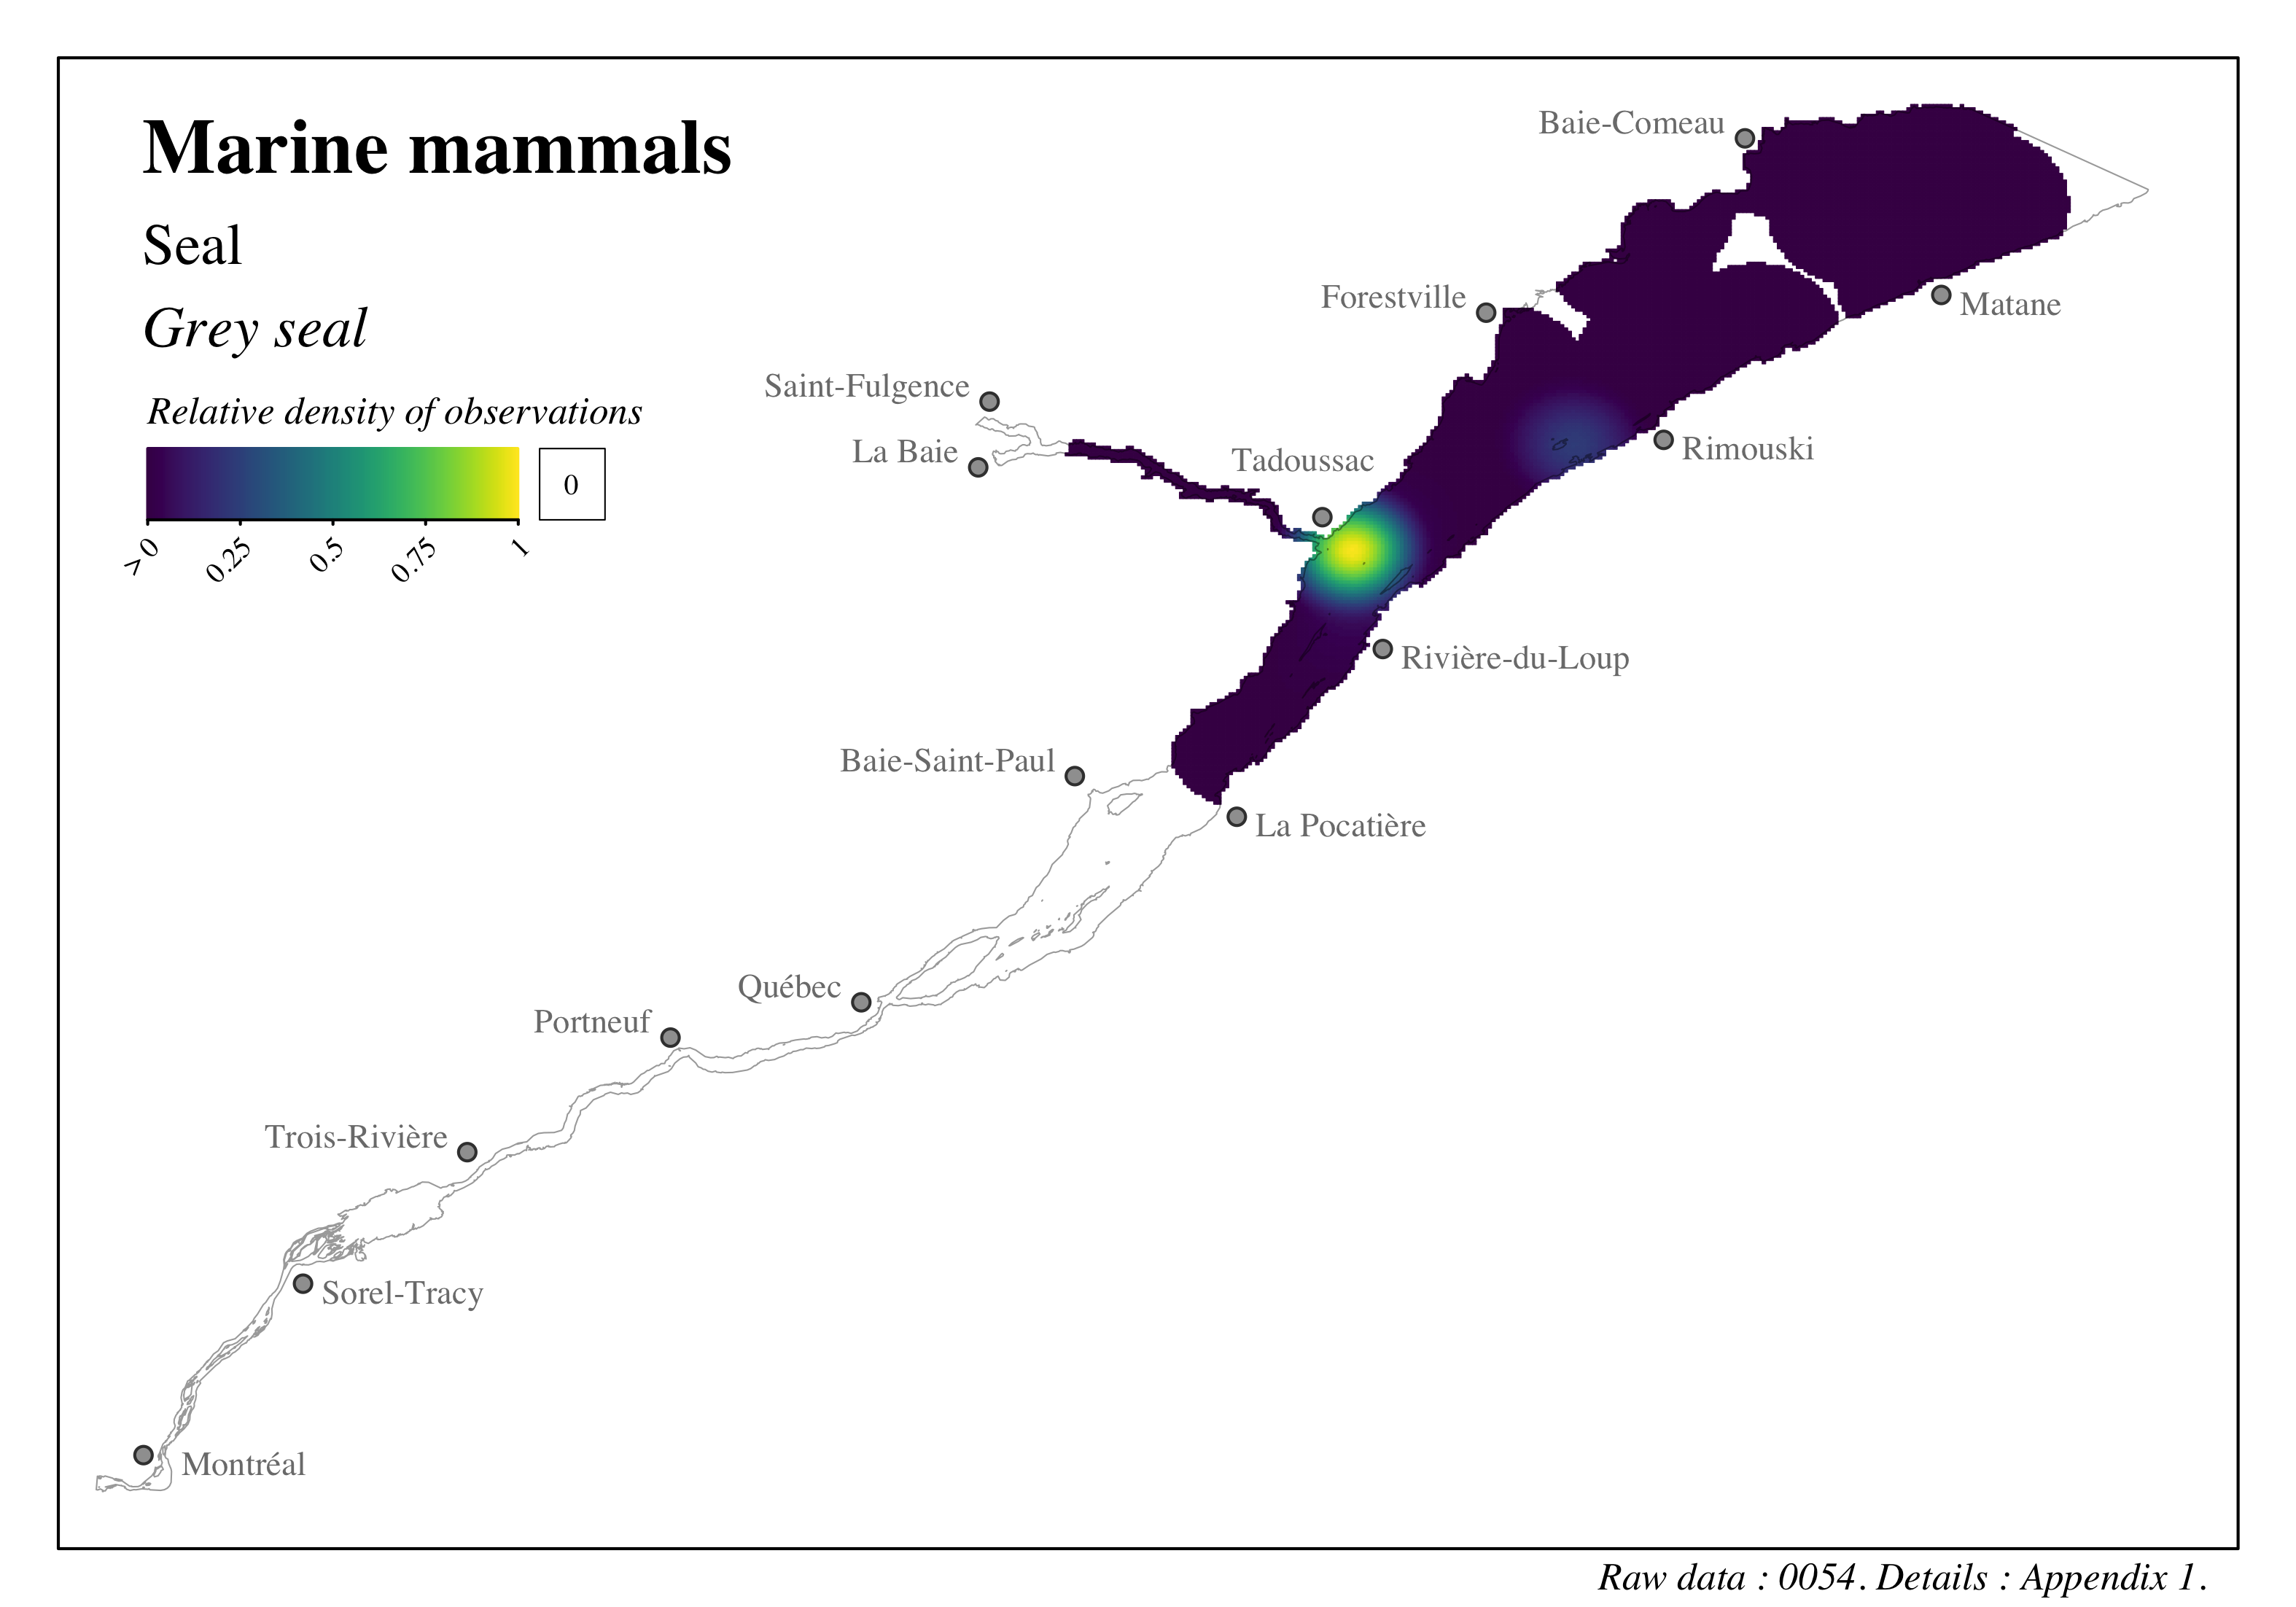
Figure 4.66: Distribution of marine mammals in the St. Lawrence and the Saguenay river - Grey seal
4.3.4 Water quality
Water quality was identified as a valued component in the various engagement workshops for identifying valued components. However, water quality is affected by a suite of multiple factors including agriculture, air pollution, and sewage discharge (Sasakova et al., 2018). In the fluvial sector, water quality appears to be affected primarily by land use; proximity to a large city or agriculture directly impact water quality (Vigil, 2003). Water quality is also greatly affected by the large amount of farmland draining into Lake St. Pierre(Goyette et al., 2016; Hudon and Carignan, 2008). Marine vessel activities are generally not cited as a significant potential source of pollution affecting water quality (Butts and Shackleford, 1992).
While water quality remains a valid concern, it is difficult to link water quality measures specifically to marine vessel activities. As such, we consider that a characterization of water quality as part of a sectoral cumulative effects assessment focused on marine vessel activities would likely risk inappropriately assigning responsibility to a sector of activity. To address this issue, we decided instead to adopt an alternative approach to consider the risks to water quality associated with marine vessel activities. The authors of the study Halpern et al. (2019) considered water quality as a marine pollution stressor instead. This stressor was described by combining the various individual stressors related to marine vessel activities, i.e. shipping and port activities in their case. We have thus opted for a similar approach and consider marine pollution as an environmental stressor, replacing the water quality valued component. Please refer to the section on environmental stressors for a description of the marine pollution stressor.
4.3.5 Areas of cultural, heritage and archeological interest
The St. Lawrence and Saguenay rivers constitute a system of major cultural, heritage and archeological importance for the First Nations and the coastal communities. Areas of cultural, heritage and archeological interest were therefore identified as a valued component to be considered in the pilot project to assess the cumulative effects of marine vessel activities. The areas of interest characterized are mainly provided by the First Nations, as well as heritage sites listed in public registers and protected areas in the region. This results in a total of 44 distinct categories of areas of interest (Table 4.20). Data characterizing the areas of interest were incorporated directly into the study grid as presence-absence. The following sections describe the data used to develop a profile of cultural, heritage and archeological areas of interest in the study area.
| Areas of interest | Categories |
|---|---|
| Mi’kmaq and Maliseet Aboriginal Fisheries Management Association | Commercial fishing |
| Traditional fishing | |
| Huron-Wendat Nation | Ritual or social activities |
| Archeology | |
| Hunting | |
| Species at risk | |
| History | |
| Land use | |
| Fishing | |
| Harvesting of vegetation | |
| Toponymy | |
| Mohawk Nation of Kahnawà:ke | Waterfowl hunting |
| Culture and heritage | |
| Shipping | |
| Shoreline fishing | |
| Open water fishing | |
| Harvesting of vegetation | |
| Seigneurie du Sault-Saint-Louis | |
| W8banaki Nation | Game hunting |
| Migratory bird hunting | |
| Picking and gathering vegetation | |
| Shipping | |
| Access to territory problems | |
| Fishing | |
| Archeological sites | |
| Cultural sites | |
| Overnight sites | |
| Essential sites | |
| Sites with archeological potential | |
| Fur trapping | |
| Activity areas | |
| Wolastoqiyik Wahsipekuk Nation | Port development |
| Beluga whale watching | |
| Commercial fishing | |
| Innu Nation of Essipit | Access to the waterbody |
| Tourist activities | |
| Migratory bird hunting | |
| Seal hunting | |
| Culture and heritage | |
| Commercial fishing | |
| Traditional fishing | |
| Public | Protected areas |
| Heritage sites | |
| Shipwrecks |
4.3.5.1 Areas of interest to First Nations
In this pilot project, particular importance was assigned to areas of interest to First Nations. Marine vessel activities may affect the conditions that underlie the exercise of First Nations’ Indigenous rights, especially in terms of access to resources and the land. A collaborative process was therefore initiated with Indigenous nations who conduct activities in the study area now or have done in the past. The following participating Indigenous Nations provided data
- Huron-Wendat Nation
- Innu Nation of Essipit
- Mohawk Nation of Kahnawà:ke
- Wolastoqiyik Wahsipekuk Nation
- W8banaki Nation
An information sharing protocol was developed in cooperation with the participating First Nations. This protocol provides a framework for data use that supports First Nations OCAP principles in research: PCAP\(^{MD}\) (Ownership, Control, Access, Possession). Applying these principles serves to protect First Nations’ information and knowledge assets. These principles state that a community, a nation, or a group owns information collectively. These principles apply to all types and fields of research conducted on First Nations lands and/or that concern First Nations.
One-on-one meetings were held with representatives of participating First Nations to present the project and discuss the needs for information in order to incorporate the areas of interest into the cumulative effects assessment. The participating First Nations subsequently proceeded to gather cartographic and non-cartographic information representing their respective Nations’ areas of interest. Our research team therefore did not collect any data; this work was carried out by the participating First Nations, who subsequently sent us data designating areas of interest to be considered in the cumulative effects assessment of marine vessel activities.
An open access cartographic atlas developed by the Mi’kmaq and Maliseet Aboriginal Fisheries Management Association [MMAFMA; Arsenault et al. (2017)] also provided land use data for the Gespeg Mi’kmaq, Gesgapegiag Mi’kmaq and Wolastoqiyik Wahsipekuk Nations.
The areas of interest are generally identified through exercises to integrate knowledge from other studies conducted with First Nations members. The areas of interest identified by the participating First Nations can be broadly classified into 9 main categories:
- Ritual or social activities
- Hunting
- Culture and heritage
- Land use
- Commercial fishing
- Traditional fishing
- Harvesting of vegetation
- Archeological sites
- Tourism
The areas of interest identified by the Nations have been kept separate rather than integrated into a single layer by broad area of interest category, despite Nations identifying similar categories. For example, although most Nations identified areas of interest for hunting, the areas identified by individual First Nations remained separate for the cumulative effects assessment. This approach is intended to respect the independence of each Nation and to assign greater importance to an environment if it is identified by more than one Nation. This is the case of Lake St. Pierre, among other areas, which is identified as an area of interest by more than one participating Nation.
Each Nation organized and categorized its own areas of interest; these categories have been kept as reported despite similarities between the categories having been identified among the participating First Nations. There has been no attempt to harmonize categories among the First Nations. This choice was made in order to avoid distorting the information transmitted by the Nations. In addition, since the areas identified by the various Nations remain separate for the assessment, harmonizing the categories of areas of interest would not have affected the assessment. We thus decided to keep the wording used in the data transmitted.
There are a few points that must be kept in mind regarding areas of interest to First Nations. First, the information reported cannot be considered an exhaustive description of the areas of interest for all members of Indigenous Nations; the engagement process with the members of each Nation from which the information was derived was limited, and the information was integrated only in the context of the project assessing the cumulative effects of marine vessel activities. The areas of interest identified come from other studies whose data were integrated to meet the objectives of this study. In addition, not all First Nations with an area of interest in the study area were able to be involved in the project. For example, despite the areas of interest for the Wolastoqiyik Wahsipekuk Nation being included, a collaborative process similar to that carried out with the other Nations could not be established; the socio-cultural data of the Wolastoqiyik Wahsipekuk Nation could therefore not be included in our assessment. The characterization of the areas of interest cannot be deemed exhaustive for all the First Nations in the region being studied.
Second, the First Nations’ connection to place goes beyond a strictly utilitarian and functional perspective; this perspective is difficult to capture through a mapping of areas of interest, which has the effect of objectifying them. This means it is important to consider that the areas of interest identified are part of a broader cultural and ecological context as opposed to a mere geographical location.
Third, the concept of First Nations land use goes beyond mere use. Indeed, Indigenous customary activities are aboriginal rights protected by section 35(1) of the Canadian Constitution. The Constitution Act, 1982 affirms the existing aboriginal and treaty rights. However, most of these rights remain undefined and the Royal Proclamation of 1763 states that Aboriginal peoples continue to hold any lands they have not ceded or sold. It is therefore important to distinguish these food, ritual and social activities, which are protected by the Constitution and are linked to the Nation’s subsistence, from non-native fishing, hunting and trapping which are for sport and leisure.
Fourth, the spatio-temporal boundaries of the present study were raised as an important limitation in an Indigenous context since the study does not appropriately capture the evolving nature of their land occupation and use. The description of the areas of interest presented should not be interpreted as representative of the past or as a guarantee of the future.
Lastly, the First Nations’ participation in this study is without prejudice to the exercise of their legal rights in their respective traditional territories to which their stewardship rights and responsibilities apply and which are based on the application of a broader ecosystemic approach. This means that the identified areas of interest must be interpreted in the broader context of these rights and responsibilities.
The following sections briefly describe the data shared by the participating First Nations and the data accessible through open platforms.
4.3.5.1.1 Mi’kmaq and Maliseet Aboriginal Fisheries Management Association
We thank Lisa M. Arsenault for the discussions and support.
The unique identifiers given to the data presented in this section are: 0022, 0023. Refer to the following section and to Appendix 1 for more details on these data.
The Mi’kmaq and Maliseet Aboriginal Fisheries Management Association (MMAFMA) has developed a cartographic atlas describing various sites and uses related to commercial and traditional fishing that are of importance to the Gesgapegiag, Gespeg and Wolastoqiyik Wahsipekuk Nations (Arsenault et al., 2017). The Atlas describes commercial fishing targeting nine different species: whelk (Buccinum sp.), sea cucumber (Holothuria sp.), rock crab (Cancer irroratus), snow crab (Chionoecetes opilio), northern shrimp (Pandalus sp.), Atlantic halibut (Hippoglossus hippoglossus), Greenland halibut (Reinhardtius hippoglossoides), lobster (Homarus americanus), and sea urchin (Strongylocentrotus sp.) in the St. Lawrence Estuary (Arsenault et al., 2017; Racine and Arsenault, 2017). Since most of these fisheries are conducted by the Wolastoqiyik Wahsipekuk Nation, these data are used to describe that Nation’s commercial fisheries (see section 4.3.5.1.6). Since the Gespeg Mi’kmaq Nation also has a commercial northern shrimp fishery in the St. Lawrence Estuary, we selected this fishery from the Atlas data.
The Atlas also identifies the Rimouski, Métis and Matane rivers as sites of importance to Atlantic salmon fishing [Salmo salar; Arsenault et al. (2017)]. We added a 3 \(km\) buffer zone at the mouth of these three rivers to capture their presence as an area of interest for the assessment.
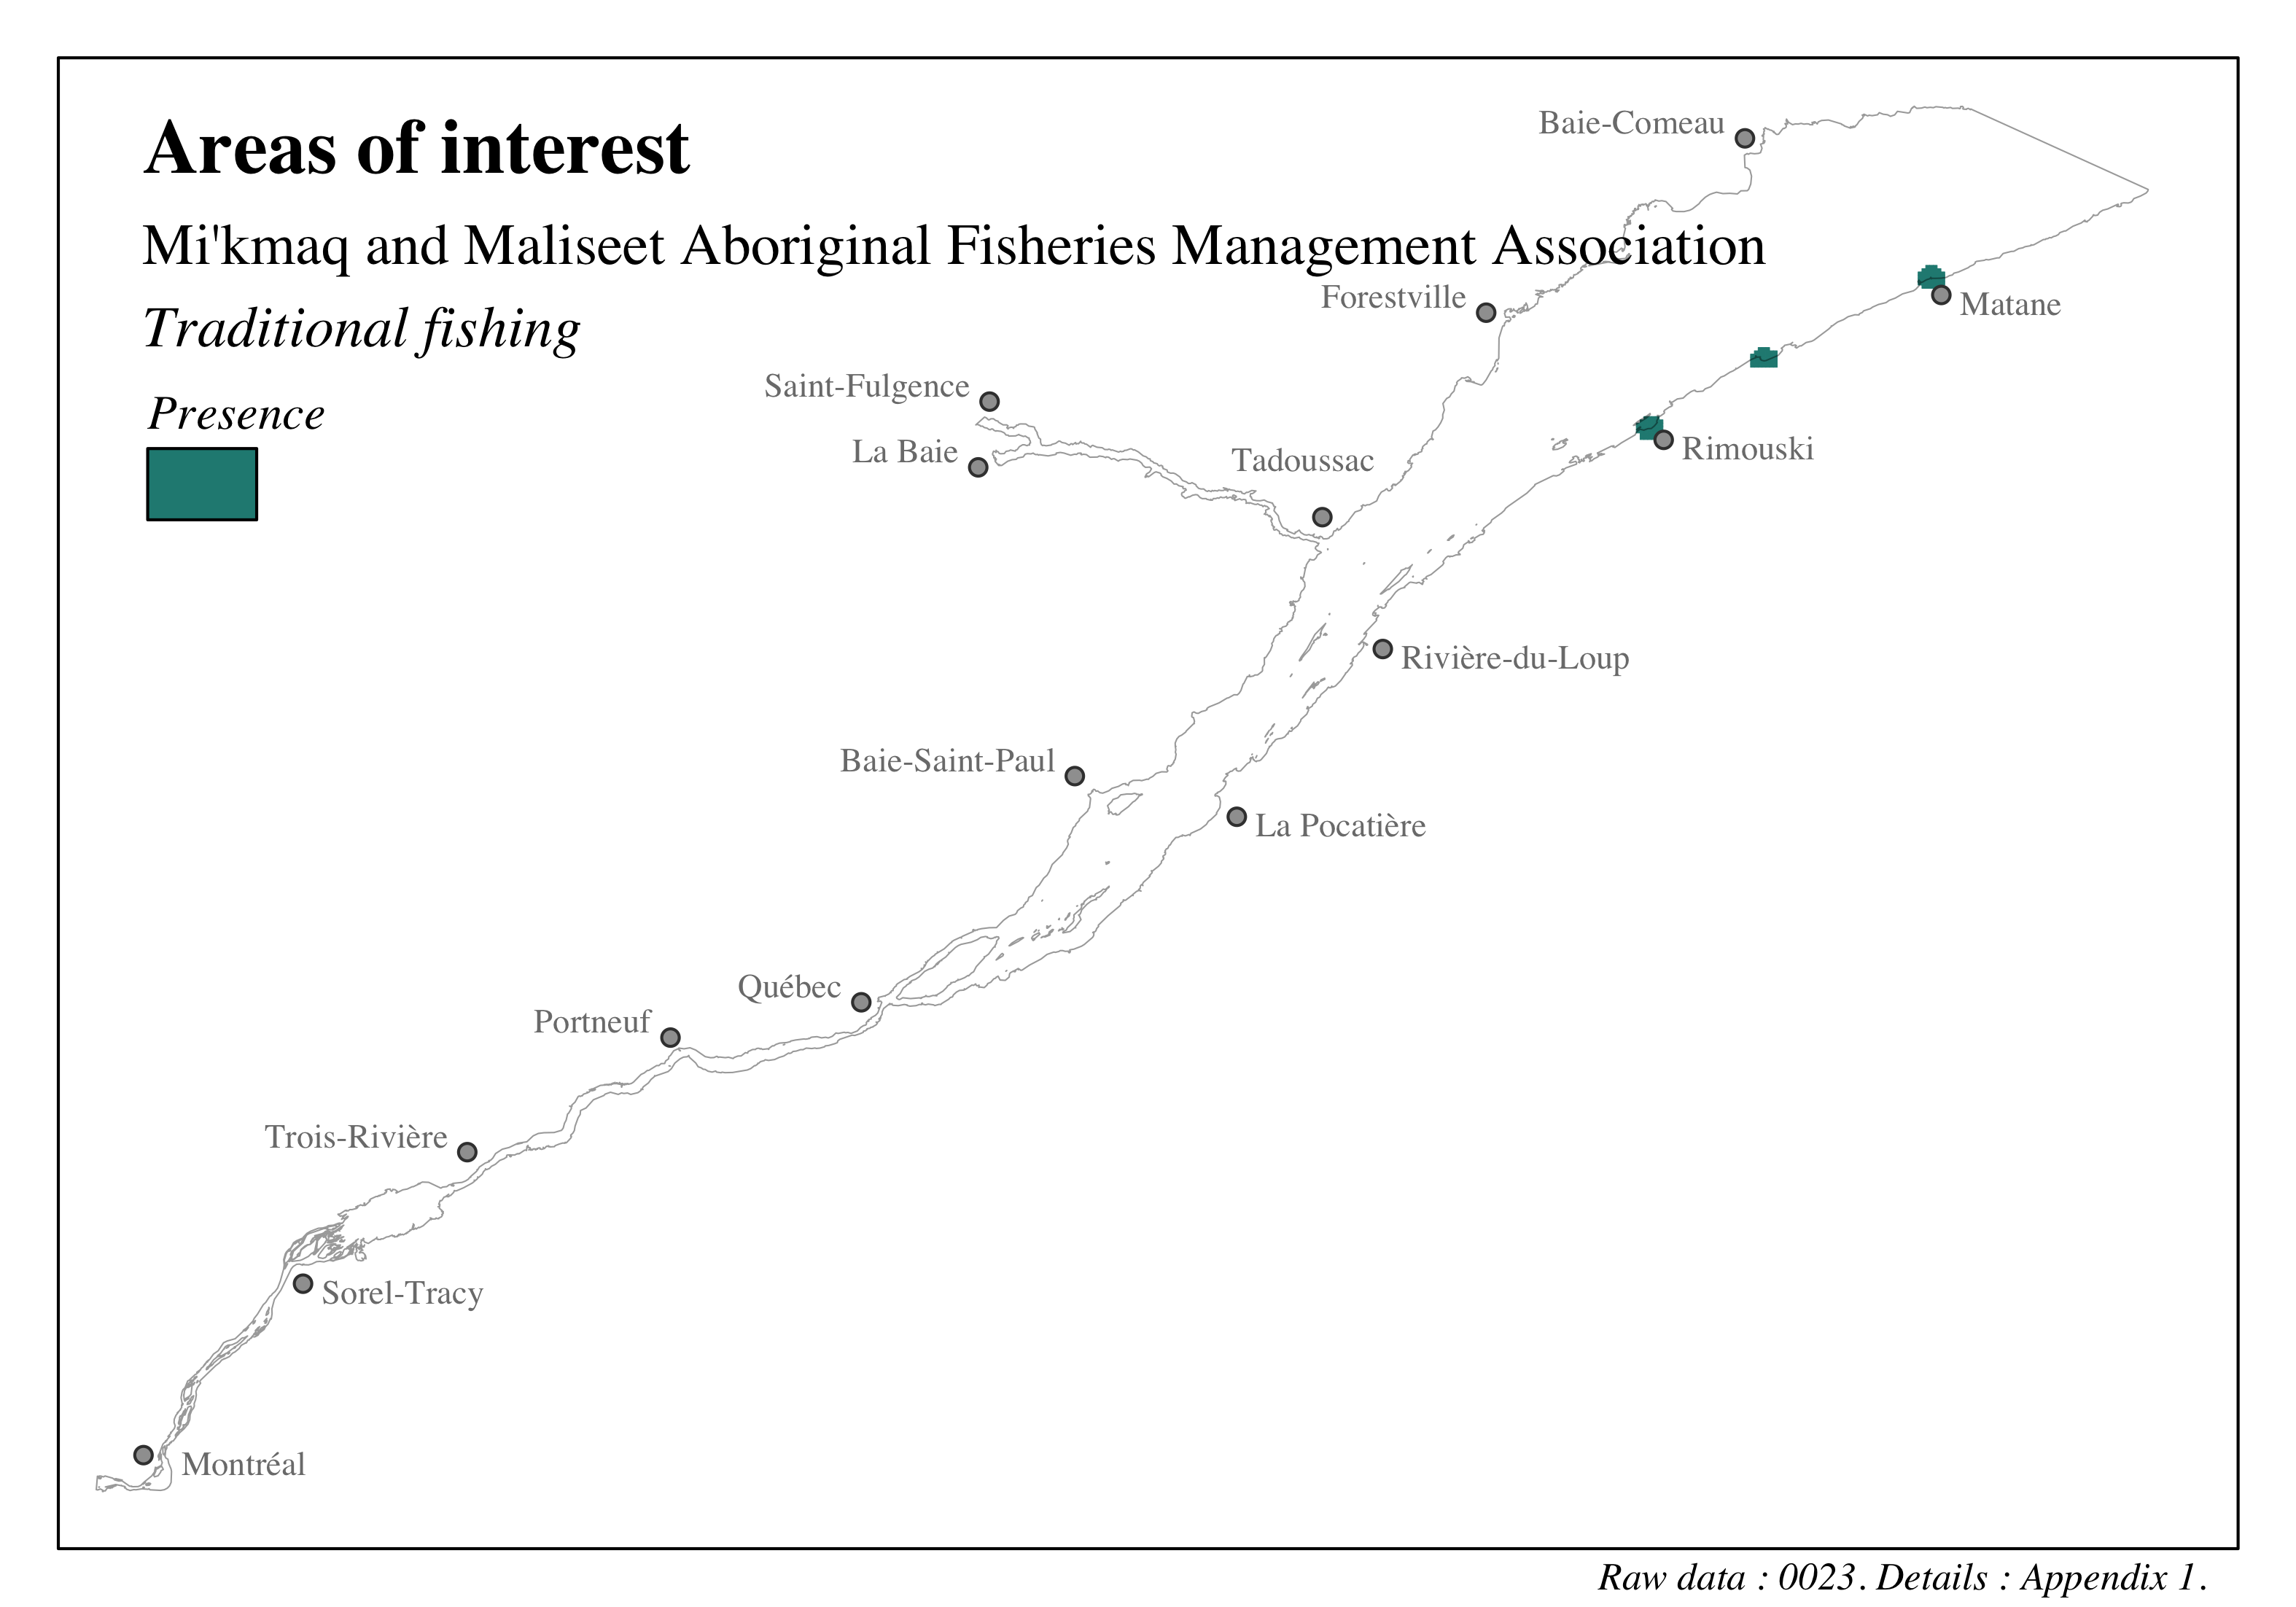
Figure 4.67: Distribution of sites of cultural, heritage and archeological interest in the St. Lawrence and the Saguenay river - MMAFMA - Traditional fishing
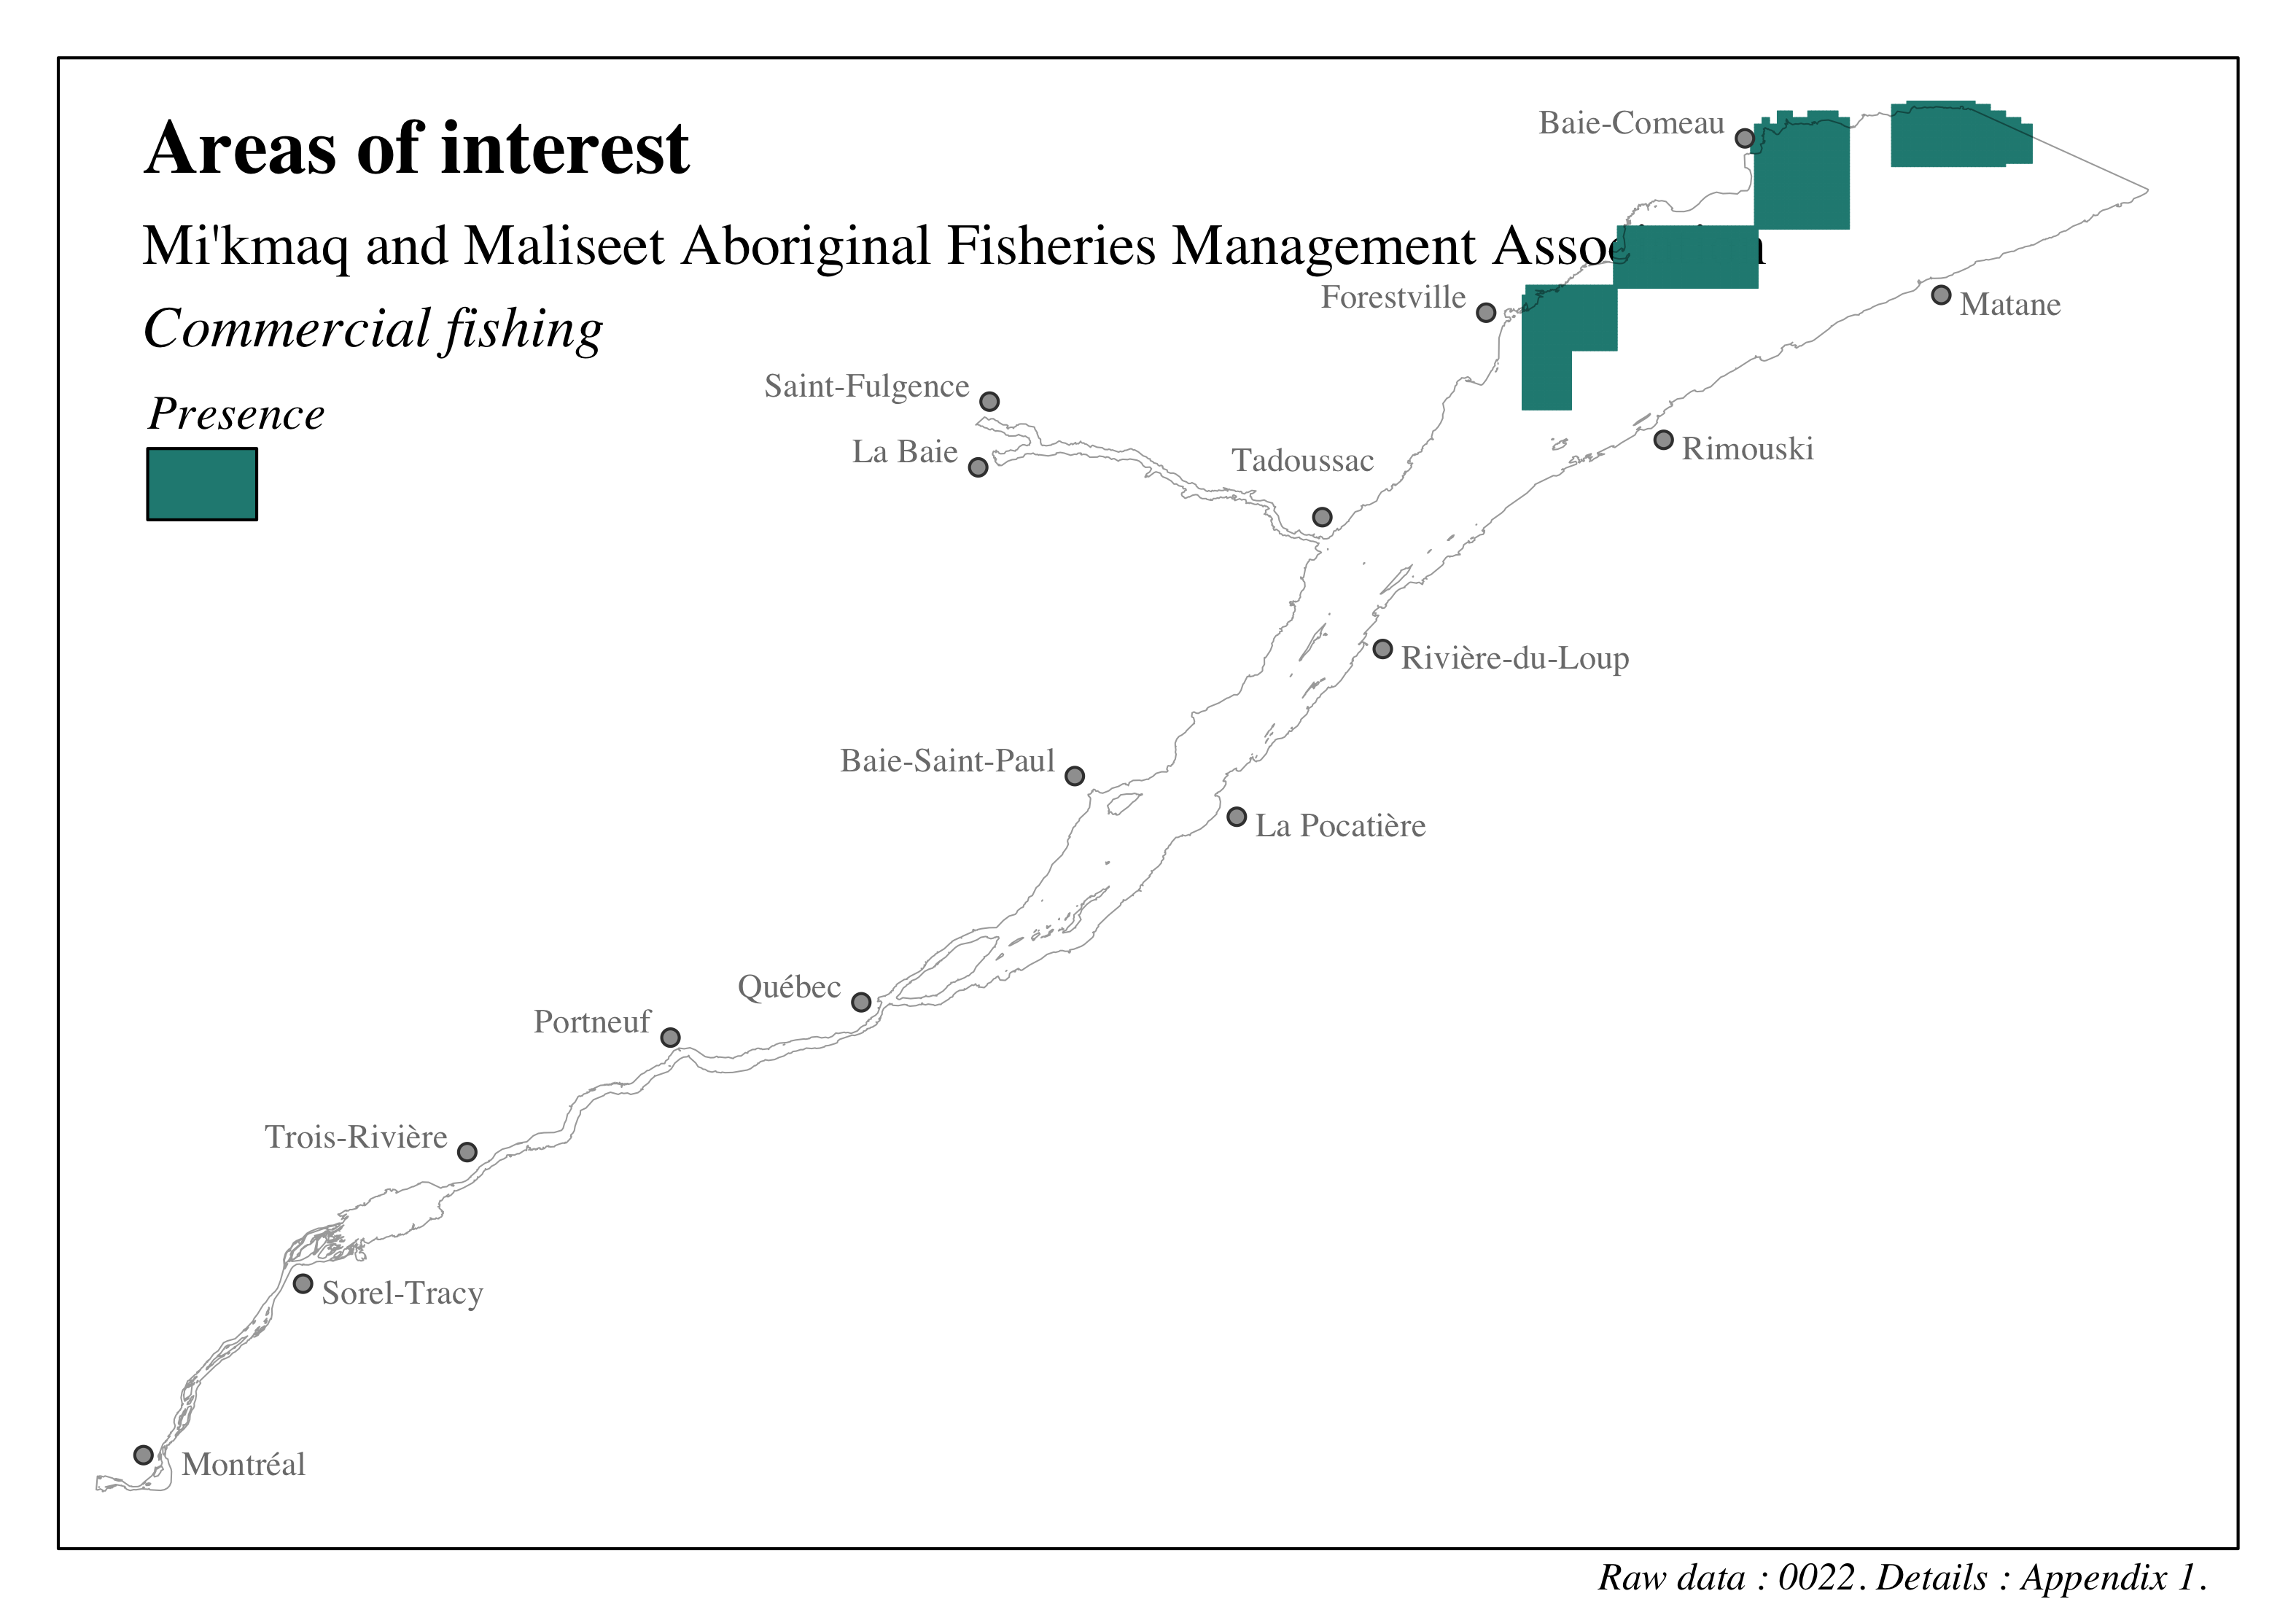
Figure 4.68: Distribution of sites of cultural, heritage and archeological interest in the St. Lawrence and the Saguenay river - MMAFMA - Commercial fisheries
4.3.5.1.2 Innu Nation of Essipit
We thank the Innu Nation of Essipit for their participation, as well as Donald Bouchard and Pierre Tremblay for the discussions and support.
The unique identifier given to the data presented in this section is: 0024. Refer to the following section and to Appendix 1 for more details on these data.
The data transmitted by the Innu Nation of Essipit are an integration of data from various sources (Bouchard and Tremblay, 2021):
- Inventory of archeological sites in Quebec.
- Innu-Aitun follow-up, 2004 to 2018, Essipit.
- History of the commercial (snow crab, sea urchin) and food (Atlantic halibut) fisheries, 1996 to 2020, Essipit.
- Atlas of coastal and marine uses of the St. Lawrence by the Innu of the North Shore, Agence Mamu Innu Kaikusseht, 2019.
- Collection of data on the harvesting of migratory birds in seven Innu communities of the North Shore, Agence Mamu Innu Kaihusseht, 2014
The result of the integration of these data provides the location of areas of interest located in the St. Lawrence Estuary and the Saguenay River. These areas are divided into seven categories:
- Migratory bird hunting
- Seal hunting
- Commercial fishing
- Traditional fishing
- Tourist activities
- Access to the water
- Culture and heritage
These categories of area of interest are used in the marine vessel activities cumulative effects assessment in the study area. It is important to note that the original data used cover a wider area than the study area of this assessment, but were intersected and limited to our study area.
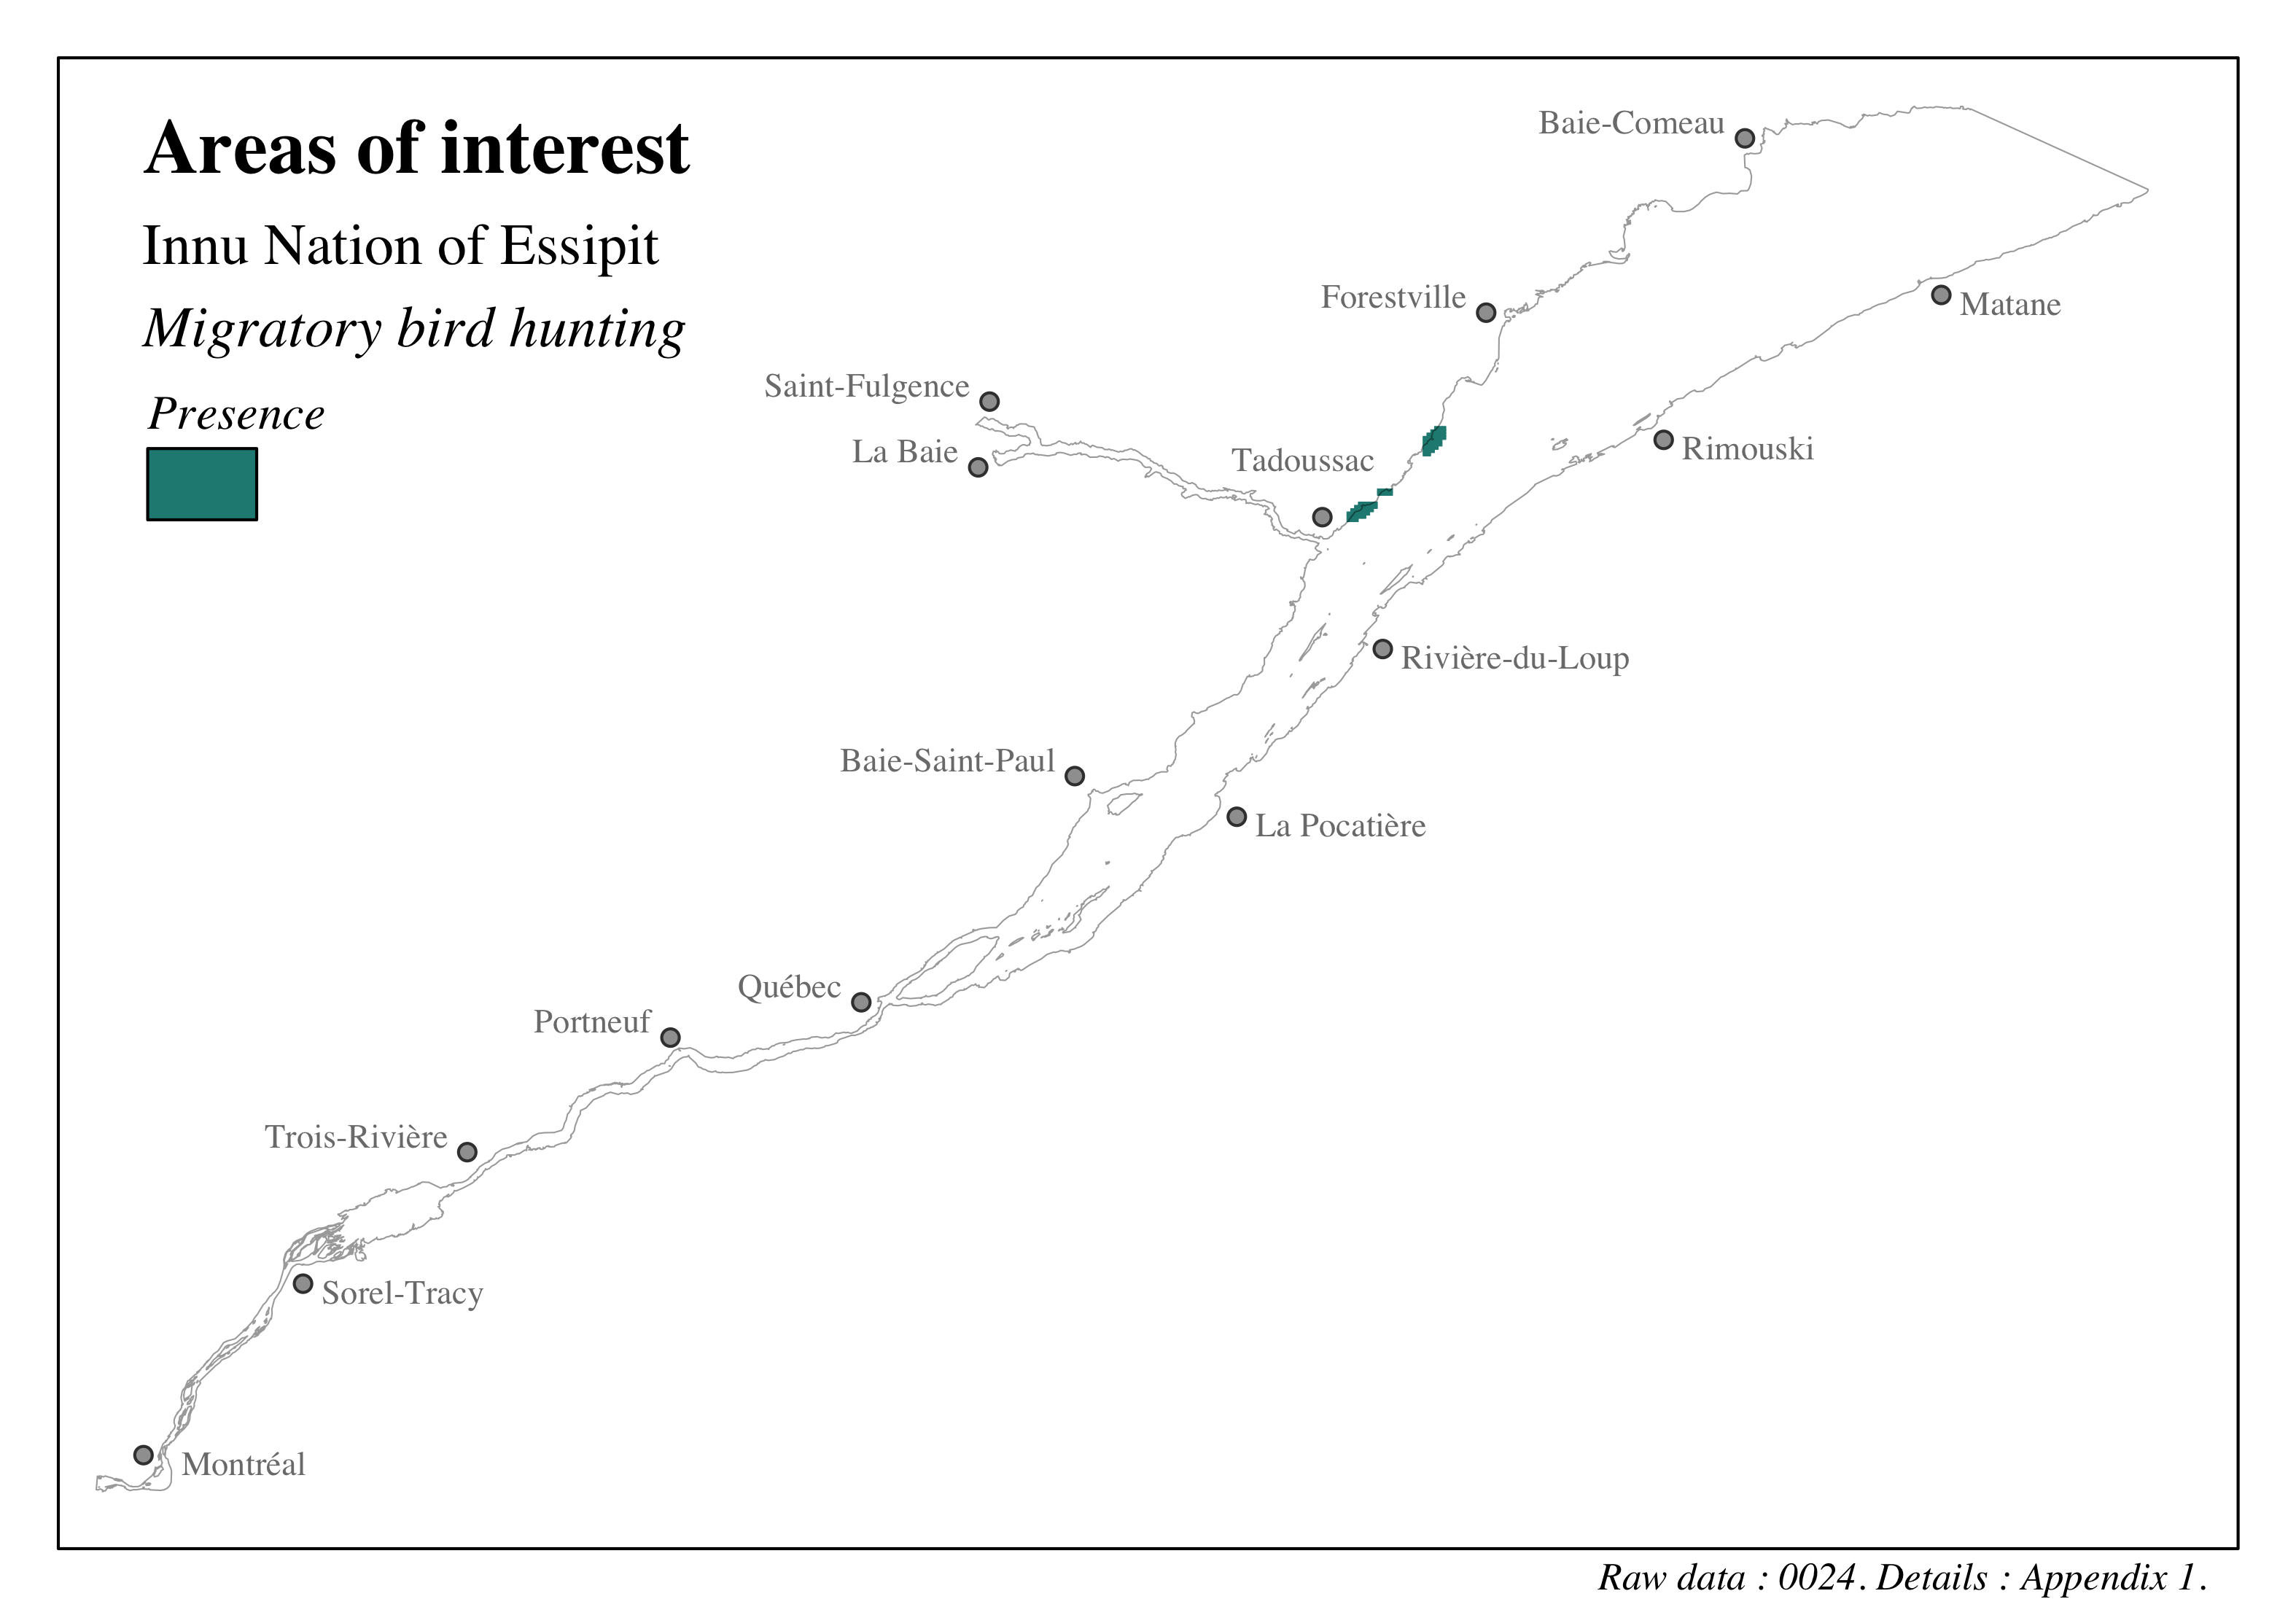
Figure 4.69: Distribution of sites of cultural, heritage and archeological interest in the St. Lawrence and the Saguenay river - Innu Nation of Essipit - Migratory bird hunting

Figure 4.70: Distribution of sites of cultural, heritage and archeological interest in the St. Lawrence and the Saguenay river - Innu Nation of Essipit - Seal hunting
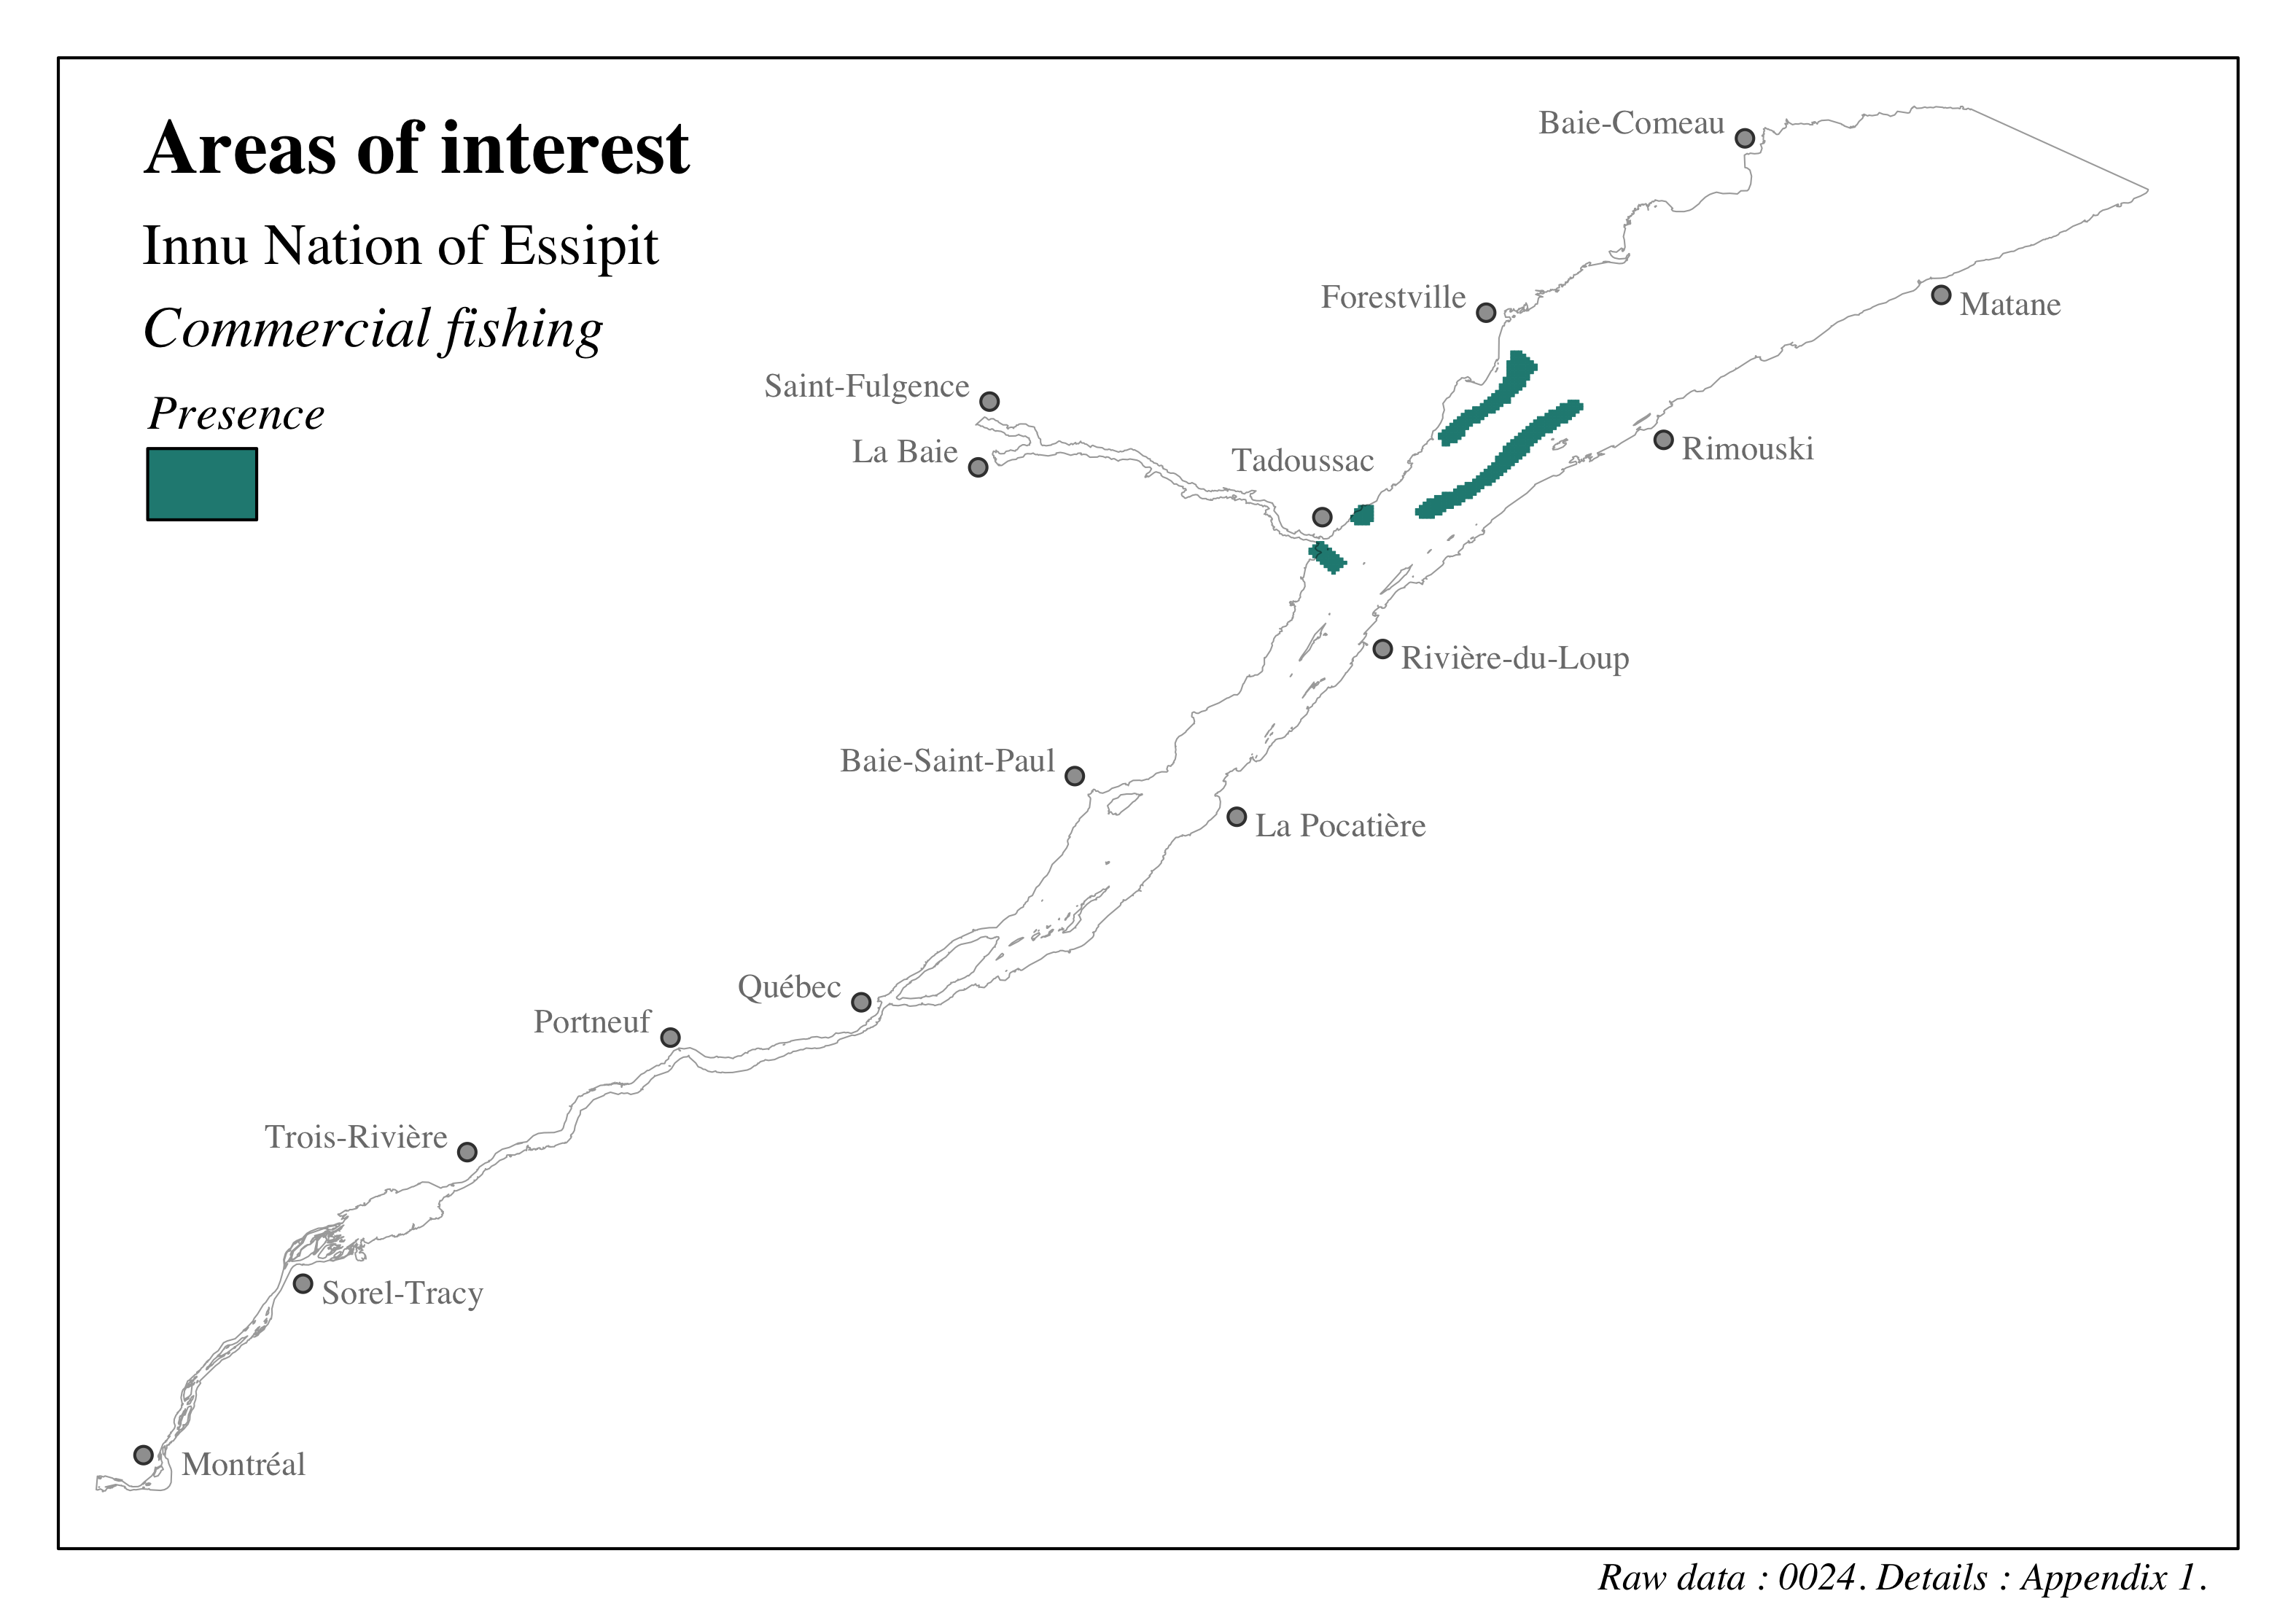
Figure 4.71: Distribution of sites of cultural, heritage and archeological interest in the St. Lawrence and the Saguenay river - Innu Nation of Essipit - Commercial fishing
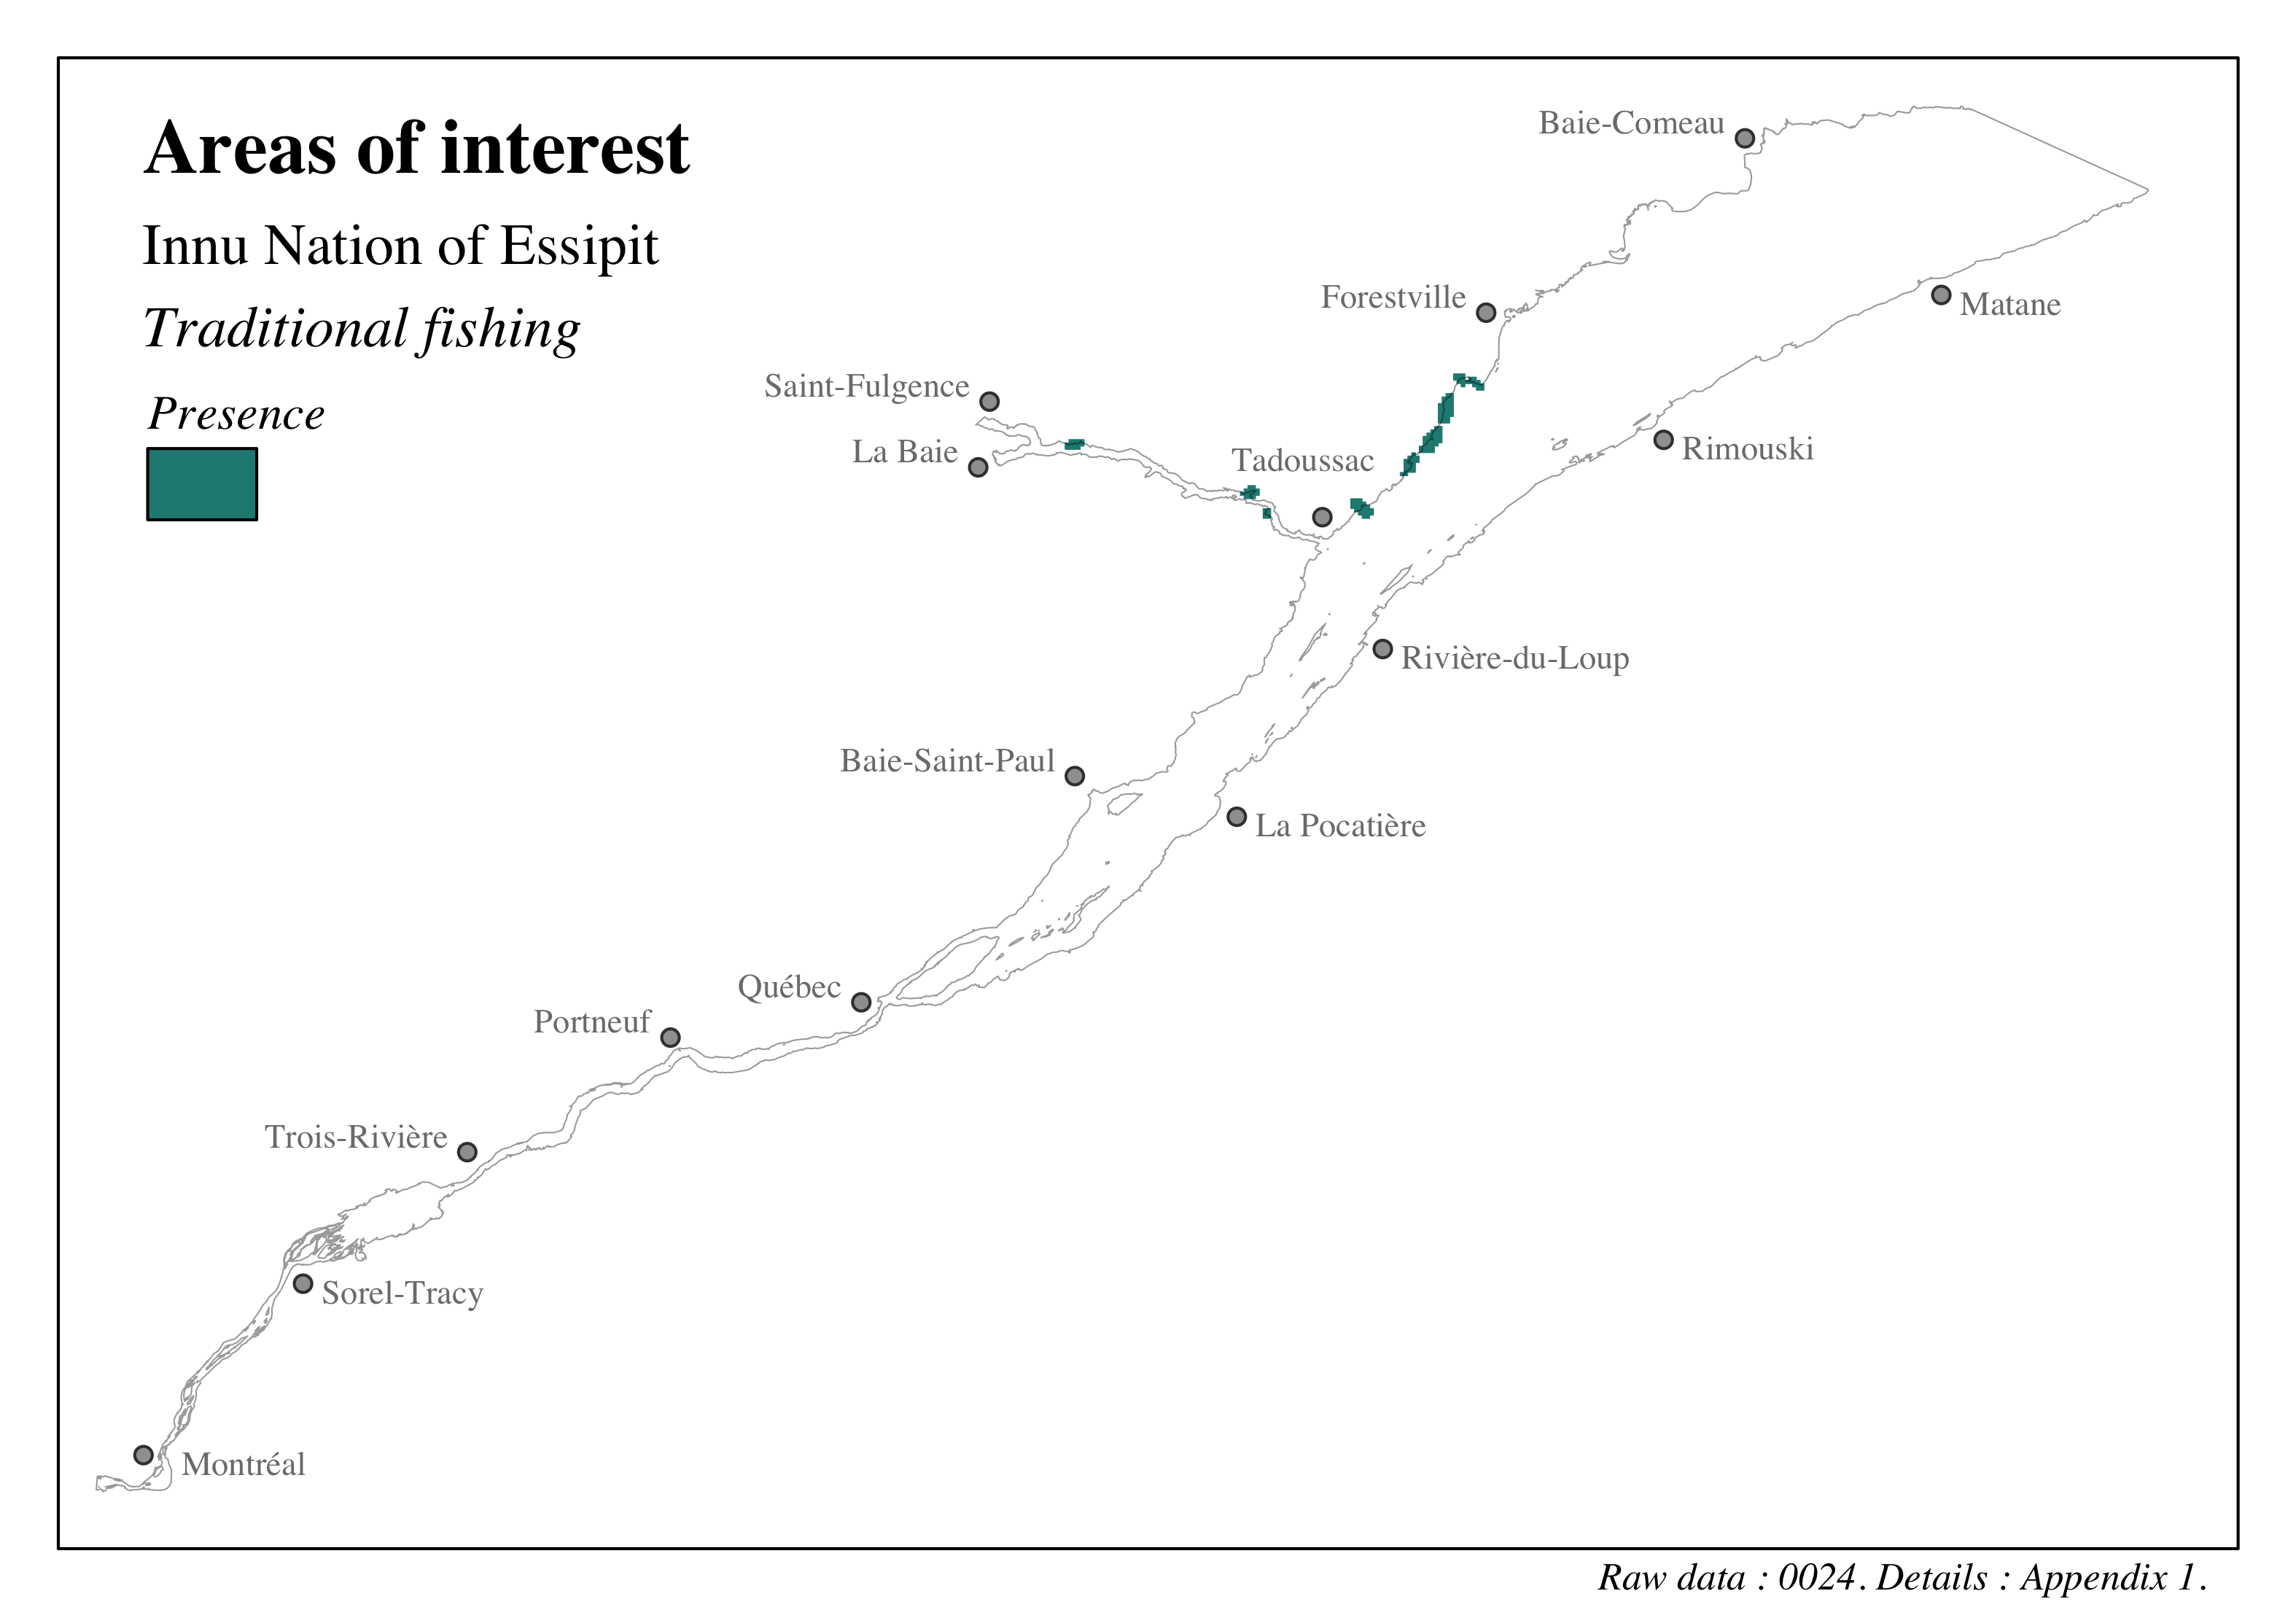
Figure 4.72: Distribution of sites of cultural, heritage and archeological interest in the St. Lawrence and the Saguenay river - Innu Nation of Essipit - Traditional fishing
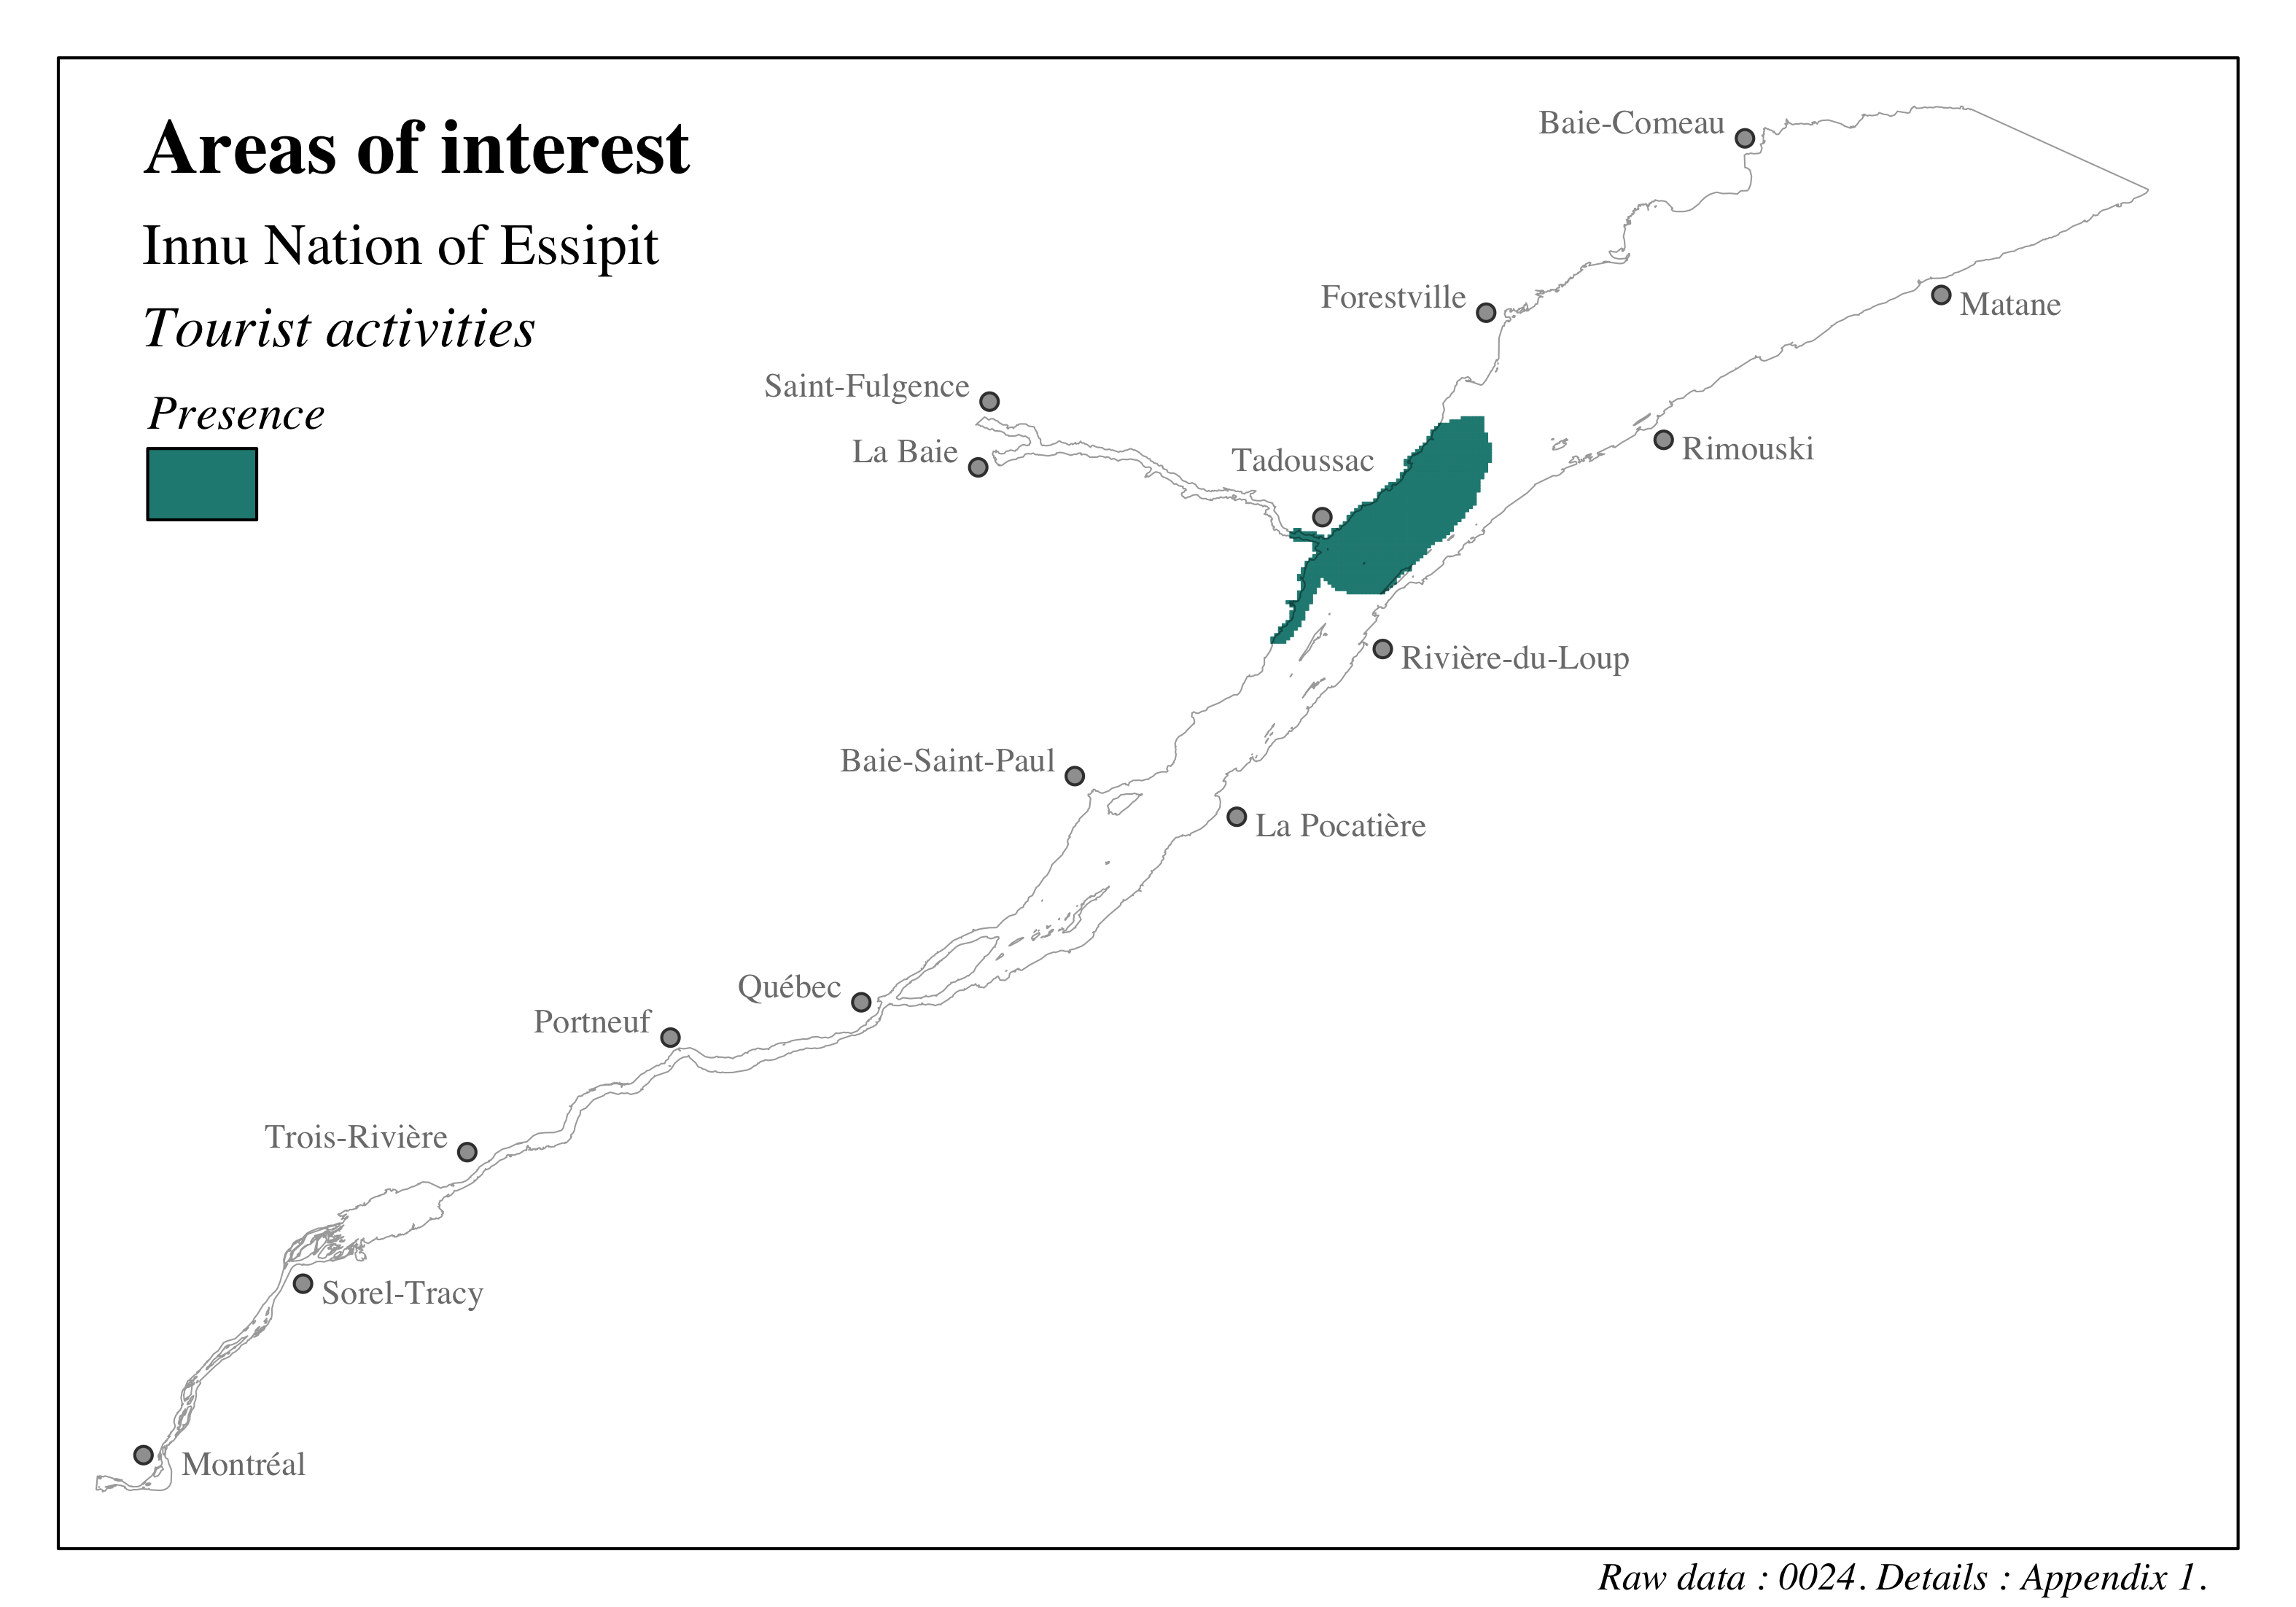
Figure 4.73: Distribution of sites of cultural, heritage and archeological interest in the St. Lawrence and the Saguenay river - Innu Nation of Essipit - Tourist activities

Figure 4.74: Distribution of sites of cultural, heritage and archeological interest in the St. Lawrence and the Saguenay river - Innu Nation of Essipit - Access to waterbody

Figure 4.75: Distribution of sites of cultural, heritage and archeological interest in the St. Lawrence and the Saguenay river - Innu Nation of Essipit - Culture and heritage
4.3.5.1.3 Huron-Wendat Nation
We thank the Huron-Wendat Nation for their participation, as well as Maria Rodriguez, Stéphanie B. Nadeau and Mario Gros-Louis for their discussions and support.
The unique identifier given to the data presented in this section is: 0055. Refer to the following section and to Appendix 1 for more details on these data.
The data transmitted by the Huron-Wendat Nation provide the location of areas of interest mainly in the fluvial portion of the St. Lawrence and the estuary, and to a lesser extent in the St. Lawrence estuary (Nation Huronne-Wendat, 2021). The areas are composed of nine themes divided into three unique categories:
- Contemporary sites
- Ritual or social activities
- Hunting
- Fishing
- Harvesting of vegetation
- Land use
- Ecological sites
- Species at risk
- Heritage sites
- Archeology
- History
- Toponymy
The land use category groups together various types of areas of interest for the Huron-Wendat Nation. A general formula for designating these areas has been kept due to the sensitivity of the data included. The themes were considered as unique categories of valued components for the cumulative effects assessment. It is important to note that the original data used cover a wider area than the study area of this assessment, but were intersected and limited to our study area.
4.3.5.1.3.1 Contemporary sites
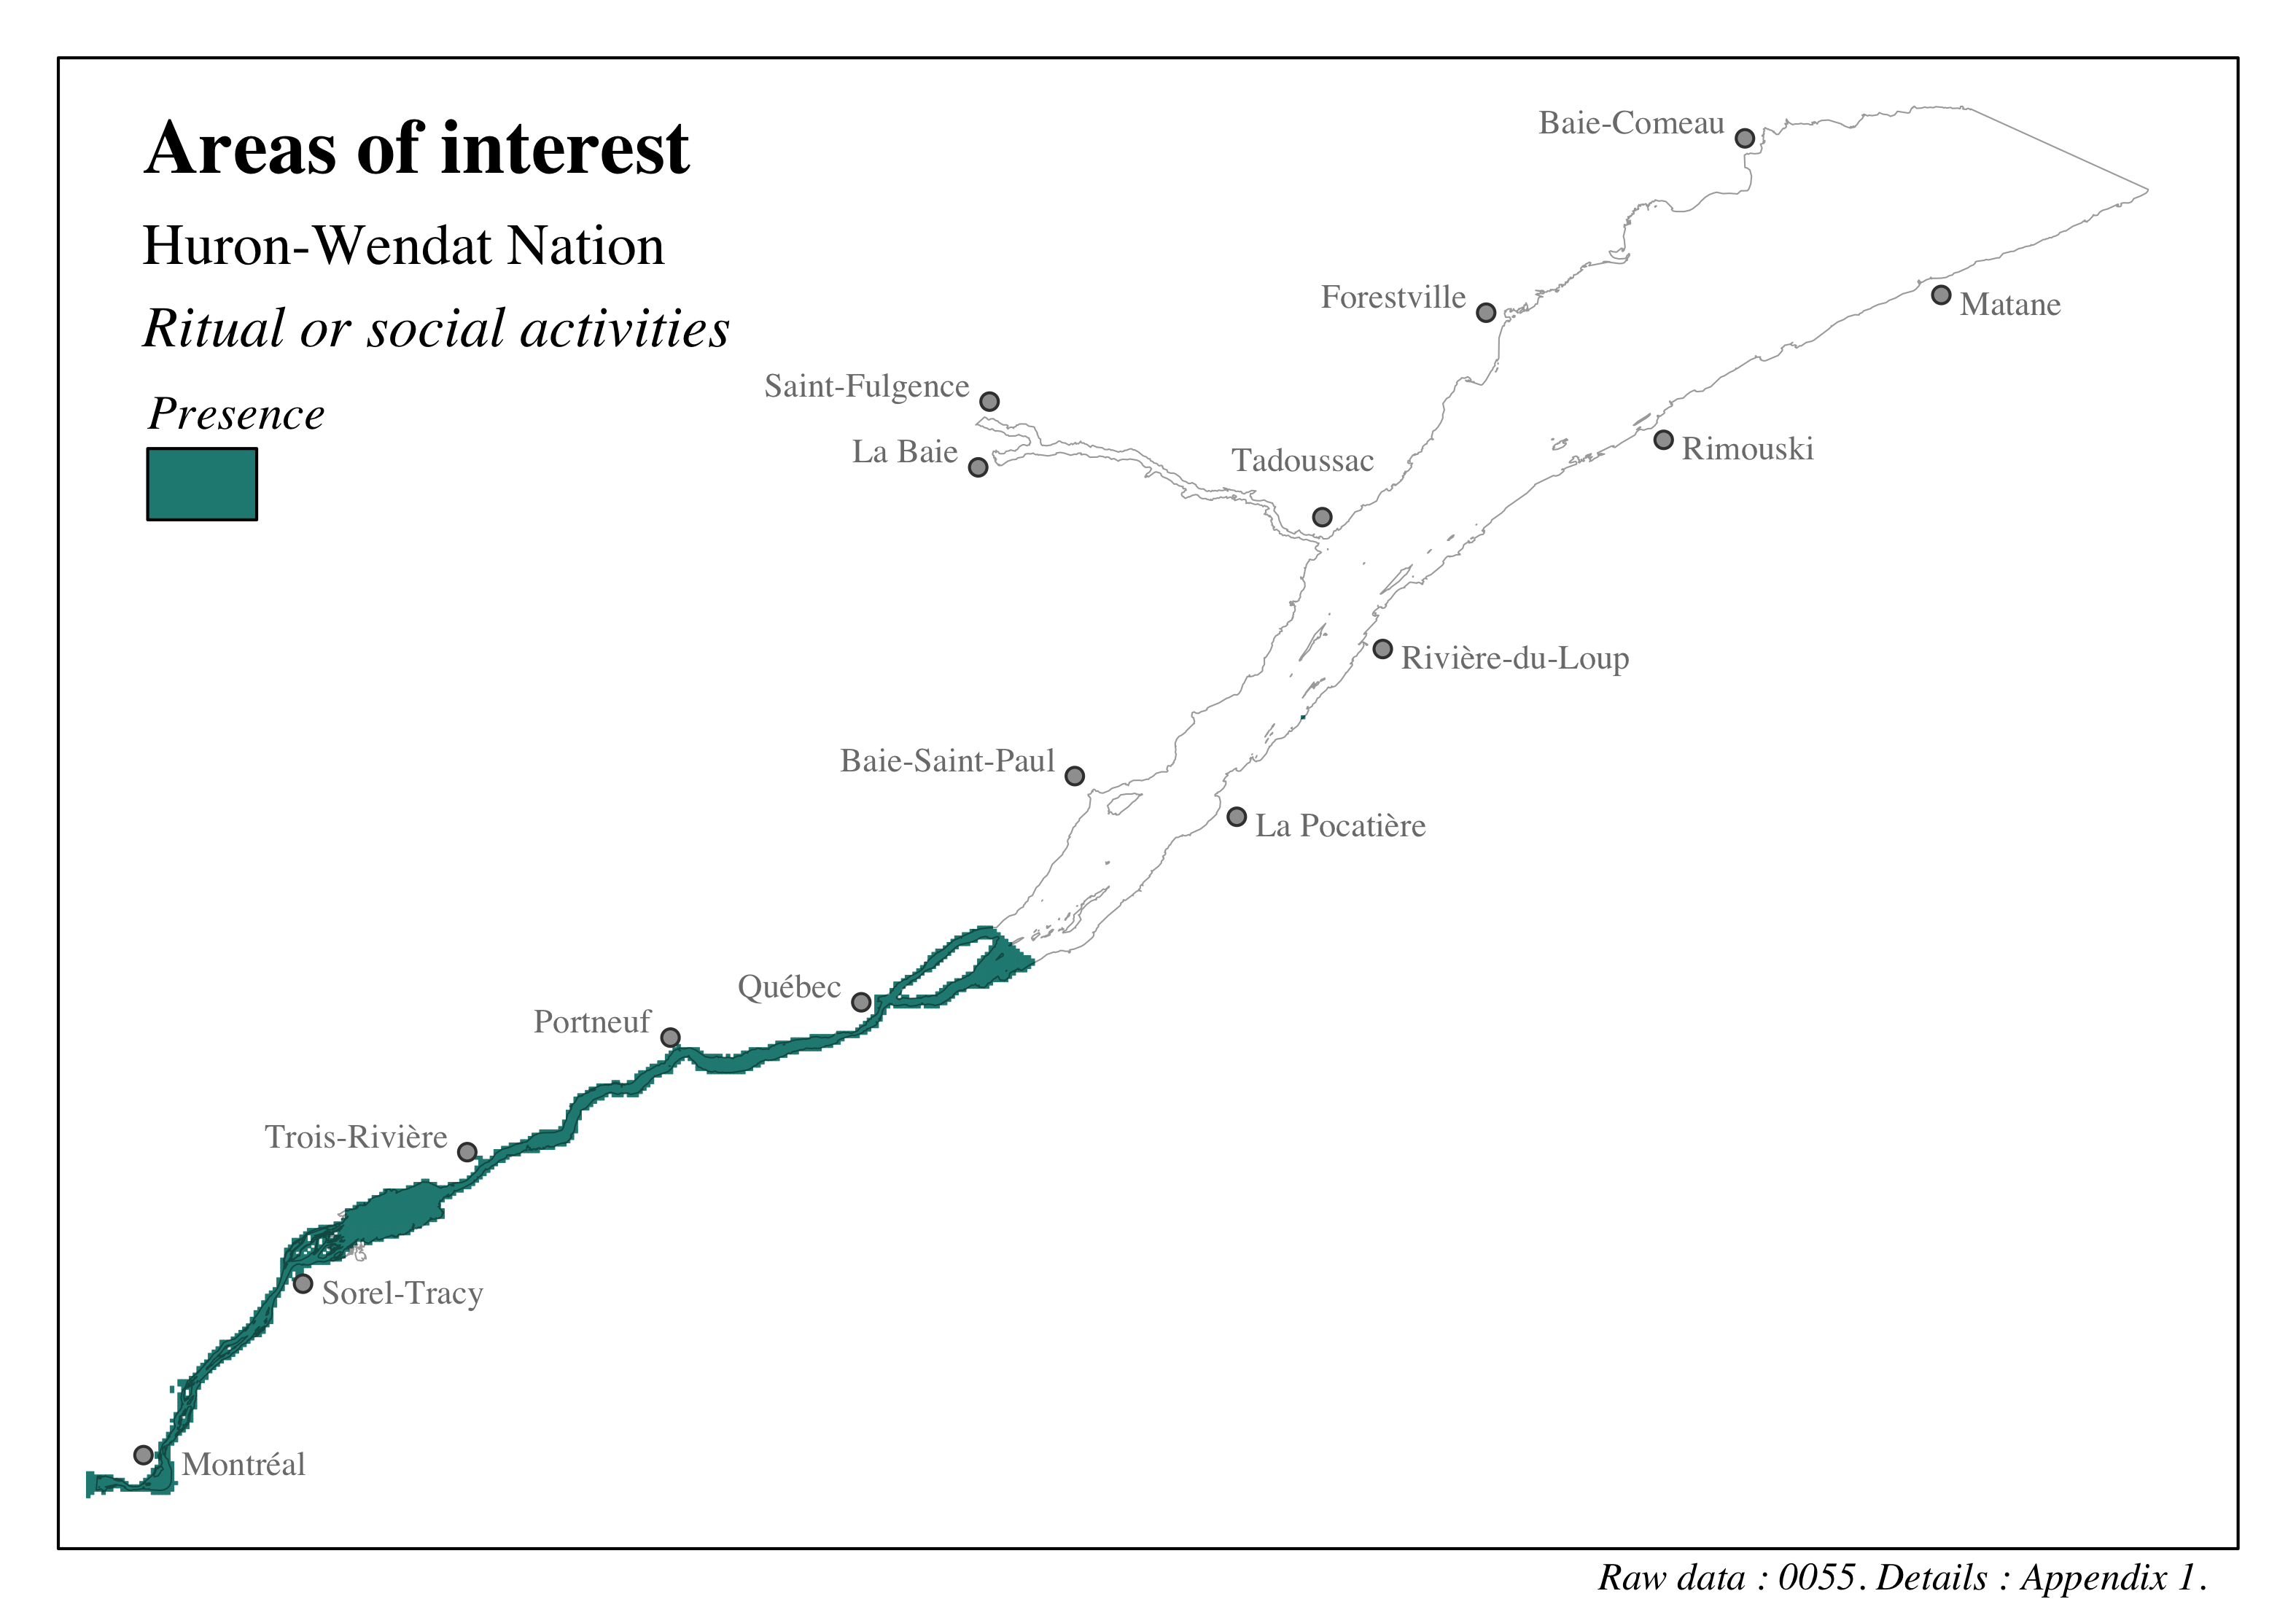
Figure 4.76: Distribution of sites of cultural, heritage and archeological interest in the St. Lawrence and the Saguenay river - Huron-Wendat Nation - Ritual or social activities
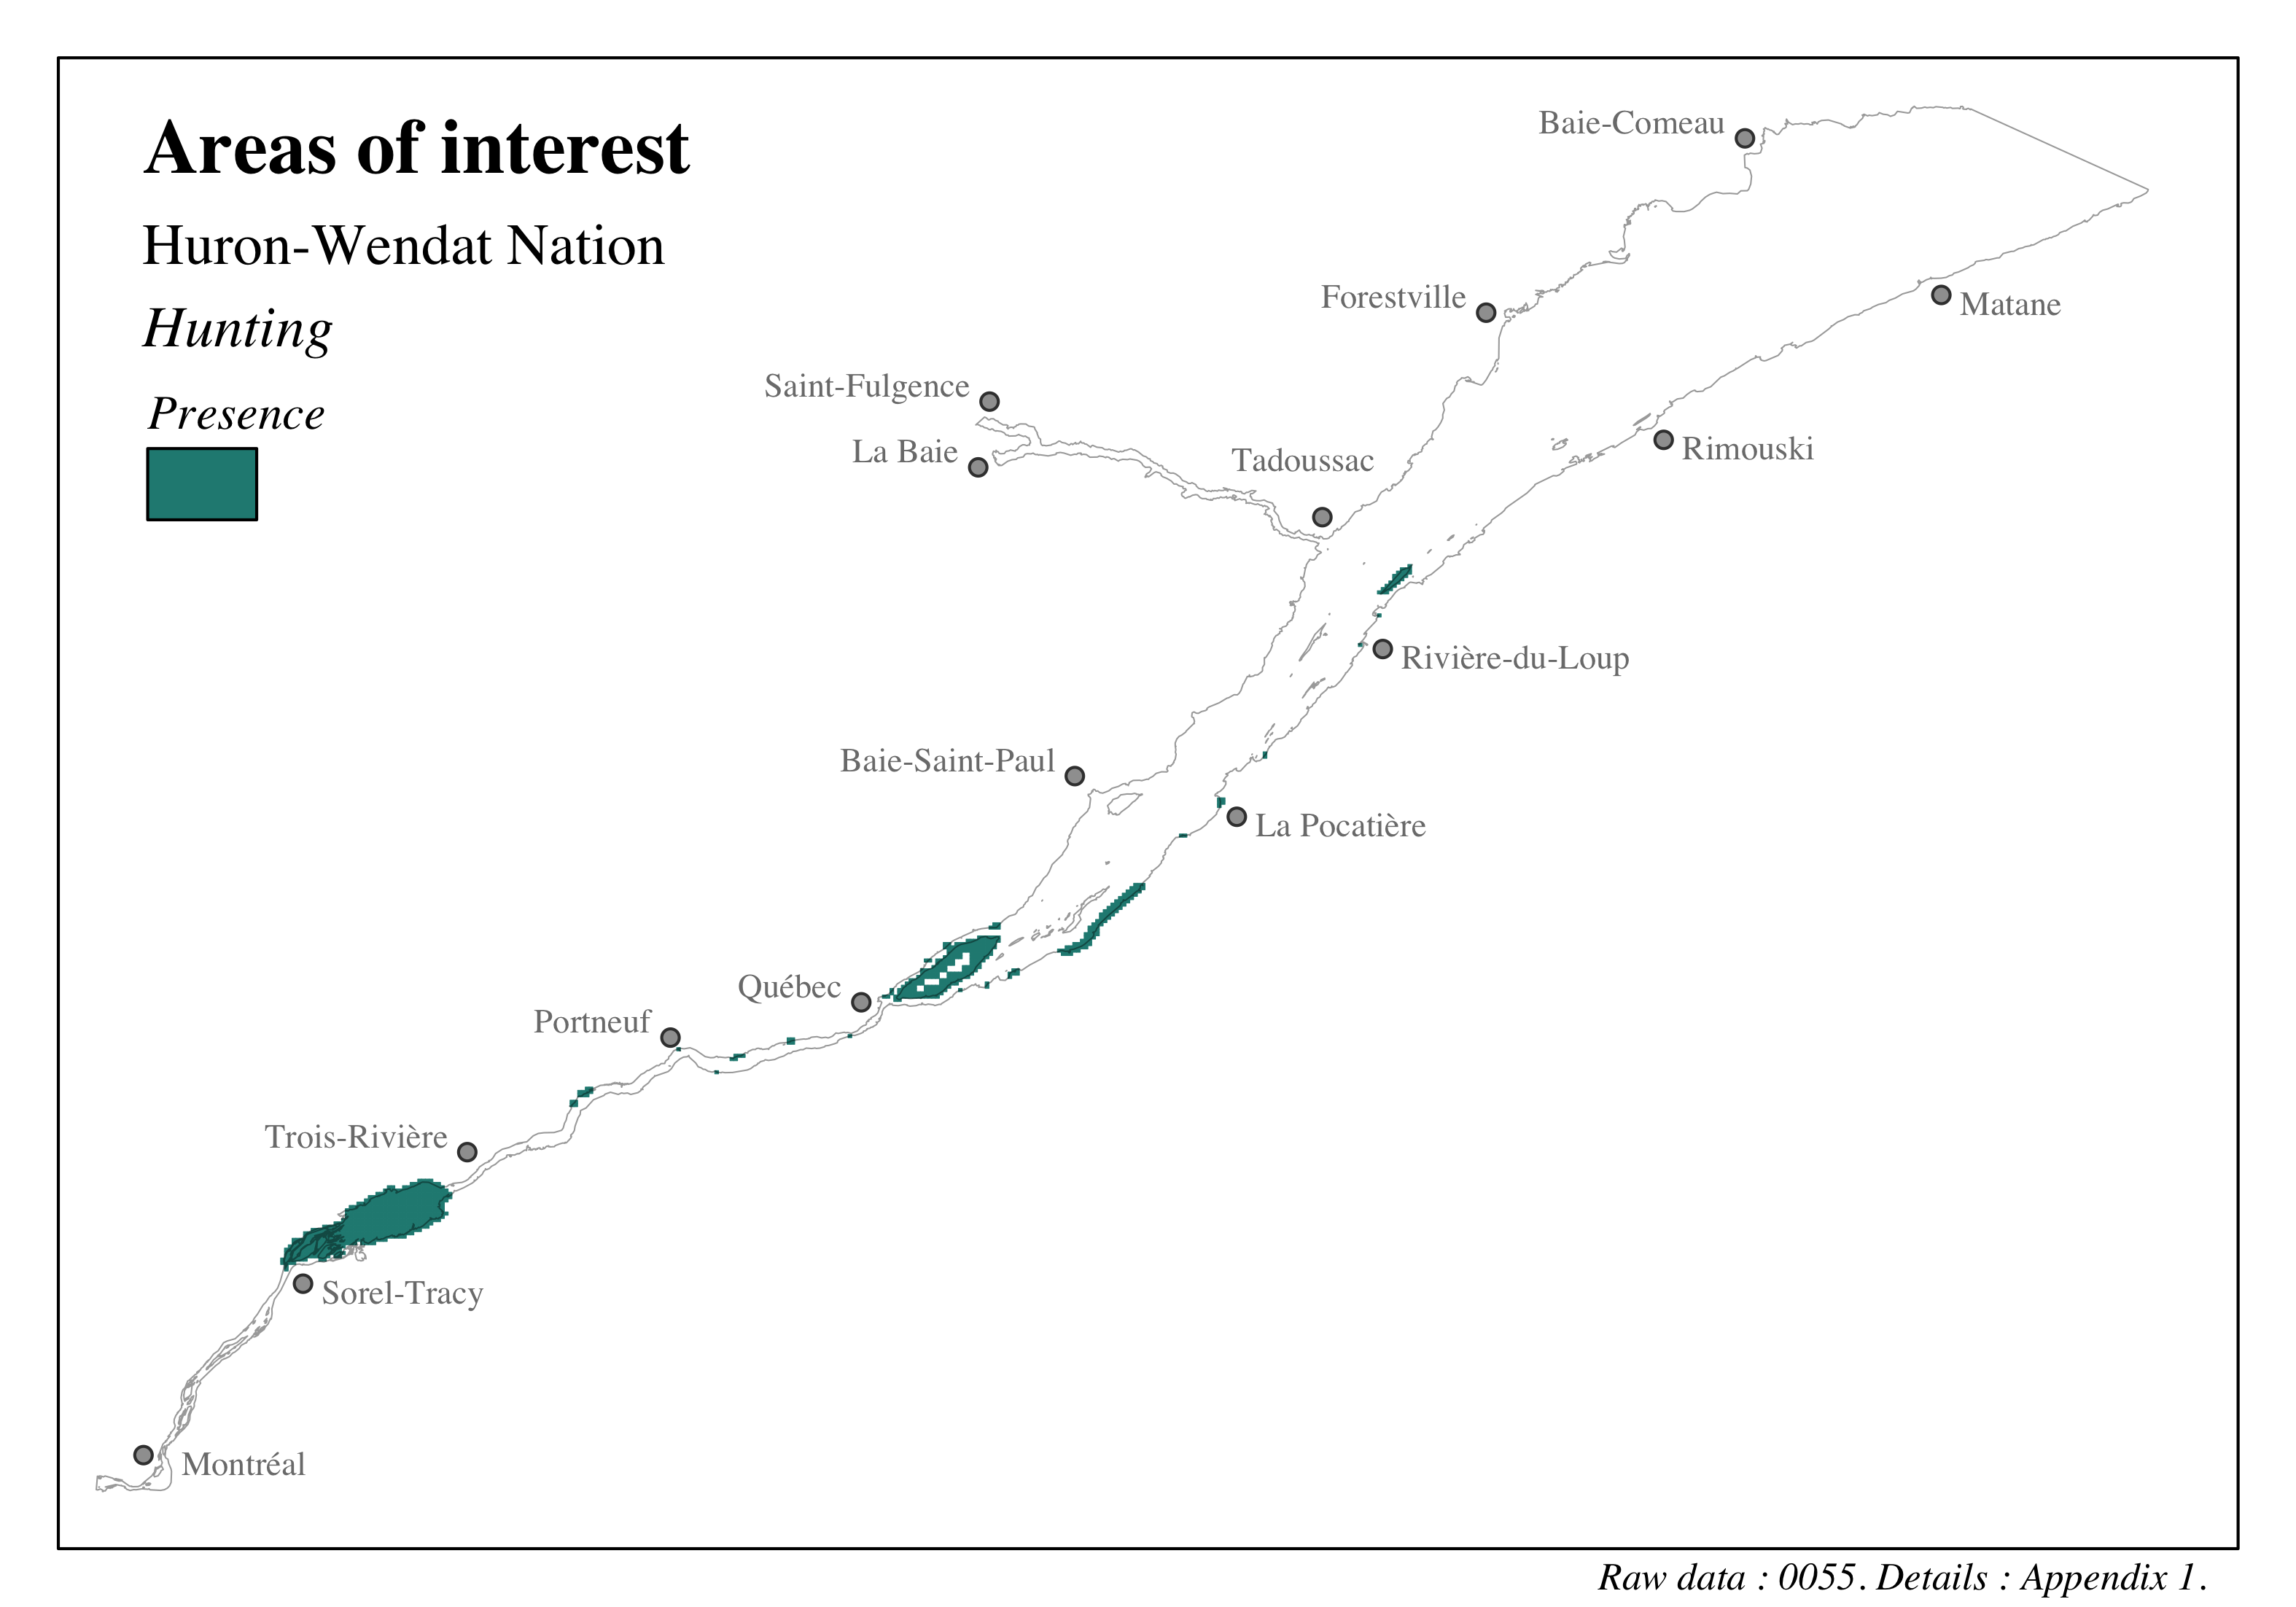
Figure 4.77: Distribution of sites of cultural, heritage and archeological interest in the St. Lawrence and the Saguenay river - Huron-Wendat Nation - Hunting
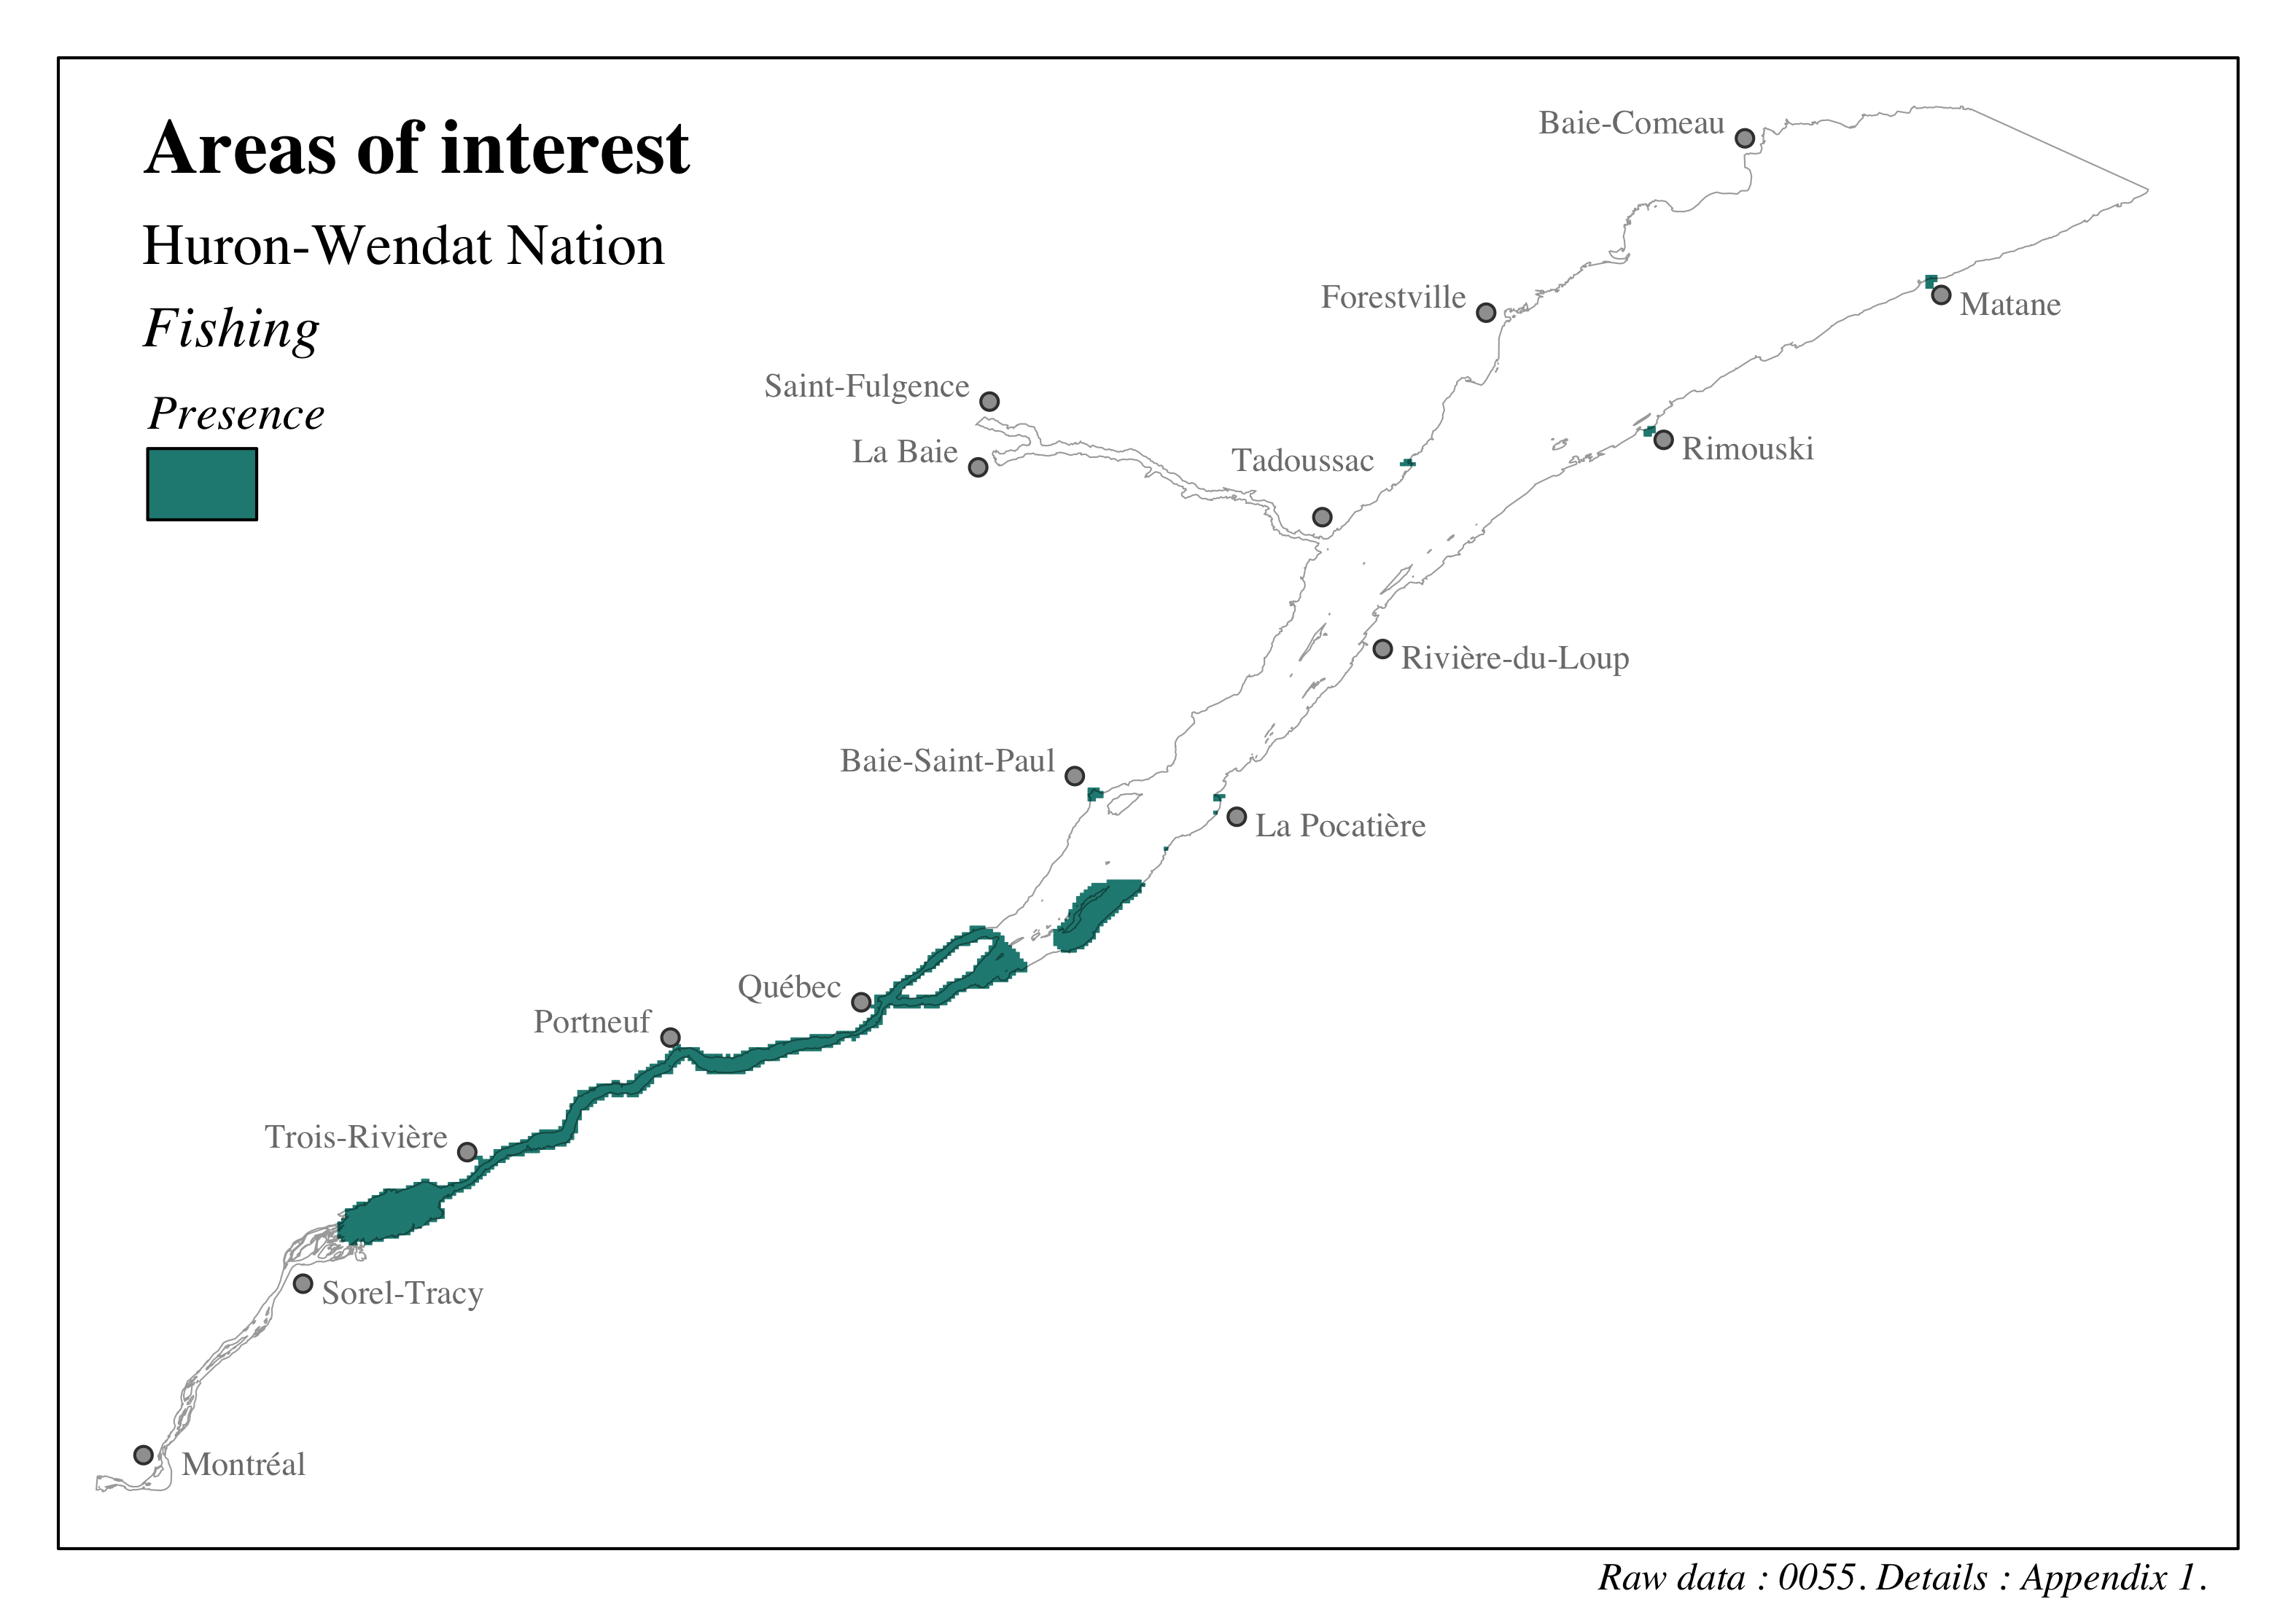
Figure 4.78: Distribution of sites of cultural, heritage and archeological interest in the St. Lawrence and the Saguenay river - Huron-Wendat Nation - Fishing

Figure 4.79: Distribution of sites of cultural, heritage and archeological interest in the St. Lawrence and the Saguenay river - Huron-Wendat Nation - Harvesting of vegetation
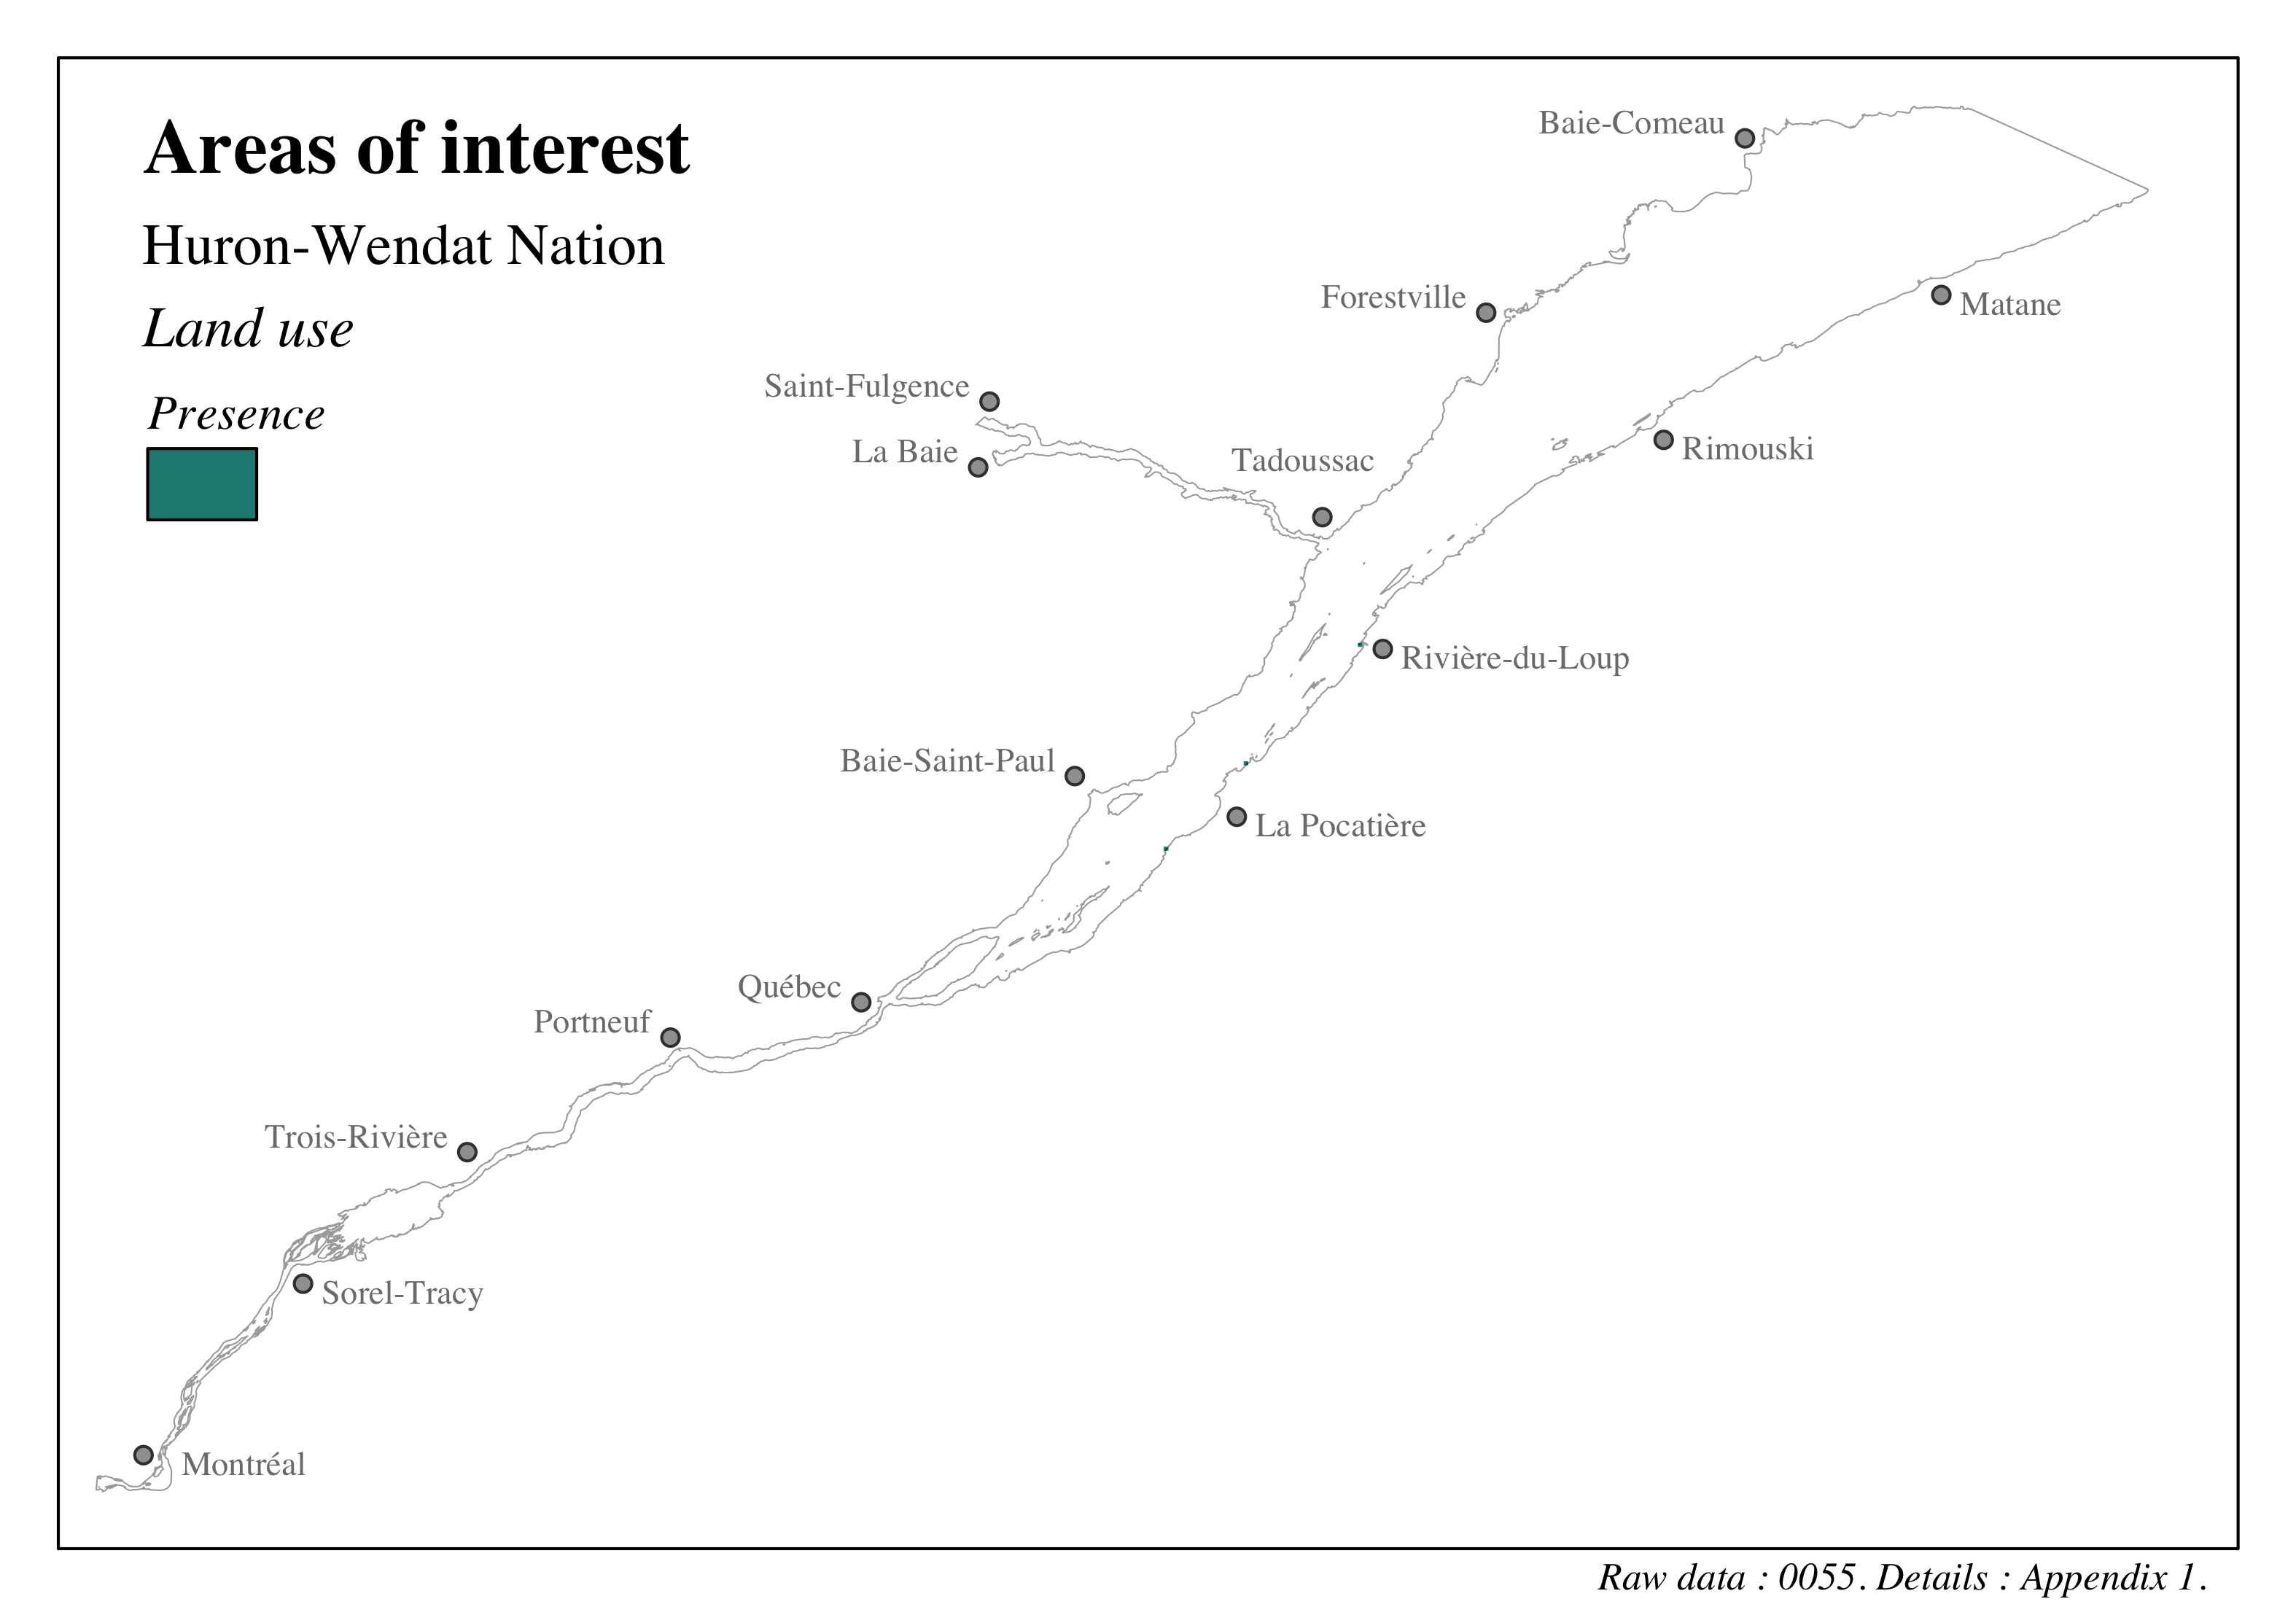
Figure 4.80: Distribution of sites of cultural, heritage and archeological interest in the St. Lawrence and the Saguenay river - Huron-Wendat Nation - Land use
4.3.5.1.3.2 Ecological sites
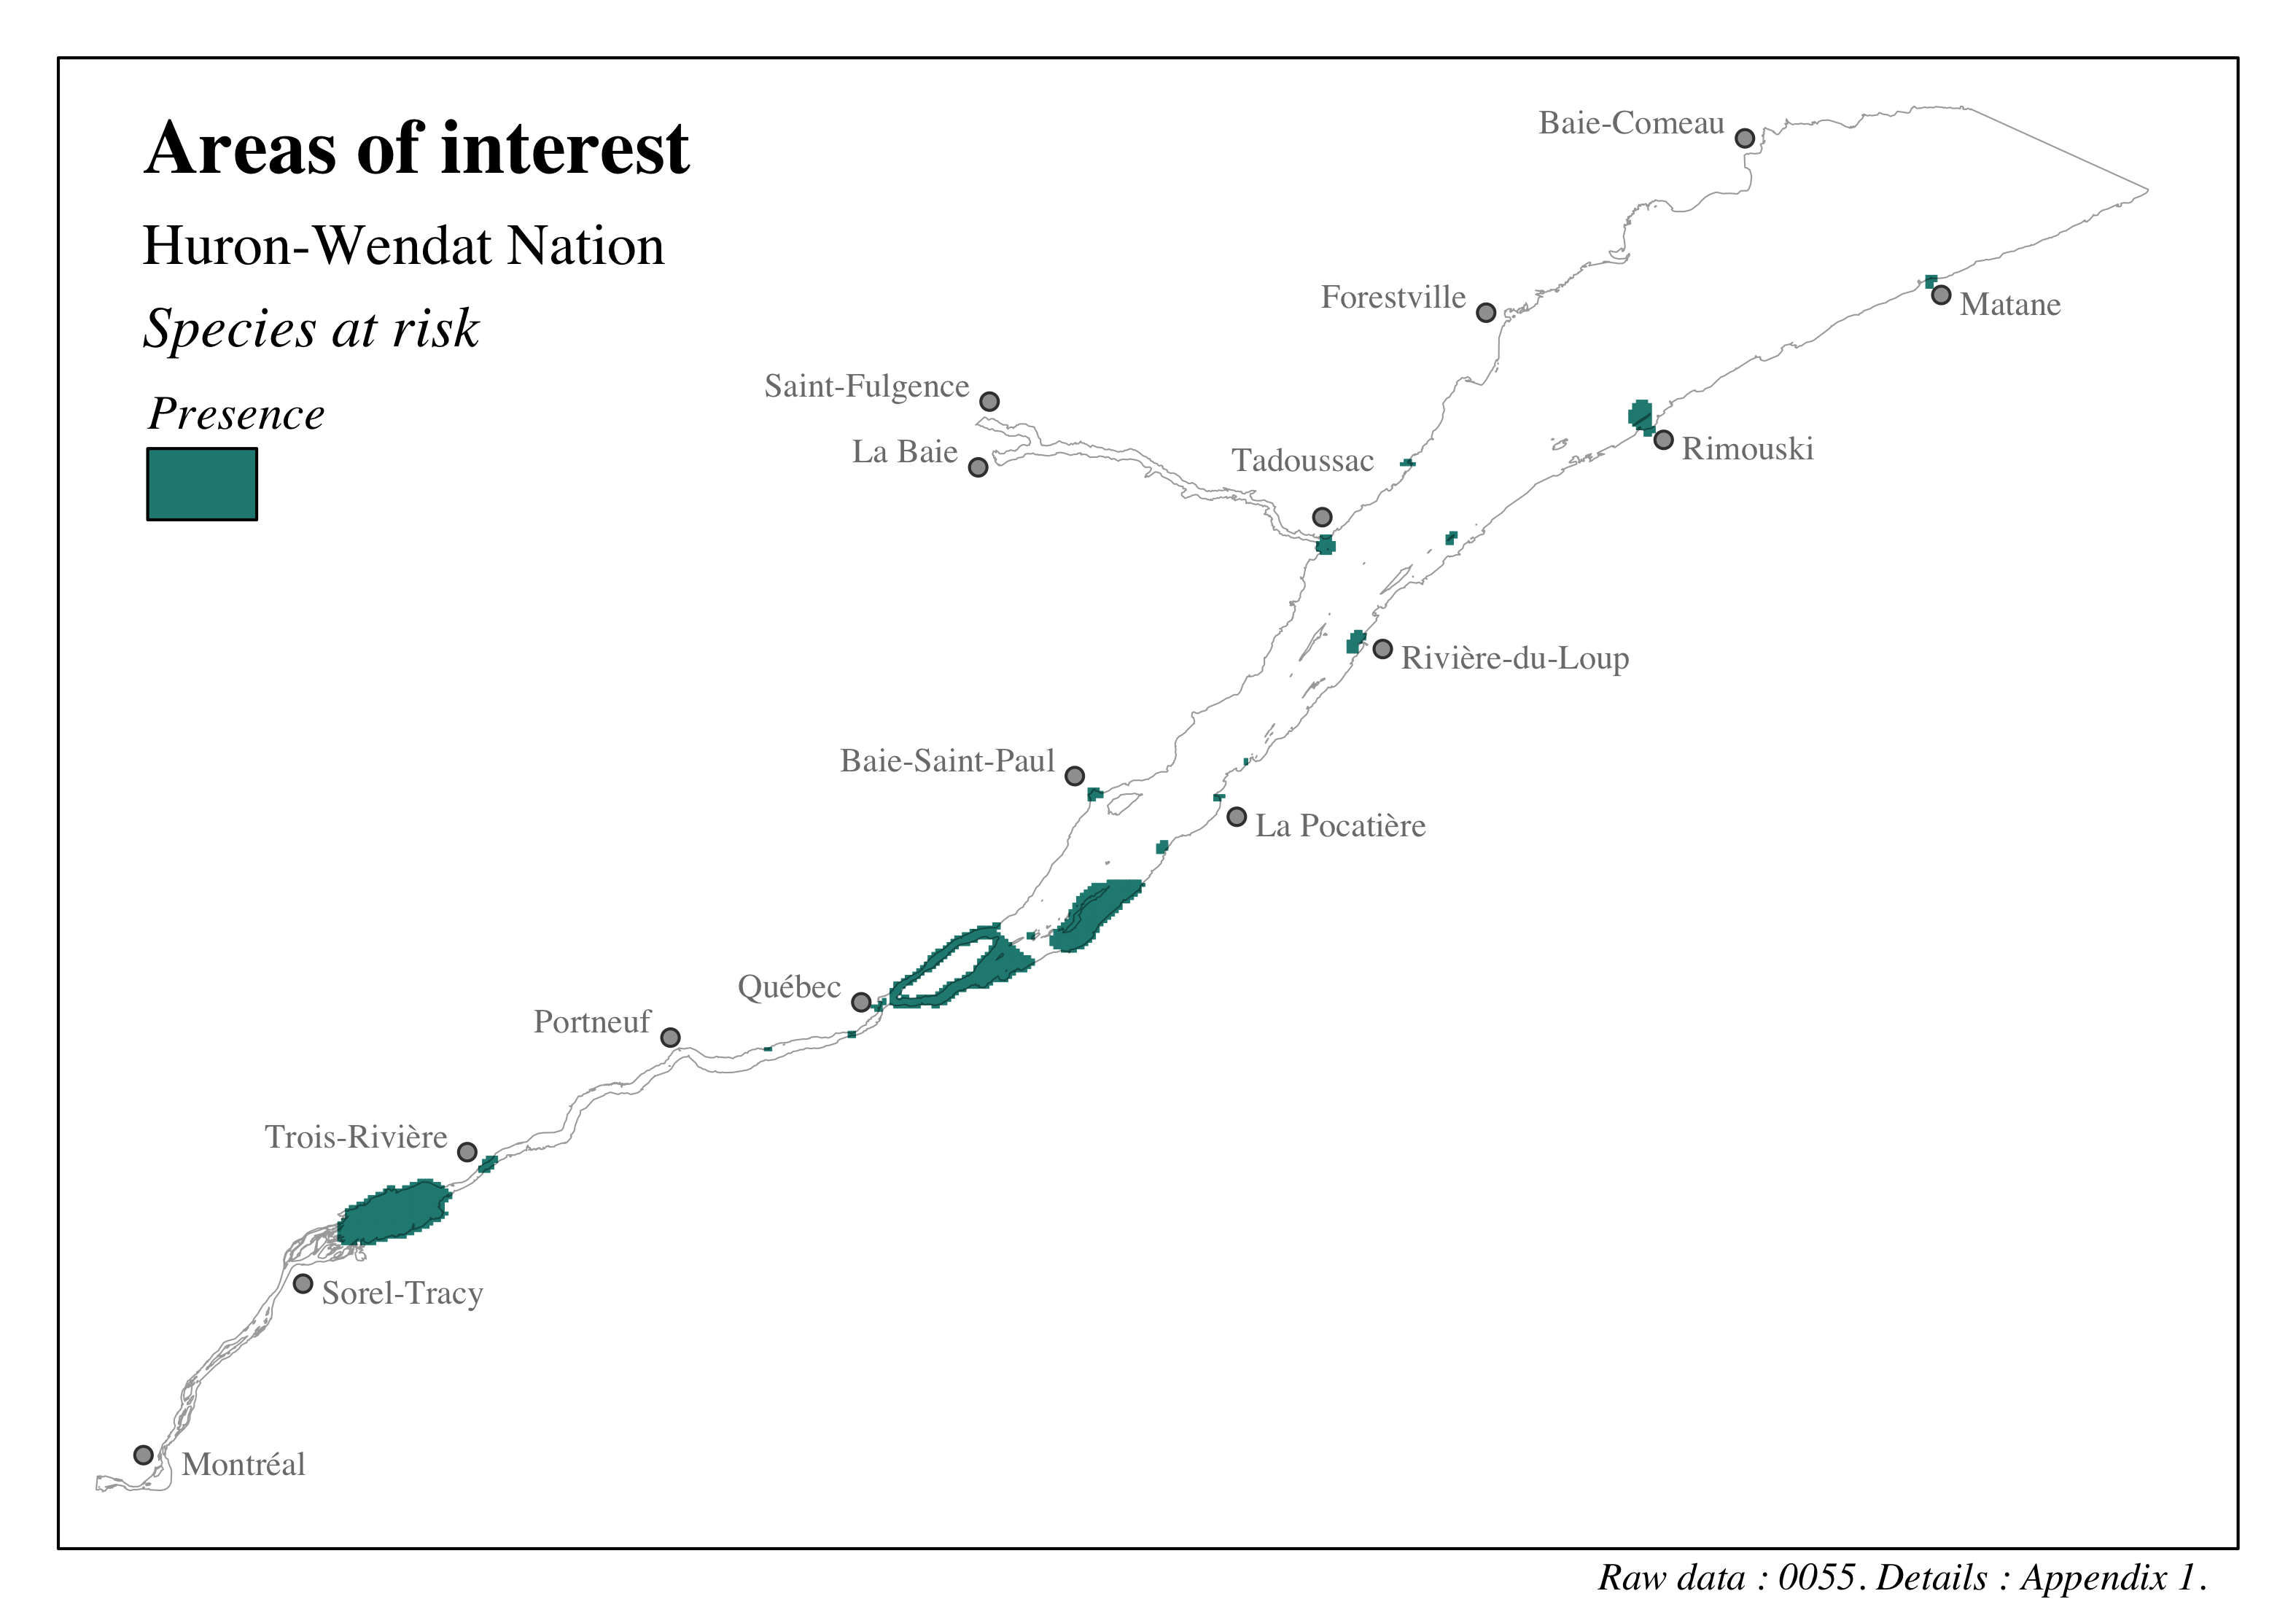
Figure 4.81: Distribution of sites of cultural, heritage and archeological interest in the St. Lawrence and the Saguenay river - Huron-Wendat Nation - Species at risk
4.3.5.1.3.3 Heritage sites

Figure 4.82: Distribution of sites of cultural, heritage and archeological interest in the St. Lawrence and the Saguenay river - Huron-Wendat Nation - Archeology

Figure 4.83: Distribution of sites of cultural, heritage and archeological interest in the St. Lawrence and the Saguenay river - Huron-Wendat Nation - History
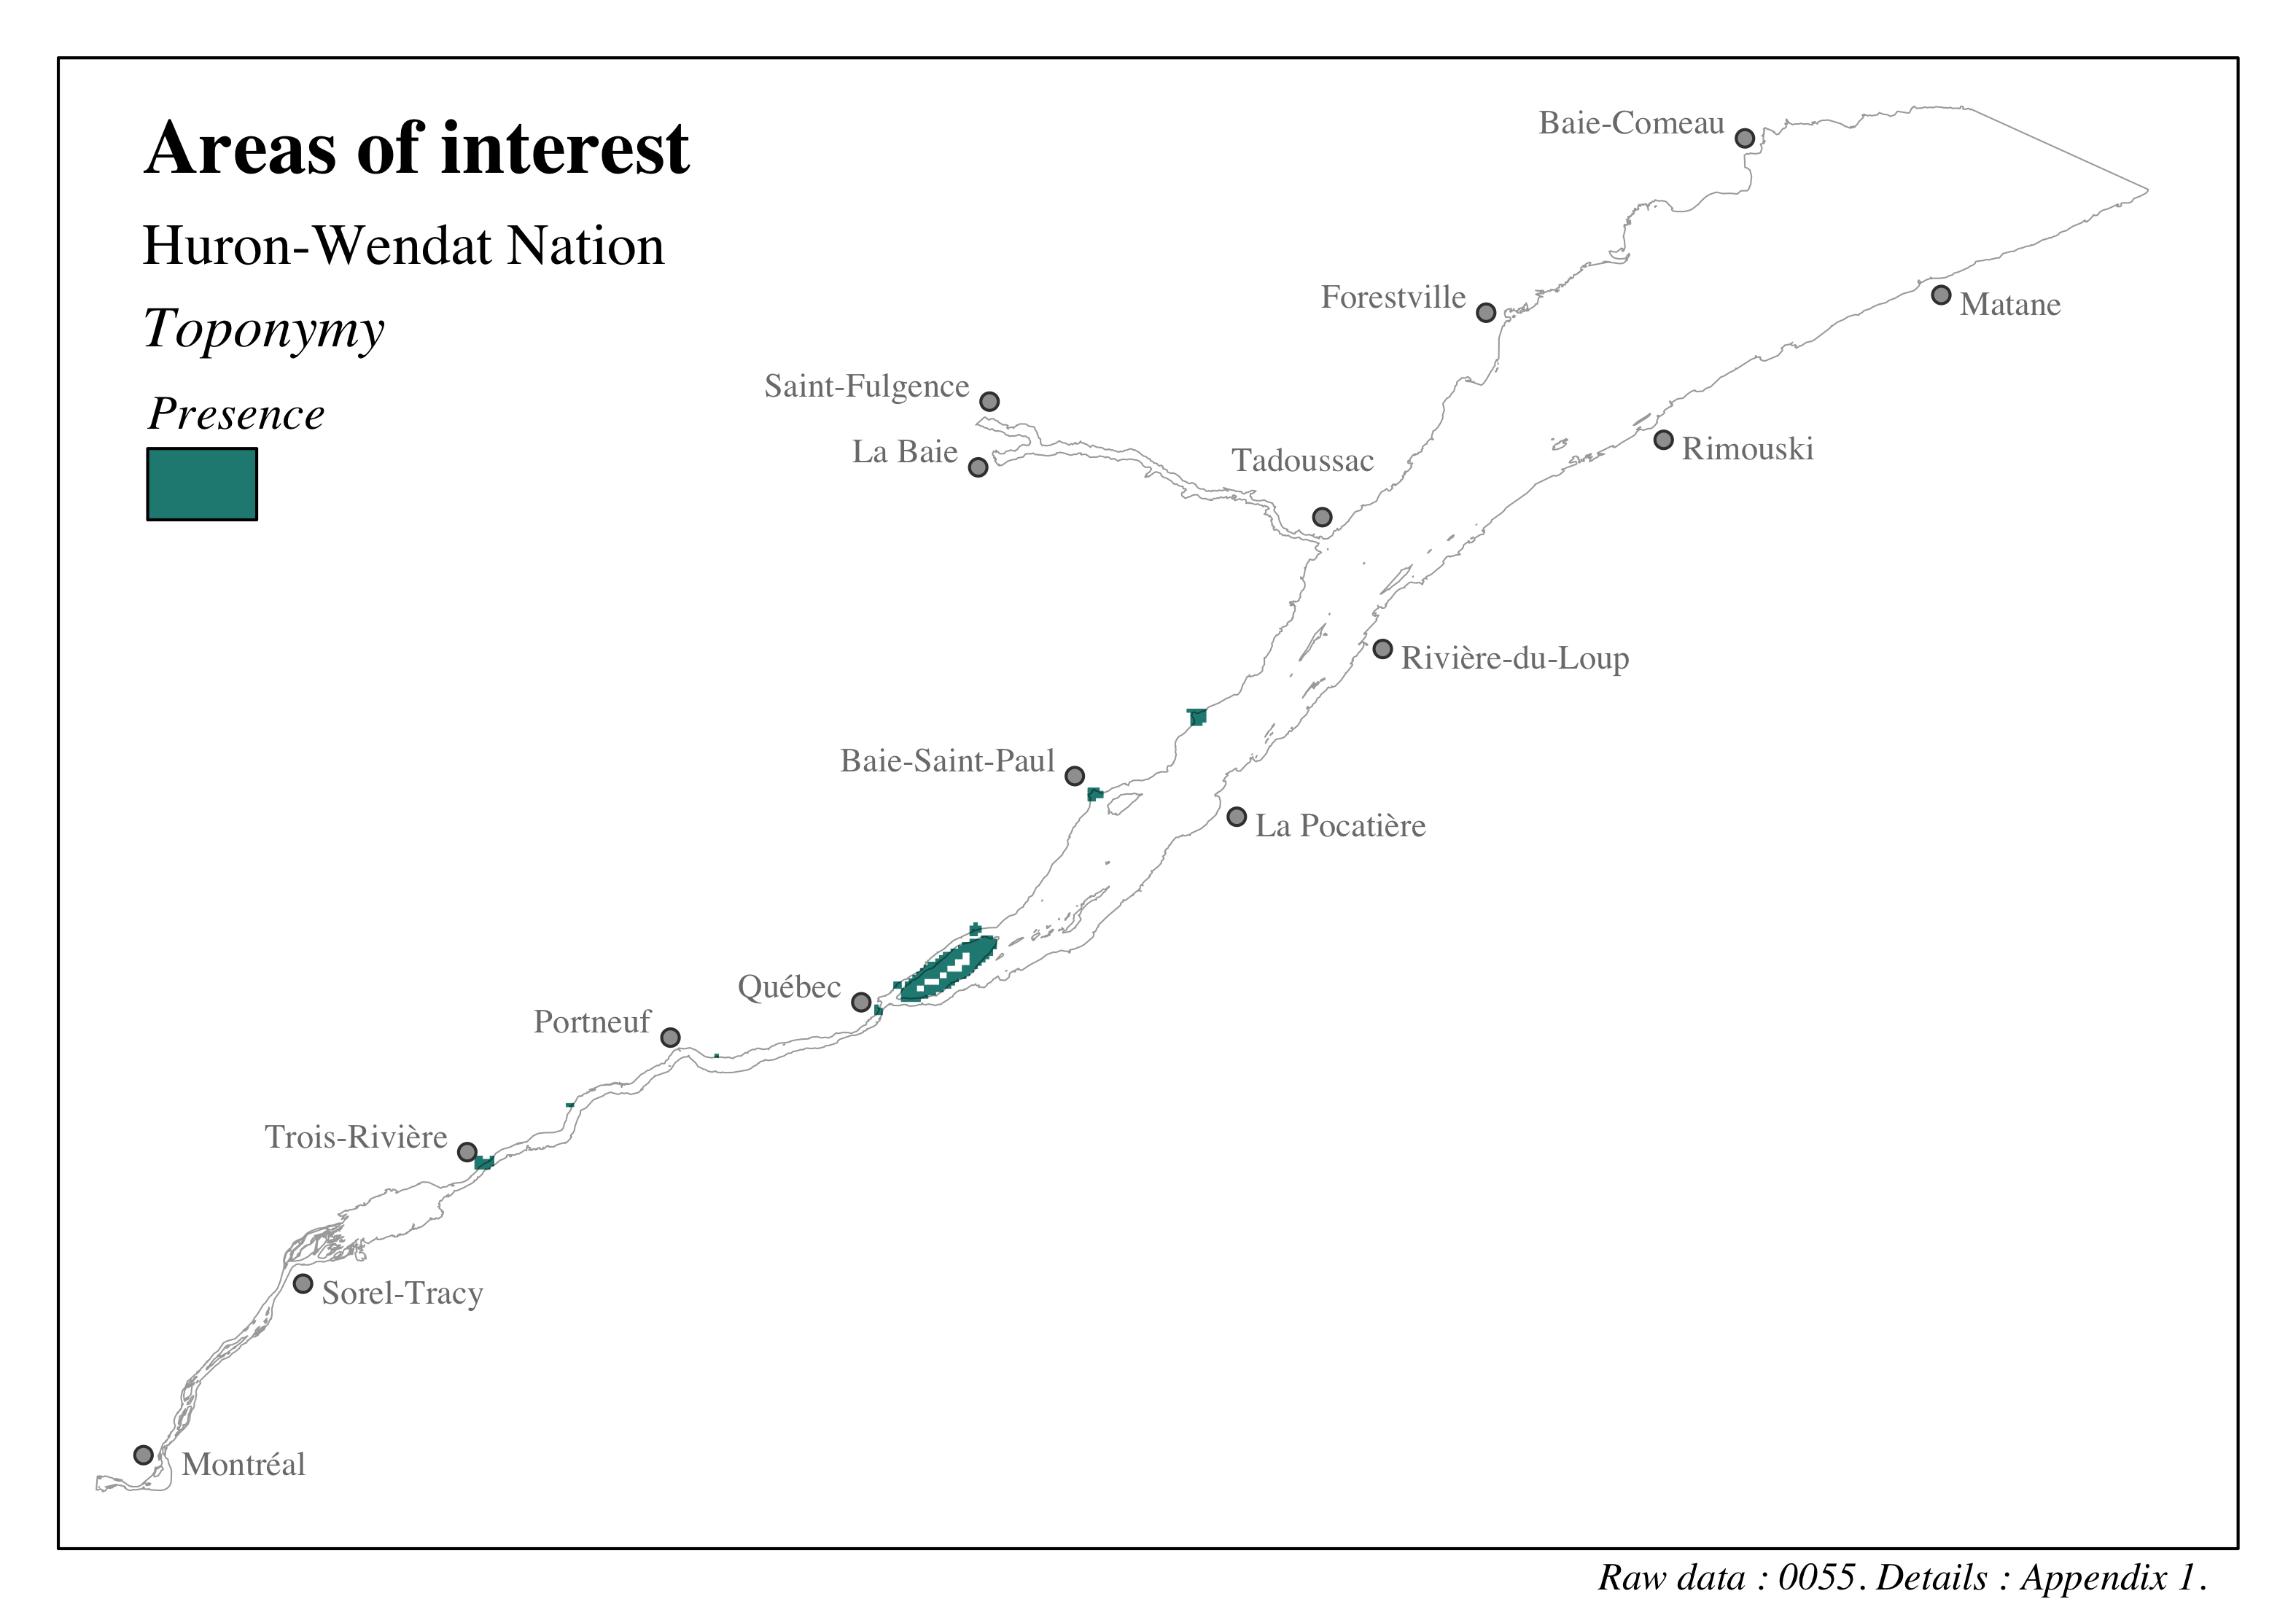
Figure 4.84: Distribution of sites of cultural, heritage and archeological interest in the St. Lawrence and the Saguenay river - Huron-Wendat Nation - Toponymy
4.3.5.1.4 Mohawk Nation of Kahnawà:ke
We thank the Mohawk Nation of Kahnawà:ke for their participation, as well as the Mohawk Council Advisory Committee of Kahnawà:ke (Comité Consultatif du Conseil Mohawk de Kahnawà:ke) for the discussions and support.
The unique identifier given to the data presented in this section is: 0032. Refer to the following section and to Appendix 1 for more details on these data.
The data transmitted by the Mohawk Nation of Kahnawà:ke provide the location of areas of interest in the fluvial portion of the St. Lawrence River in the Montreal and Lake St. Pierre area (Mohawk Council of Kahnawà:ke, 2021). The areas identified focus primarily on hunting, fishing and vegetation harvesting activities for a variety of important species, cultural sites, and the use of certain portions of the territory by the Nation. These areas can be divided into seven categories:
- Activities
- Waterfowl hunting
- Open water fishing
- Shoreline fishing
- Vegetation harvesting
- Sites of importance
- Culture and heritage
- Land use
- Seigneurie du Sault-Saint-Louis
- Shipping
The sites making up these eight categories were used for the cumulative effects assessment of marine vessel activities. It is important to note that the original data used cover a wider area than the study area of this assessment, but were intersected and limited to our study area.
A clause accompanies the shared data, which we take the liberty of transcribing in its entirety in English:
The Mohawk Council of Kahnawà:ke (MCK) has gathered some information from community members concerning the value and use of the St. Lawrence River in the vicinity of Kahnawà:ke. These comments have been organized according to the valued components identified for the fluvial section of the river through the Cumulative Effects of Marine Shipping by the Transport Canada team in collaboration with project partners. Therefore, the information provided is based on a limited consultation of community members, with the intent of responding to the specific parameters of this Transport Canada study only and should not be interpreted as a comprehensive study of Mohawk traditional land use or rights throughout the study area. The information provided should also not be used to replace engagement, including the gathering of traditional land use information within the context of any other future study or project. In addition, our participation in this study is without prejudice to the exercise of our jurisdictional rights to our traditional territory to which our stewardship rights and responsibilities apply and that are based on the application of a broader ecosystem-based approach. Therefore, the identification of specific areas of concern or value, including the identification of specific fish species or archeological sites of interest is to be understood within the context of these broader rights and responsibilities.
Although data were provided by the Mohawk Nation of Kahnawà:ke and incorporated into the cumulative effects assessment, it was requested that maps of identified sites not be presented. For more information, please contact the Mohawk Council of Kahnawà:ke. The original request to remove the figures is as follows:
The Mohawk Council of Kahnawà:ke provided information concerning some known sites of interest related to the activities mentioned above. These data were incorporated into the cumulative effects assessment however it was requested that the delineation of these areas not be shown within this report. For further information on this data, please contact the Mohawk Council of Kahnawà:ke
4.3.5.1.5 W8banaki Nation
We thank the W8banaki Nation for their participation, as well as the Grand Council of the Waban-Aki Nation, Edgar Blanchet, Hadrien Bois and David Bernard for the discussions and support.
The unique identifiers given to the data presented in this section are: 0066, 0067, 0068. Refer to the following section and to Appendix 1 for more details on these data.
As part of this pilot project, the Grand Council of the Waban-Aki Nation (Grand Conseil de la Nation Waban-Aki, GCNWA) integrated spatialized and non-spatialized information from semi-directed individual and small group land use interviews previously conducted with members of the Nation. These studies include a sample of 33 respondents from 74 interviews. The mapping is supported by qualitative information primarily from 1) two focus group workshops held in 2016, workshop interviews held between 2019 and 2020 with women from the Nation, and 3) impact assessment analyses of port expansion projects on the Nation’s ancestral rights. This integrative work has led to the production of a report outlining the known concerns of some Nation members about environmental pressures within their territory affecting the valued components covered by our marine vessel activities cumulative effects assessment (Grand Conseil de la Nation Waban-Aki (GCNWA), 2021).
The data provided by the GCNWA provide the location of areas of interest primarily in the fluvial portion of the St. Lawrence River (Grand Conseil de la Nation Waban-Aki (GCNWA), 2021). The identified sites are divided into 13 distinct categories:
- Contemporary land use and occupation
- Fishing (e.g. perch, walleye, sturgeon)
- Migratory bird hunting (e.g. snow geese, Canada geese)
- Game hunting (e.g. white-tailed deer, ruffed grouse)
- Trapping of furbearing species (e.g. muskrat, snowshoe hare)
- Harvesting and gathering of vegetation (e.g. cattail, fiddlehead)
- Shipping
- Overnight site (e.g. camps)
- Essential sites (e.g. baiting sites, calling sites)
- Activity areas (e.g. hunting area, trapping area)
- Problems related to the territory (e.g. site to which access has been lost)
- Heritage, cultural and archeological sites
- Cultural sites (e.g. gathering site, sacred or ritual place)
- Archeological sites
- Sites with archeological potential
These categories of areas of interest are used in the marine vessel activities cumulative effects assessment in the study area. It is important to note that the original data used cover a wider area than the study area of this assessment, but were intersected and limited to our study area.
4.3.5.1.5.1 Contemporary land use and occupation
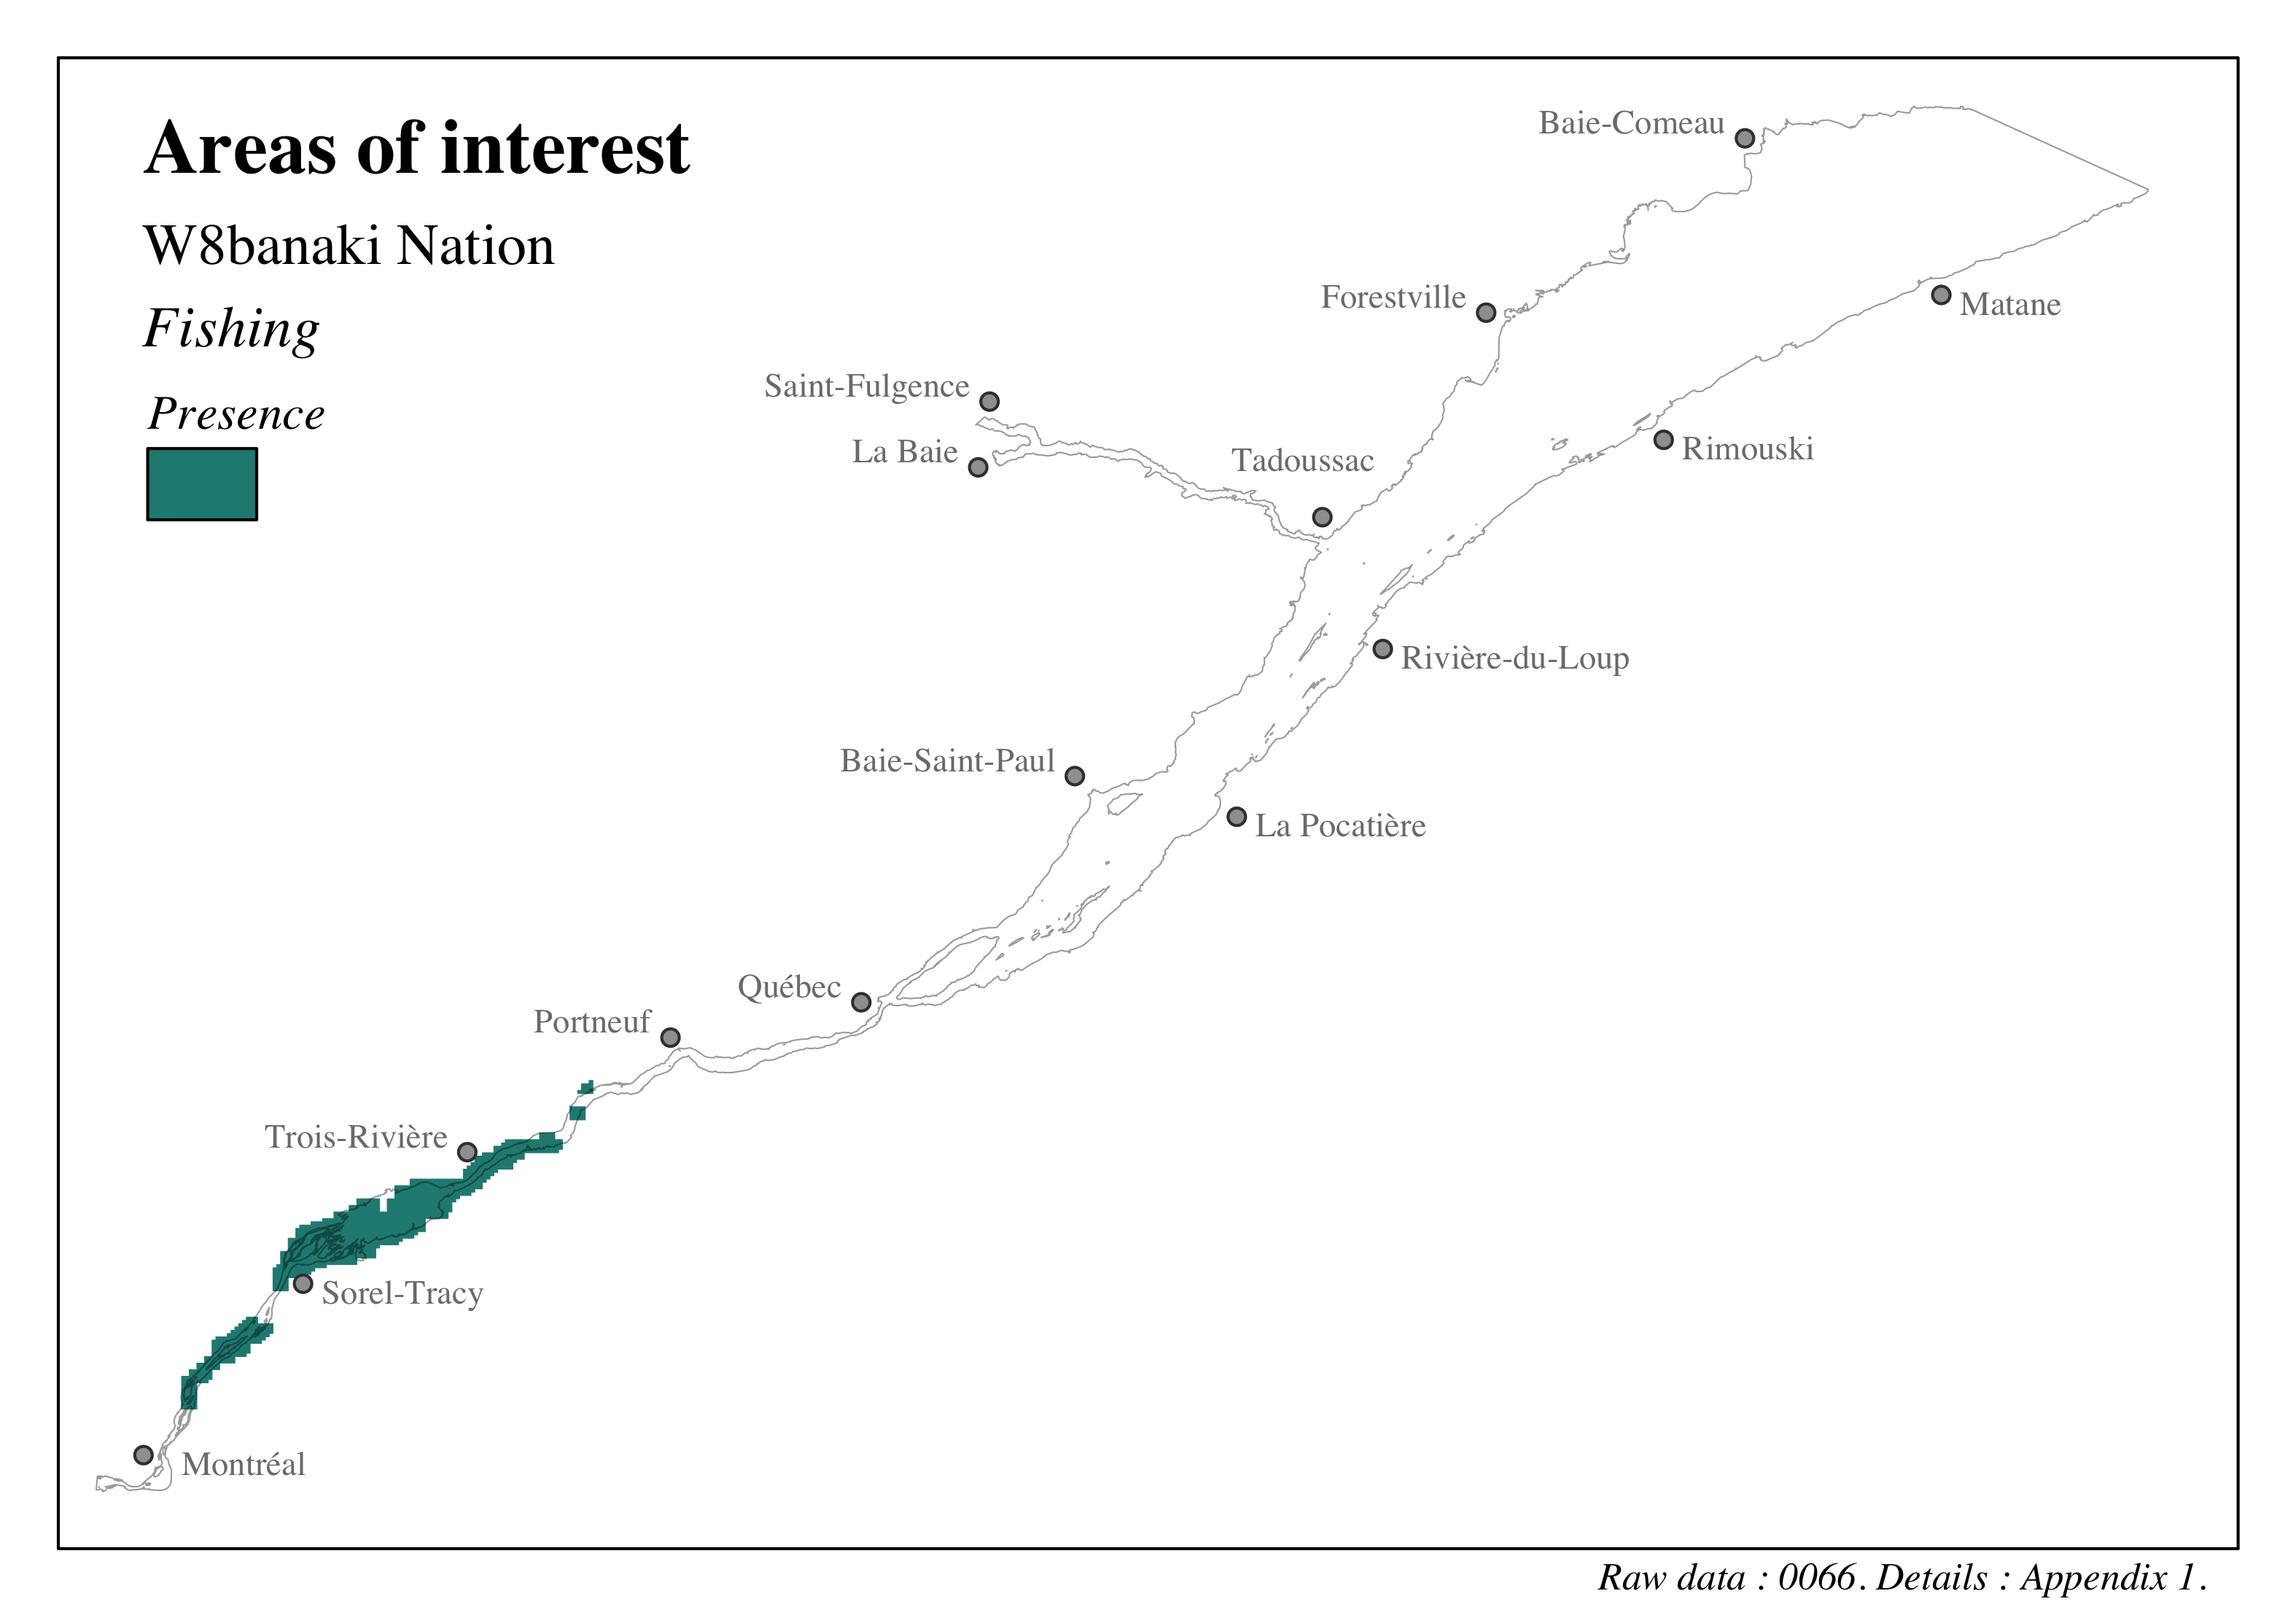
Figure 4.85: Distribution of sites of cultural, heritage and archeological interest in the St. Lawrence and the Saguenay river - W8banaki Nation - Fishing
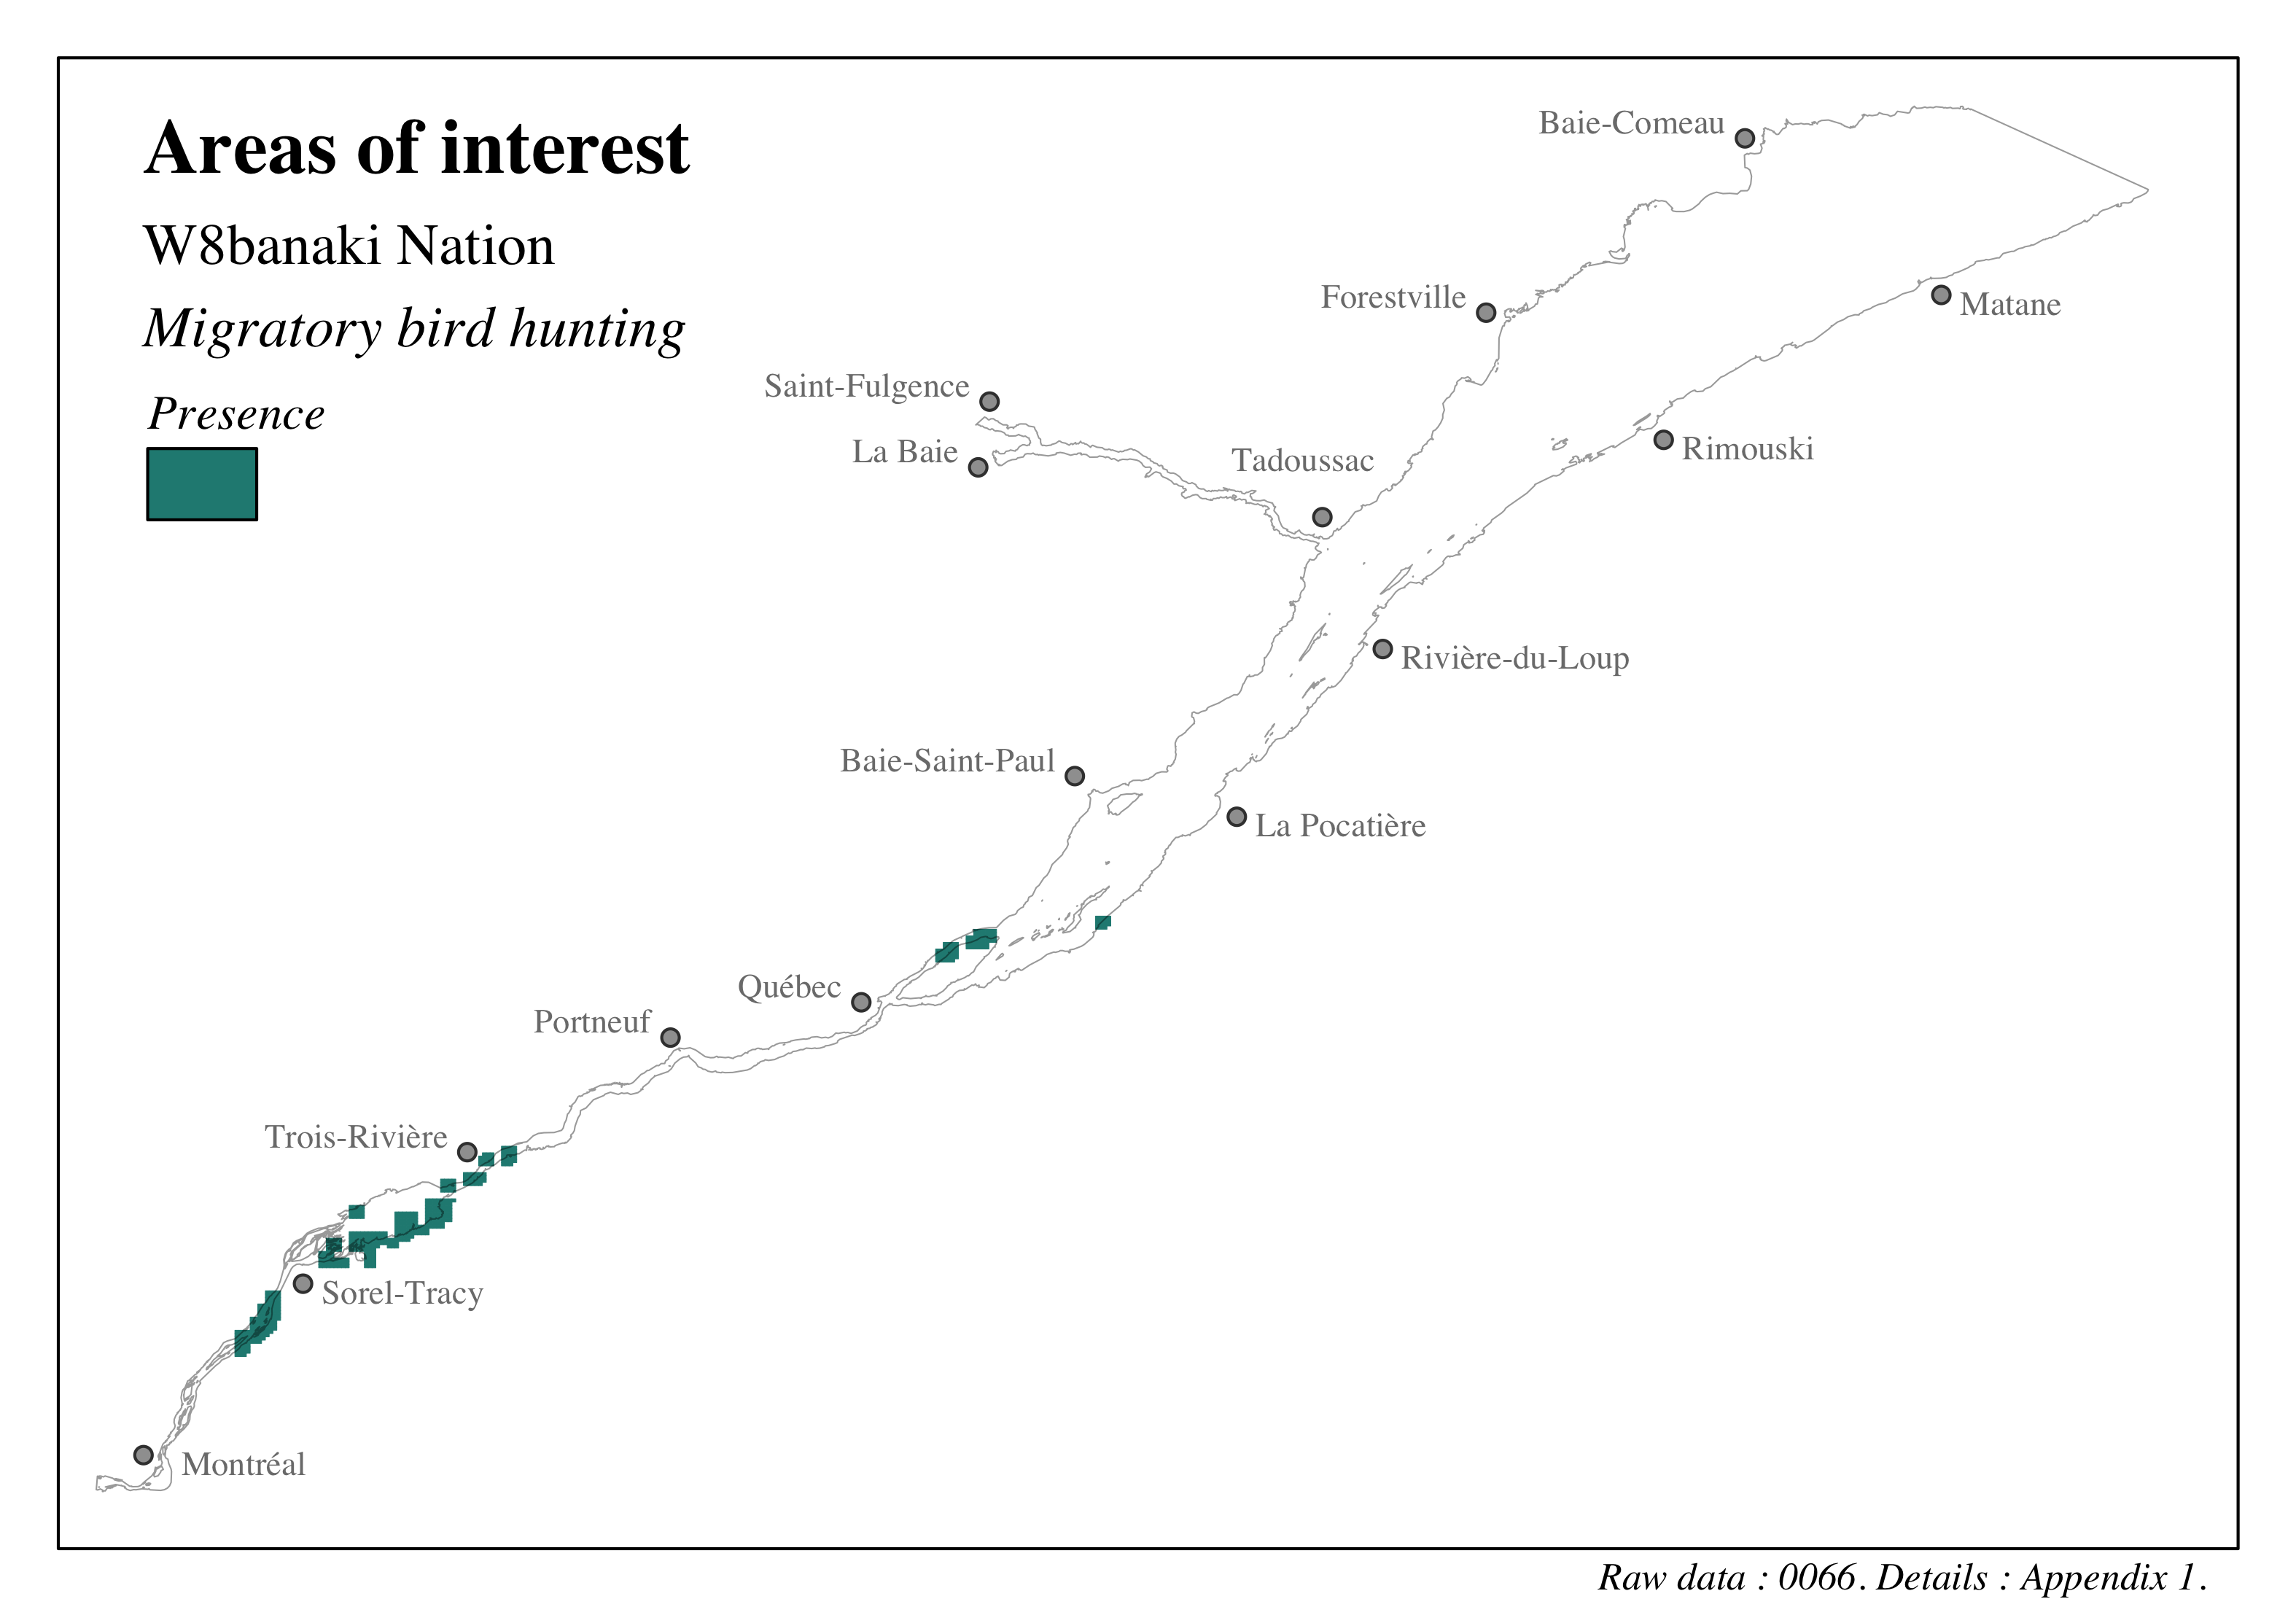
Figure 4.86: Distribution of sites of cultural, heritage and archeological interest in the St. Lawrence and the Saguenay river - W8banaki Nation - Migratory bird hunting

Figure 4.87: Distribution of sites of cultural, heritage and archeological interest in the St. Lawrence and the Saguenay river - W8banaki Nation - Game hunting

Figure 4.88: Distribution of sites of cultural, heritage and archeological interest in the St. Lawrence and the Saguenay river - W8banaki Nation - Fur trapping

Figure 4.89: Distribution of sites of cultural, heritage and archeological interest in the St. Lawrence and the Saguenay river - W8banaki Nation - Picking and gathering vegetation
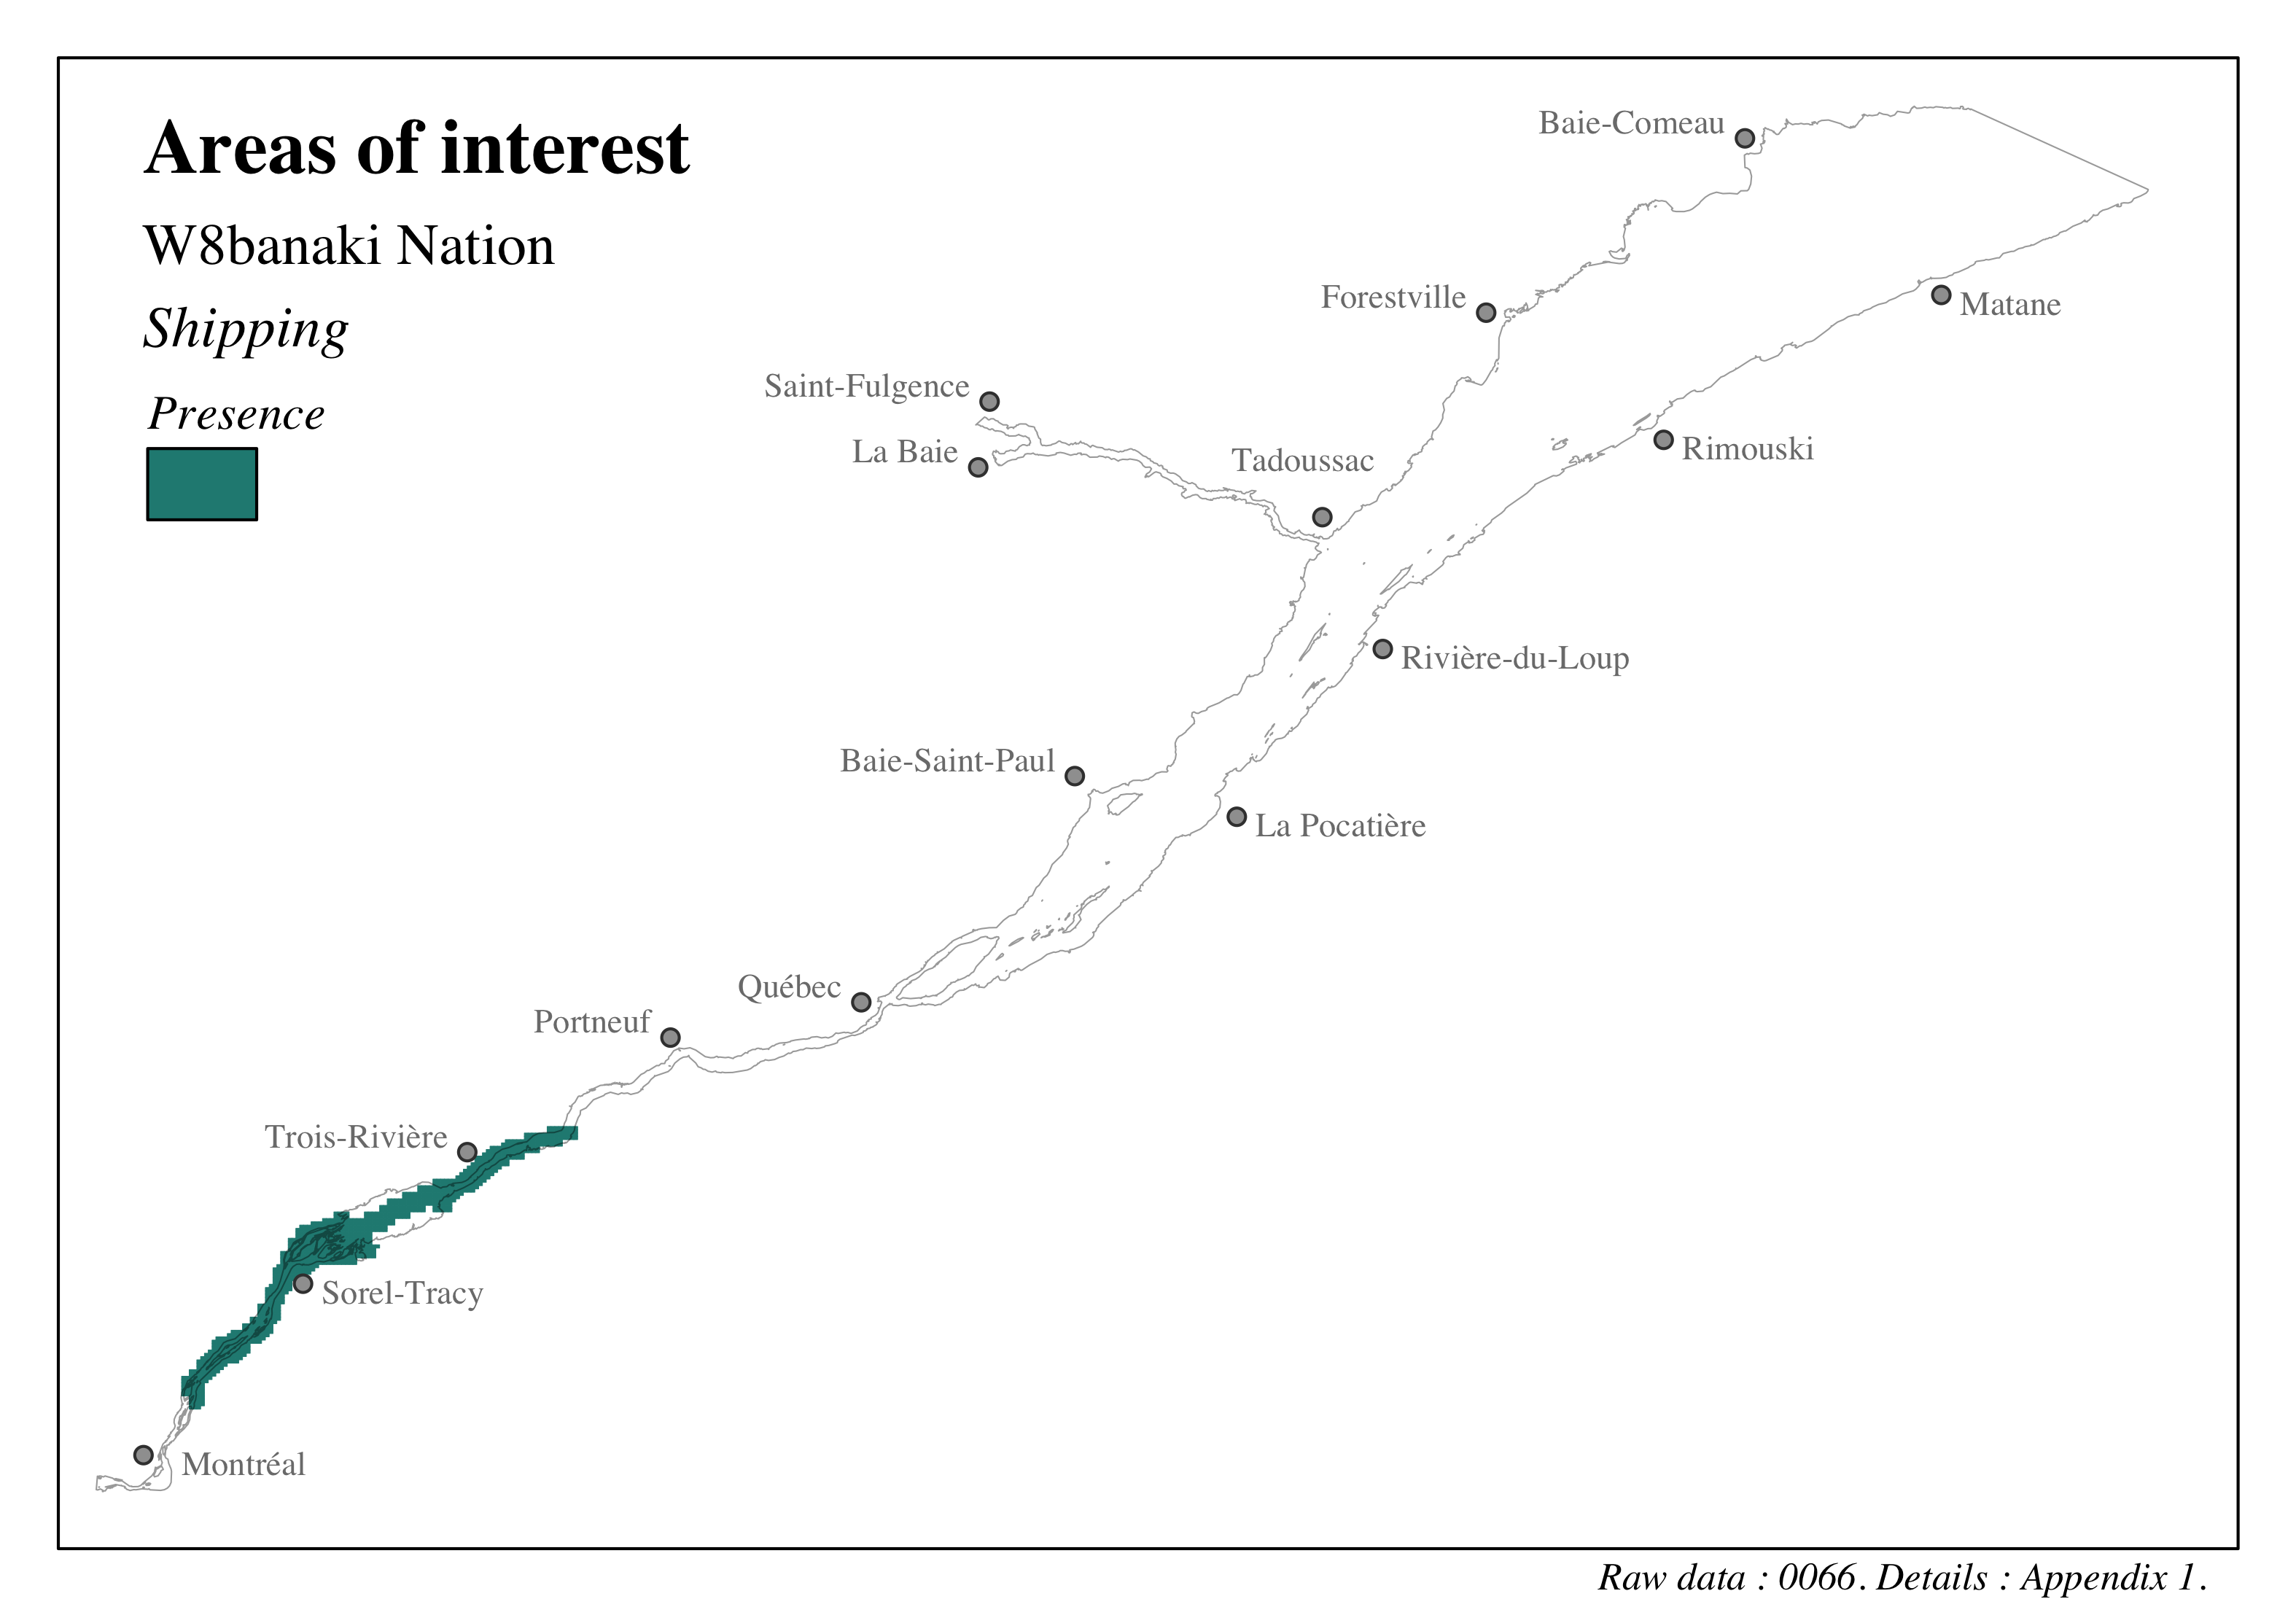
Figure 4.90: Distribution of sites of cultural, heritage and archeological interest in the St. Lawrence and the Saguenay river - W8banaki Nation - Shipping
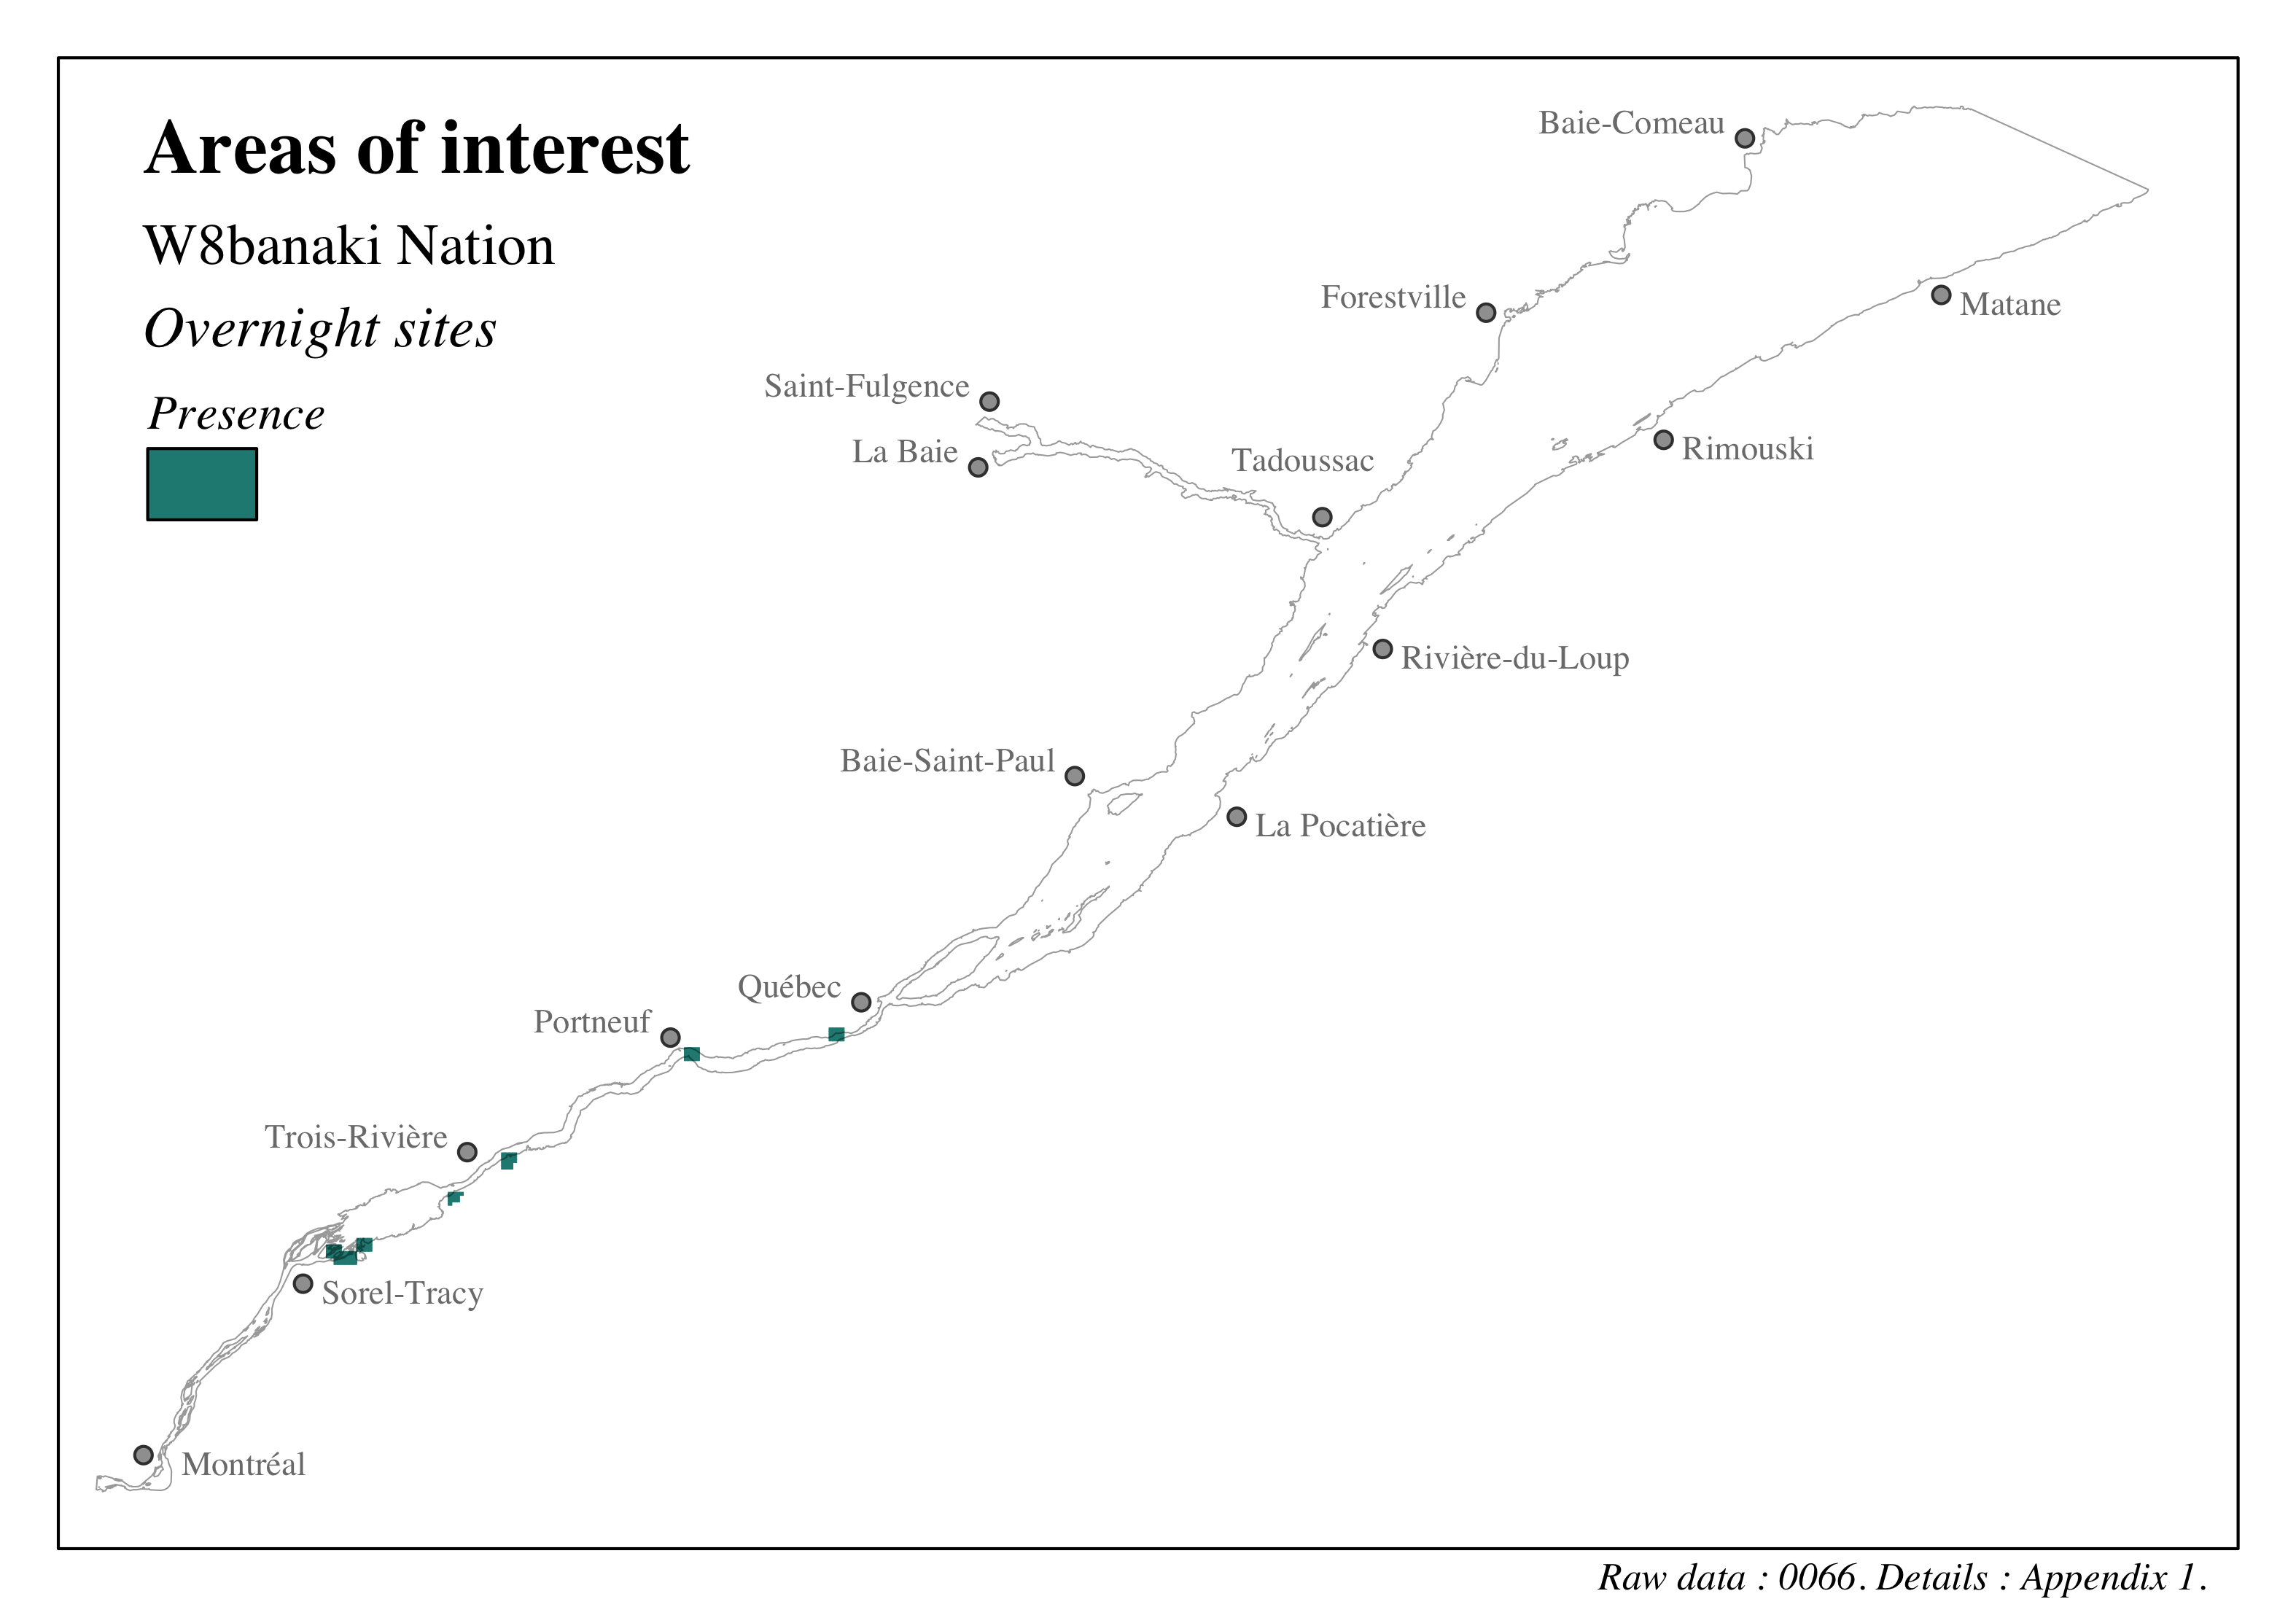
Figure 4.91: Distribution of sites of cultural, heritage and archeological interest in the St. Lawrence and the Saguenay river - W8banaki Nation - Overnight sites

Figure 4.92: Distribution of sites of cultural, heritage and archeological interest in the St. Lawrence and the Saguenay river - W8banaki Nation - Essential sites
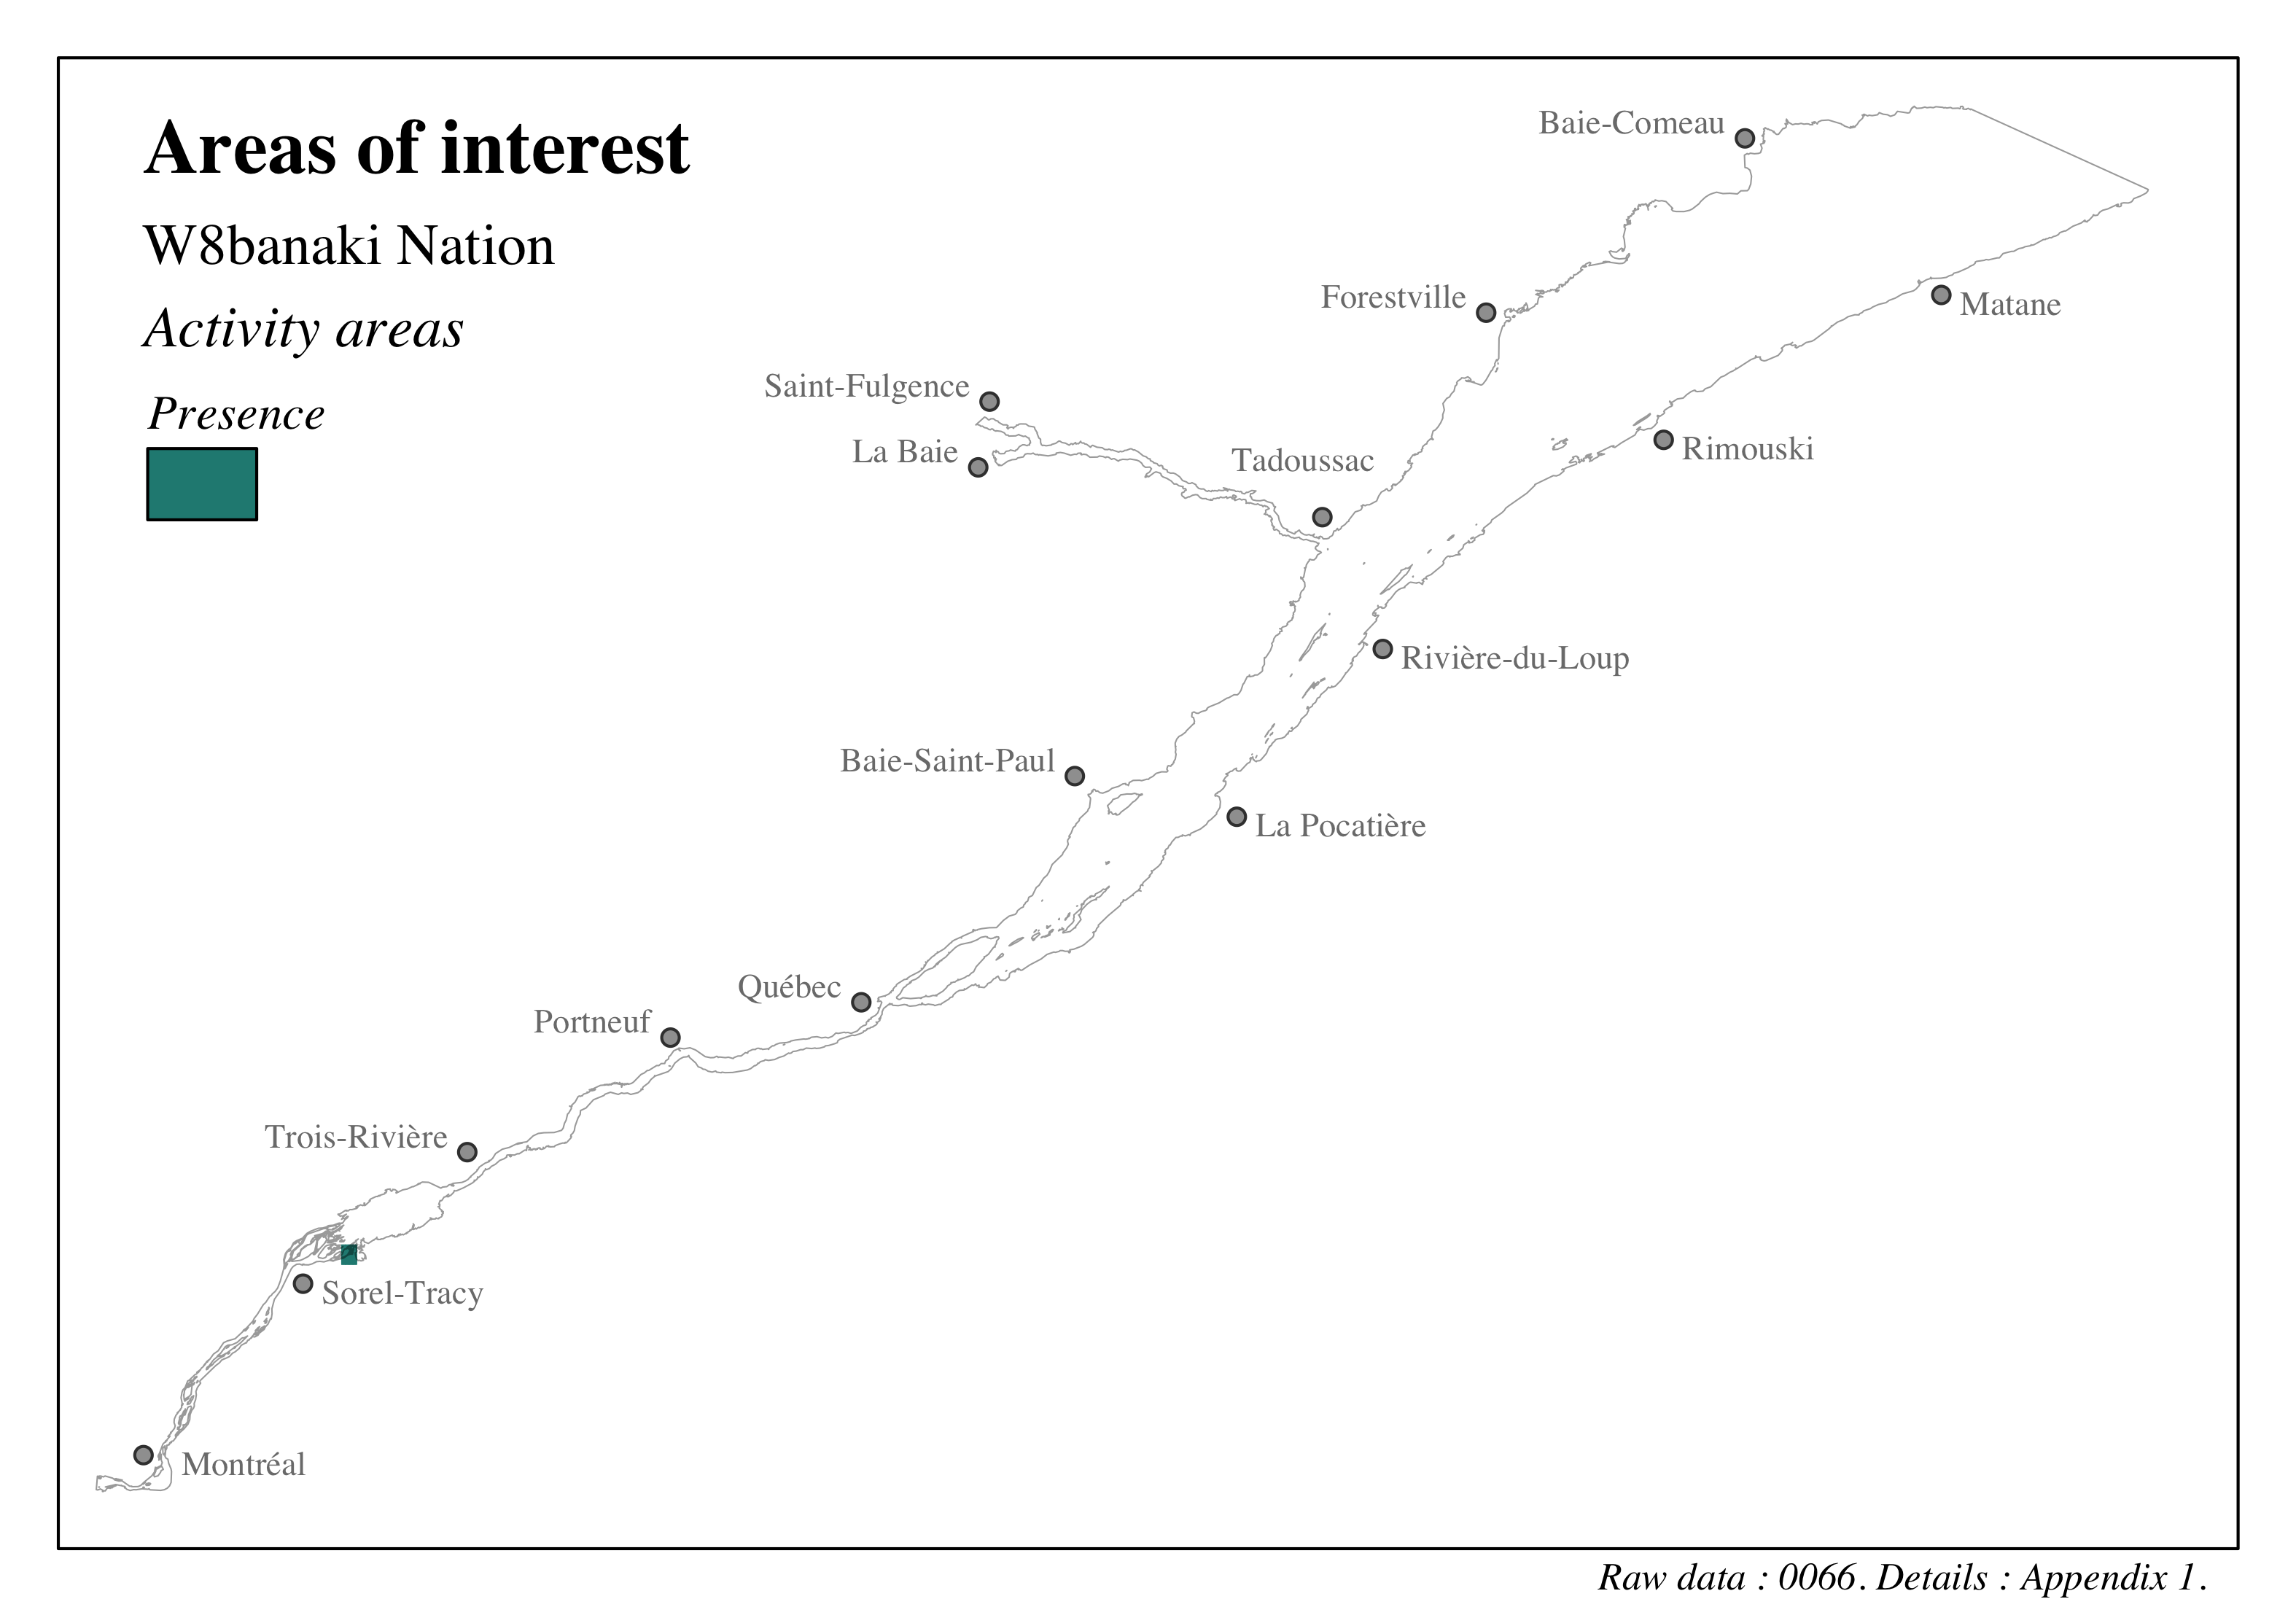
Figure 4.93: Distribution of sites of cultural, heritage and archeological interest in the St. Lawrence and the Saguenay river - W8banaki Nation - Activity areas

Figure 4.94: Distribution of sites of cultural, heritage and archeological interest in the St. Lawrence and the Saguenay river - W8banaki Nation - Access to territory problems
4.3.5.1.5.2 Heritage, cultural and archeological sites

Figure 4.95: Distribution of sites of cultural, heritage and archeological interest in the St. Lawrence and the Saguenay river - W8banaki Nation - Cultural sites

Figure 4.96: Distribution of sites of cultural, heritage and archeological interest in the St. Lawrence and the Saguenay river - W8banaki Nation - Archeological sites
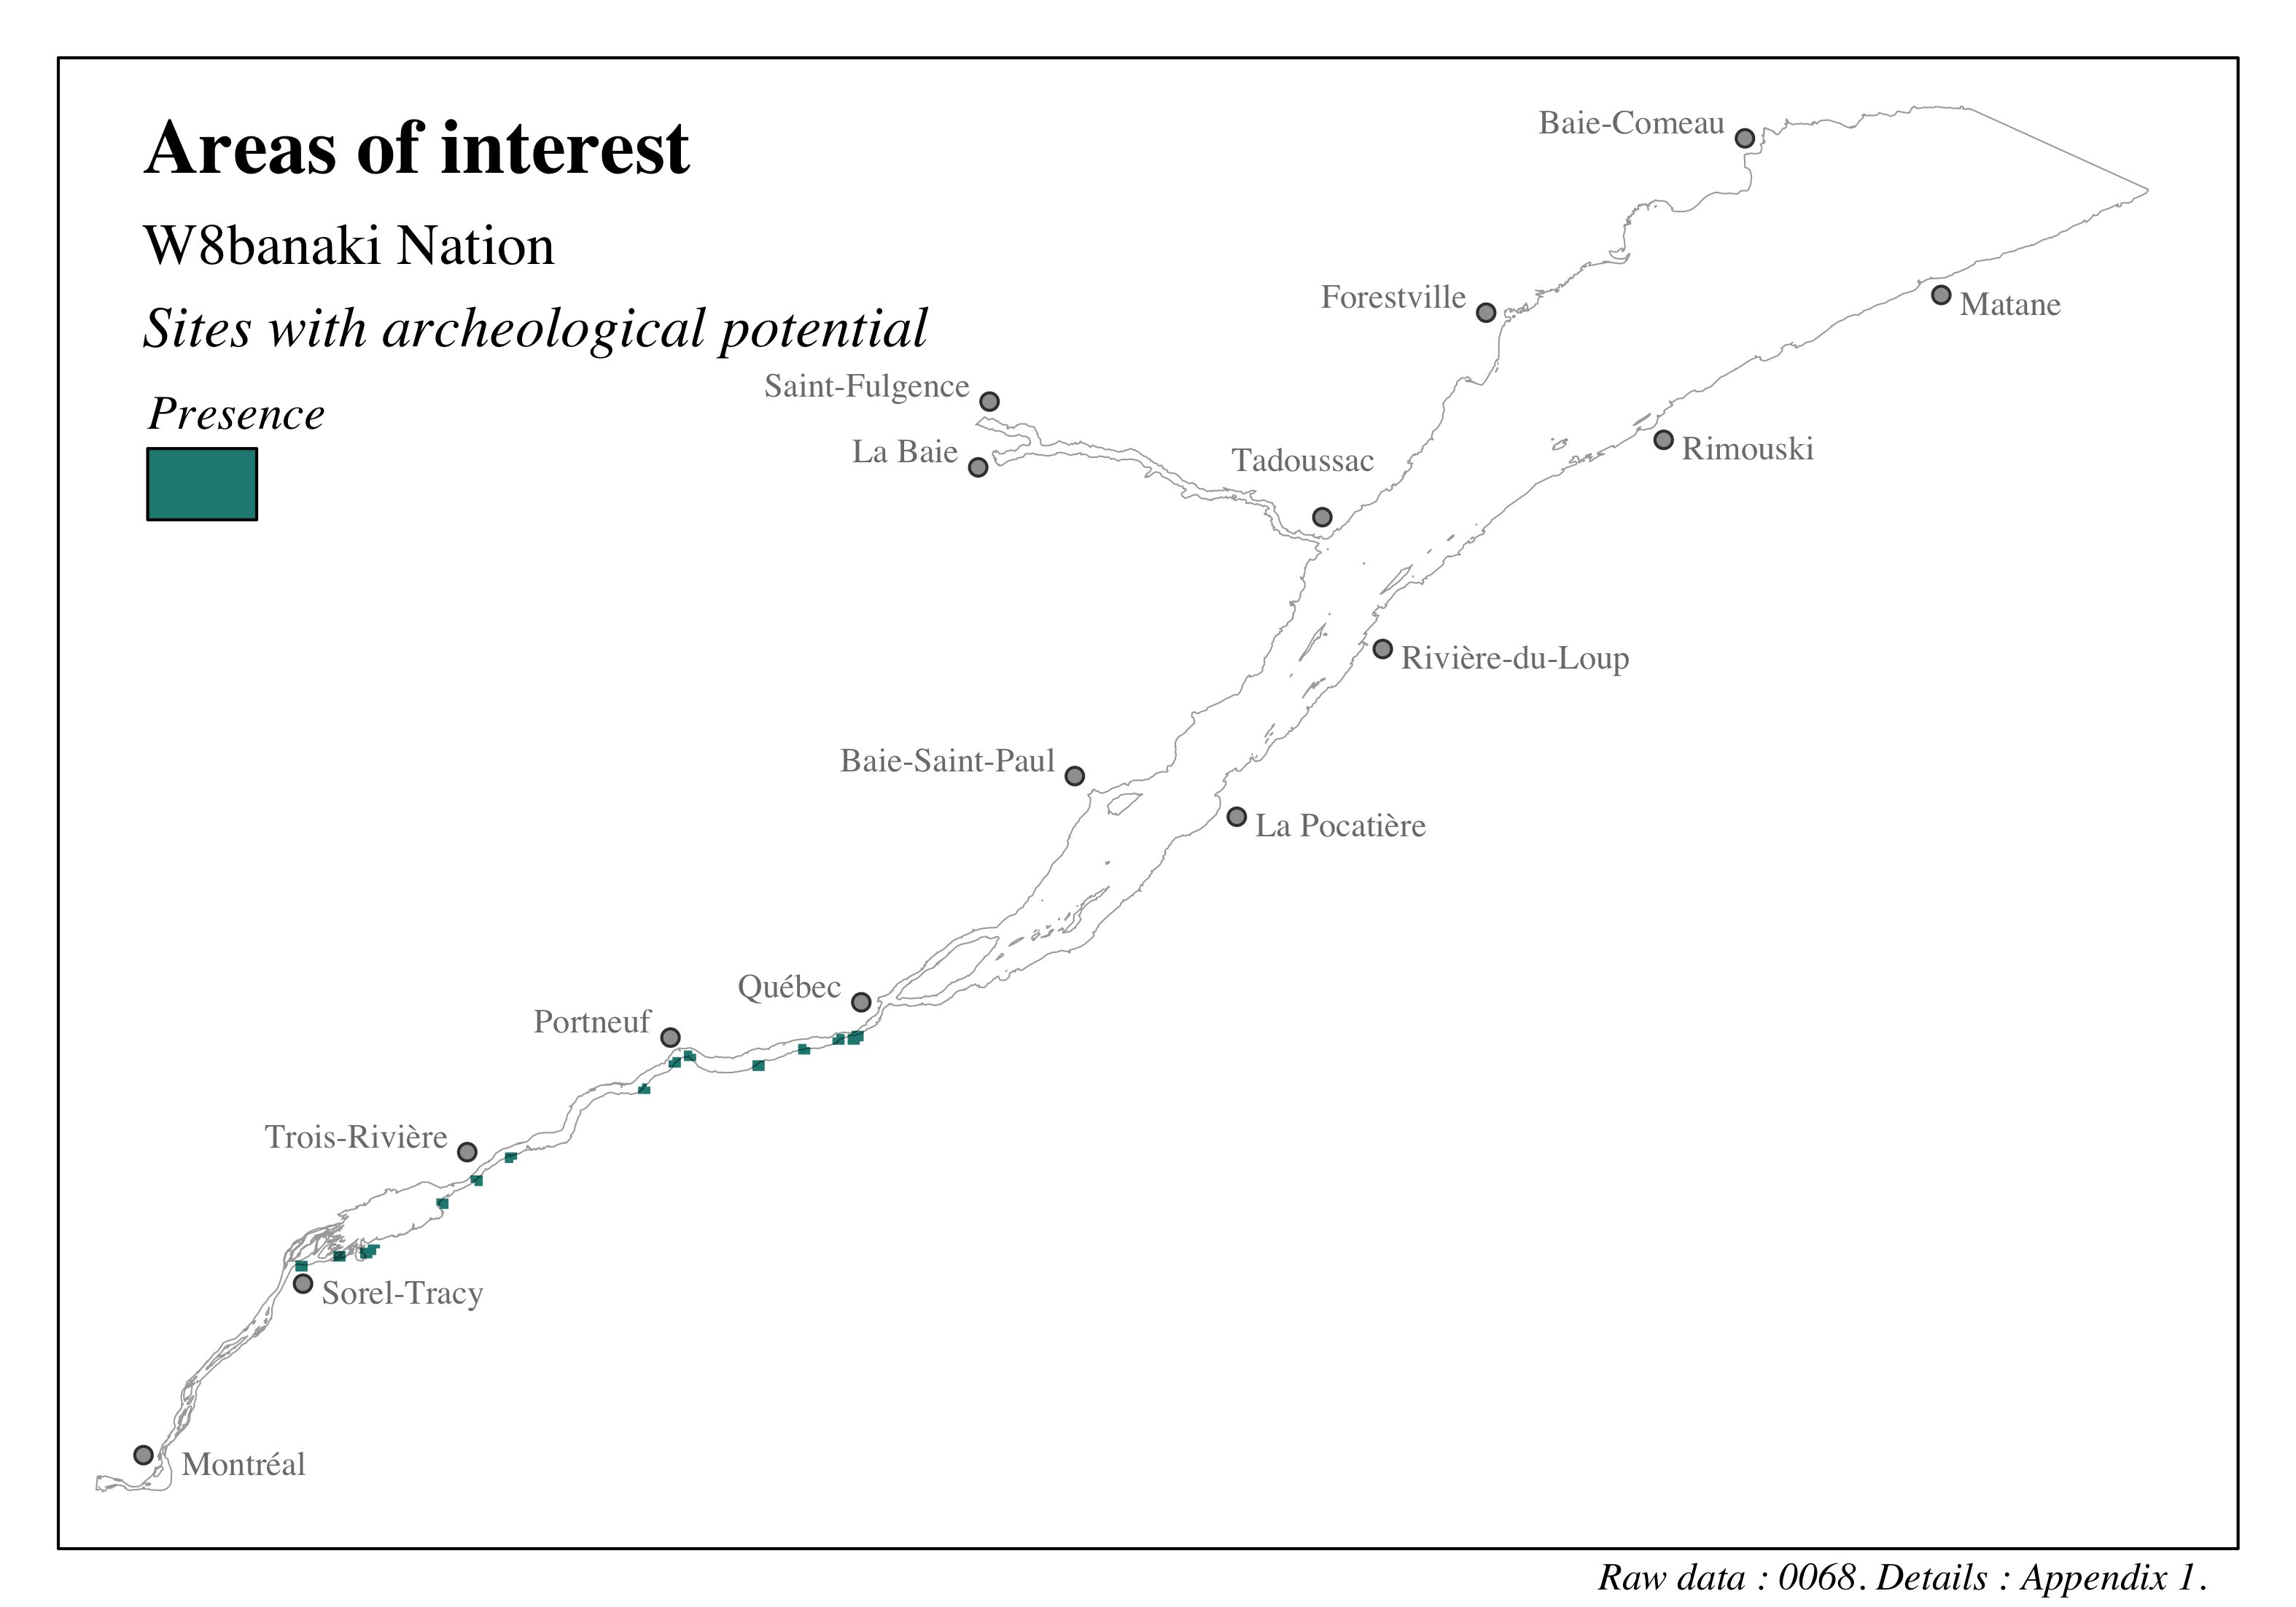
Figure 4.97: Distribution of sites of cultural, heritage and archeological interest in the St. Lawrence and the Saguenay river - W8banaki Nation - Sites with archeological potential
4.3.5.1.6 Wolastoqiyik Wahsipekuk Nation
We thank the Wolastoqiyik Wahsipekuk Nation for their participation, as well as David Poissant for the discussions and support.
The unique identifiers given to the data presented in this section are: 0022, 0025, 0072. Refer to the following section and to Appendix 1 for more details on these data.
We are using data provided to us by representatives of the Wolastoqiyik Wahsipekuk Nation to characterize sites of importance to the commercial lobster [Homarus americanus; Wahsipekuk (2021a)] fishery. These data identify environments deemed important to fishing on the south shore of the St. Lawrence. These data were complemented with data from the MMAFMA (see section 4.3.5.1.1) on commercial fishing of whelk (Buccinum sp.), sea cucumber (Holothuria sp.), rock crab (Cancer irroratus), snow crab (Chionoecetes opilio), northern shrimp (Pandalus sp.), Atlantic halibut (Hippoglossus hippoglossus), Greenland halibut (Reinhardtius hippoglossoides), lobster (Homarus americanus), and sea urchin (Strongylocentrotus sp.) in the St. Lawrence Estuary (Arsenault et al., 2017; Racine and Arsenault, 2017).
Two areas of interest for beluga whale watching and harbour development are also considered areas of interest for the Wolastoqiyik Wahsipekuk Nation (Wahsipekuk, 2022). It is important to note, however, that despite the inclusion of areas of interest to the Wolastoqiyik Wahsipekuk Nation, a collaborative process similar to that carried out with the other Nations could not be established. This means that the socio-cultural data of the Wolastoqiyik Wahsipekuk Nation could not be included in our assessment.
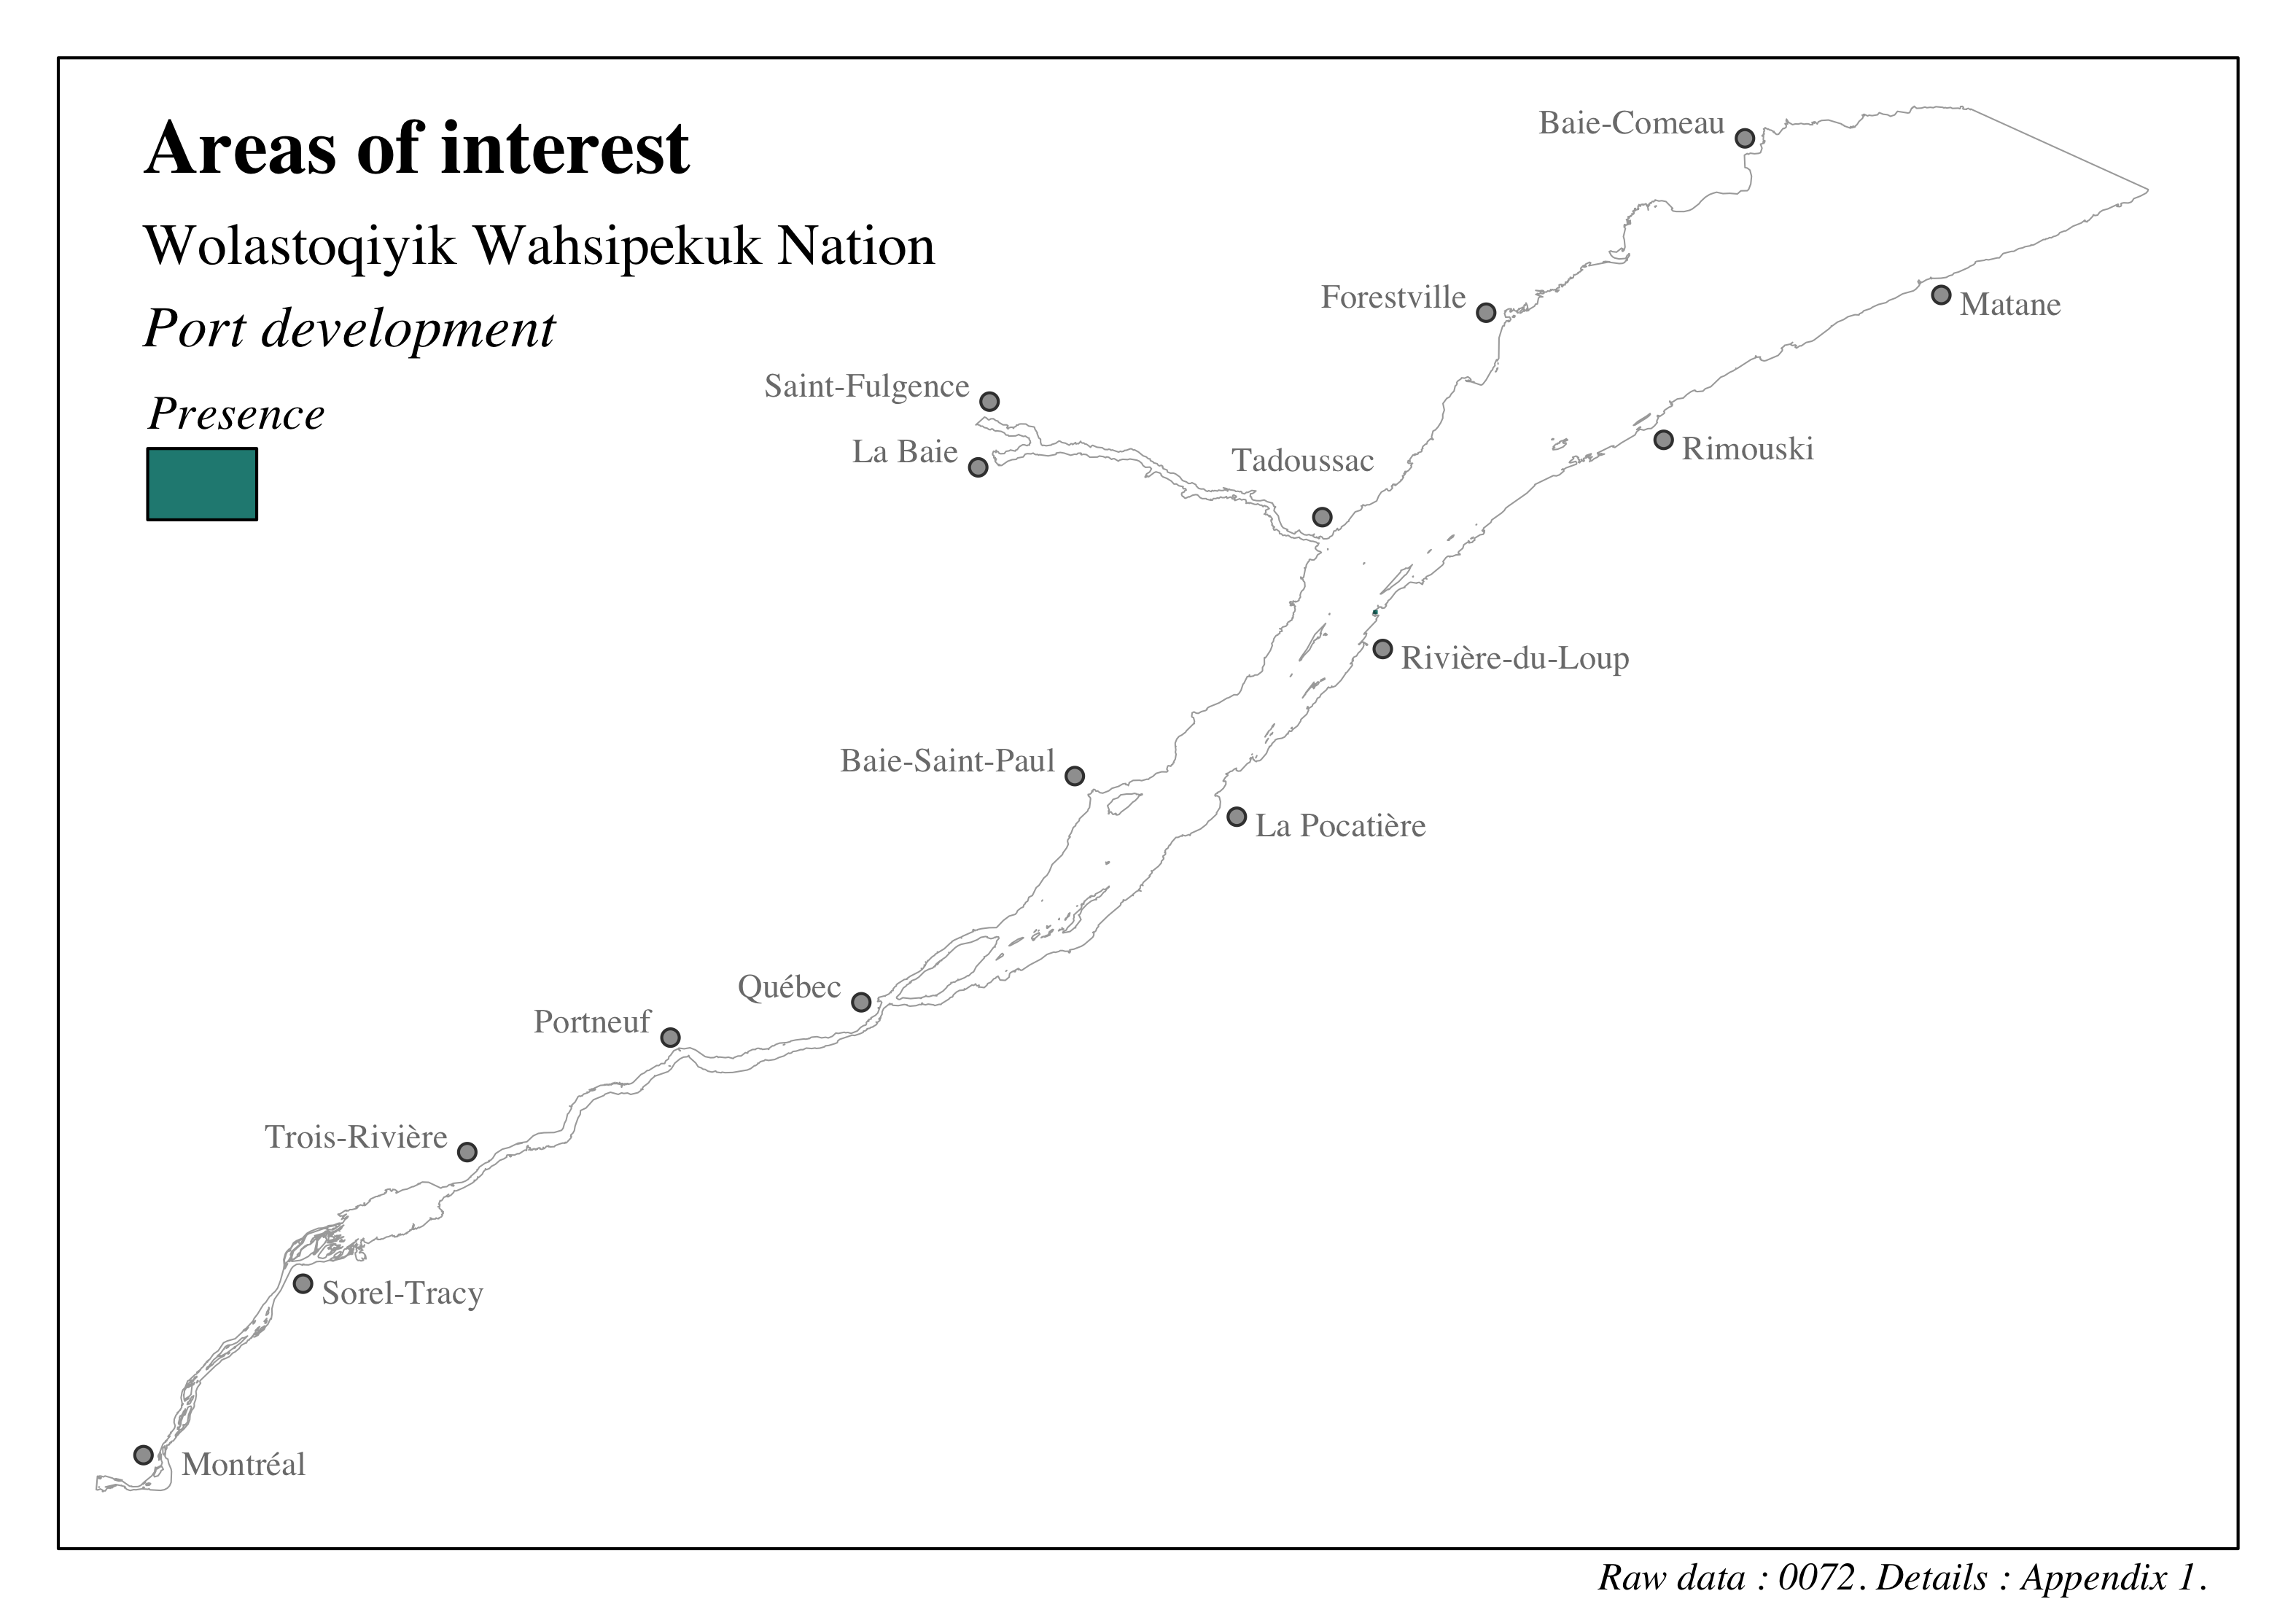
Figure 4.98: Distribution of sites of cultural, heritage and archeological interest in the St. Lawrence and the Saguenay river - Wolastoqiyik Wahsipekuk Nation - Port development
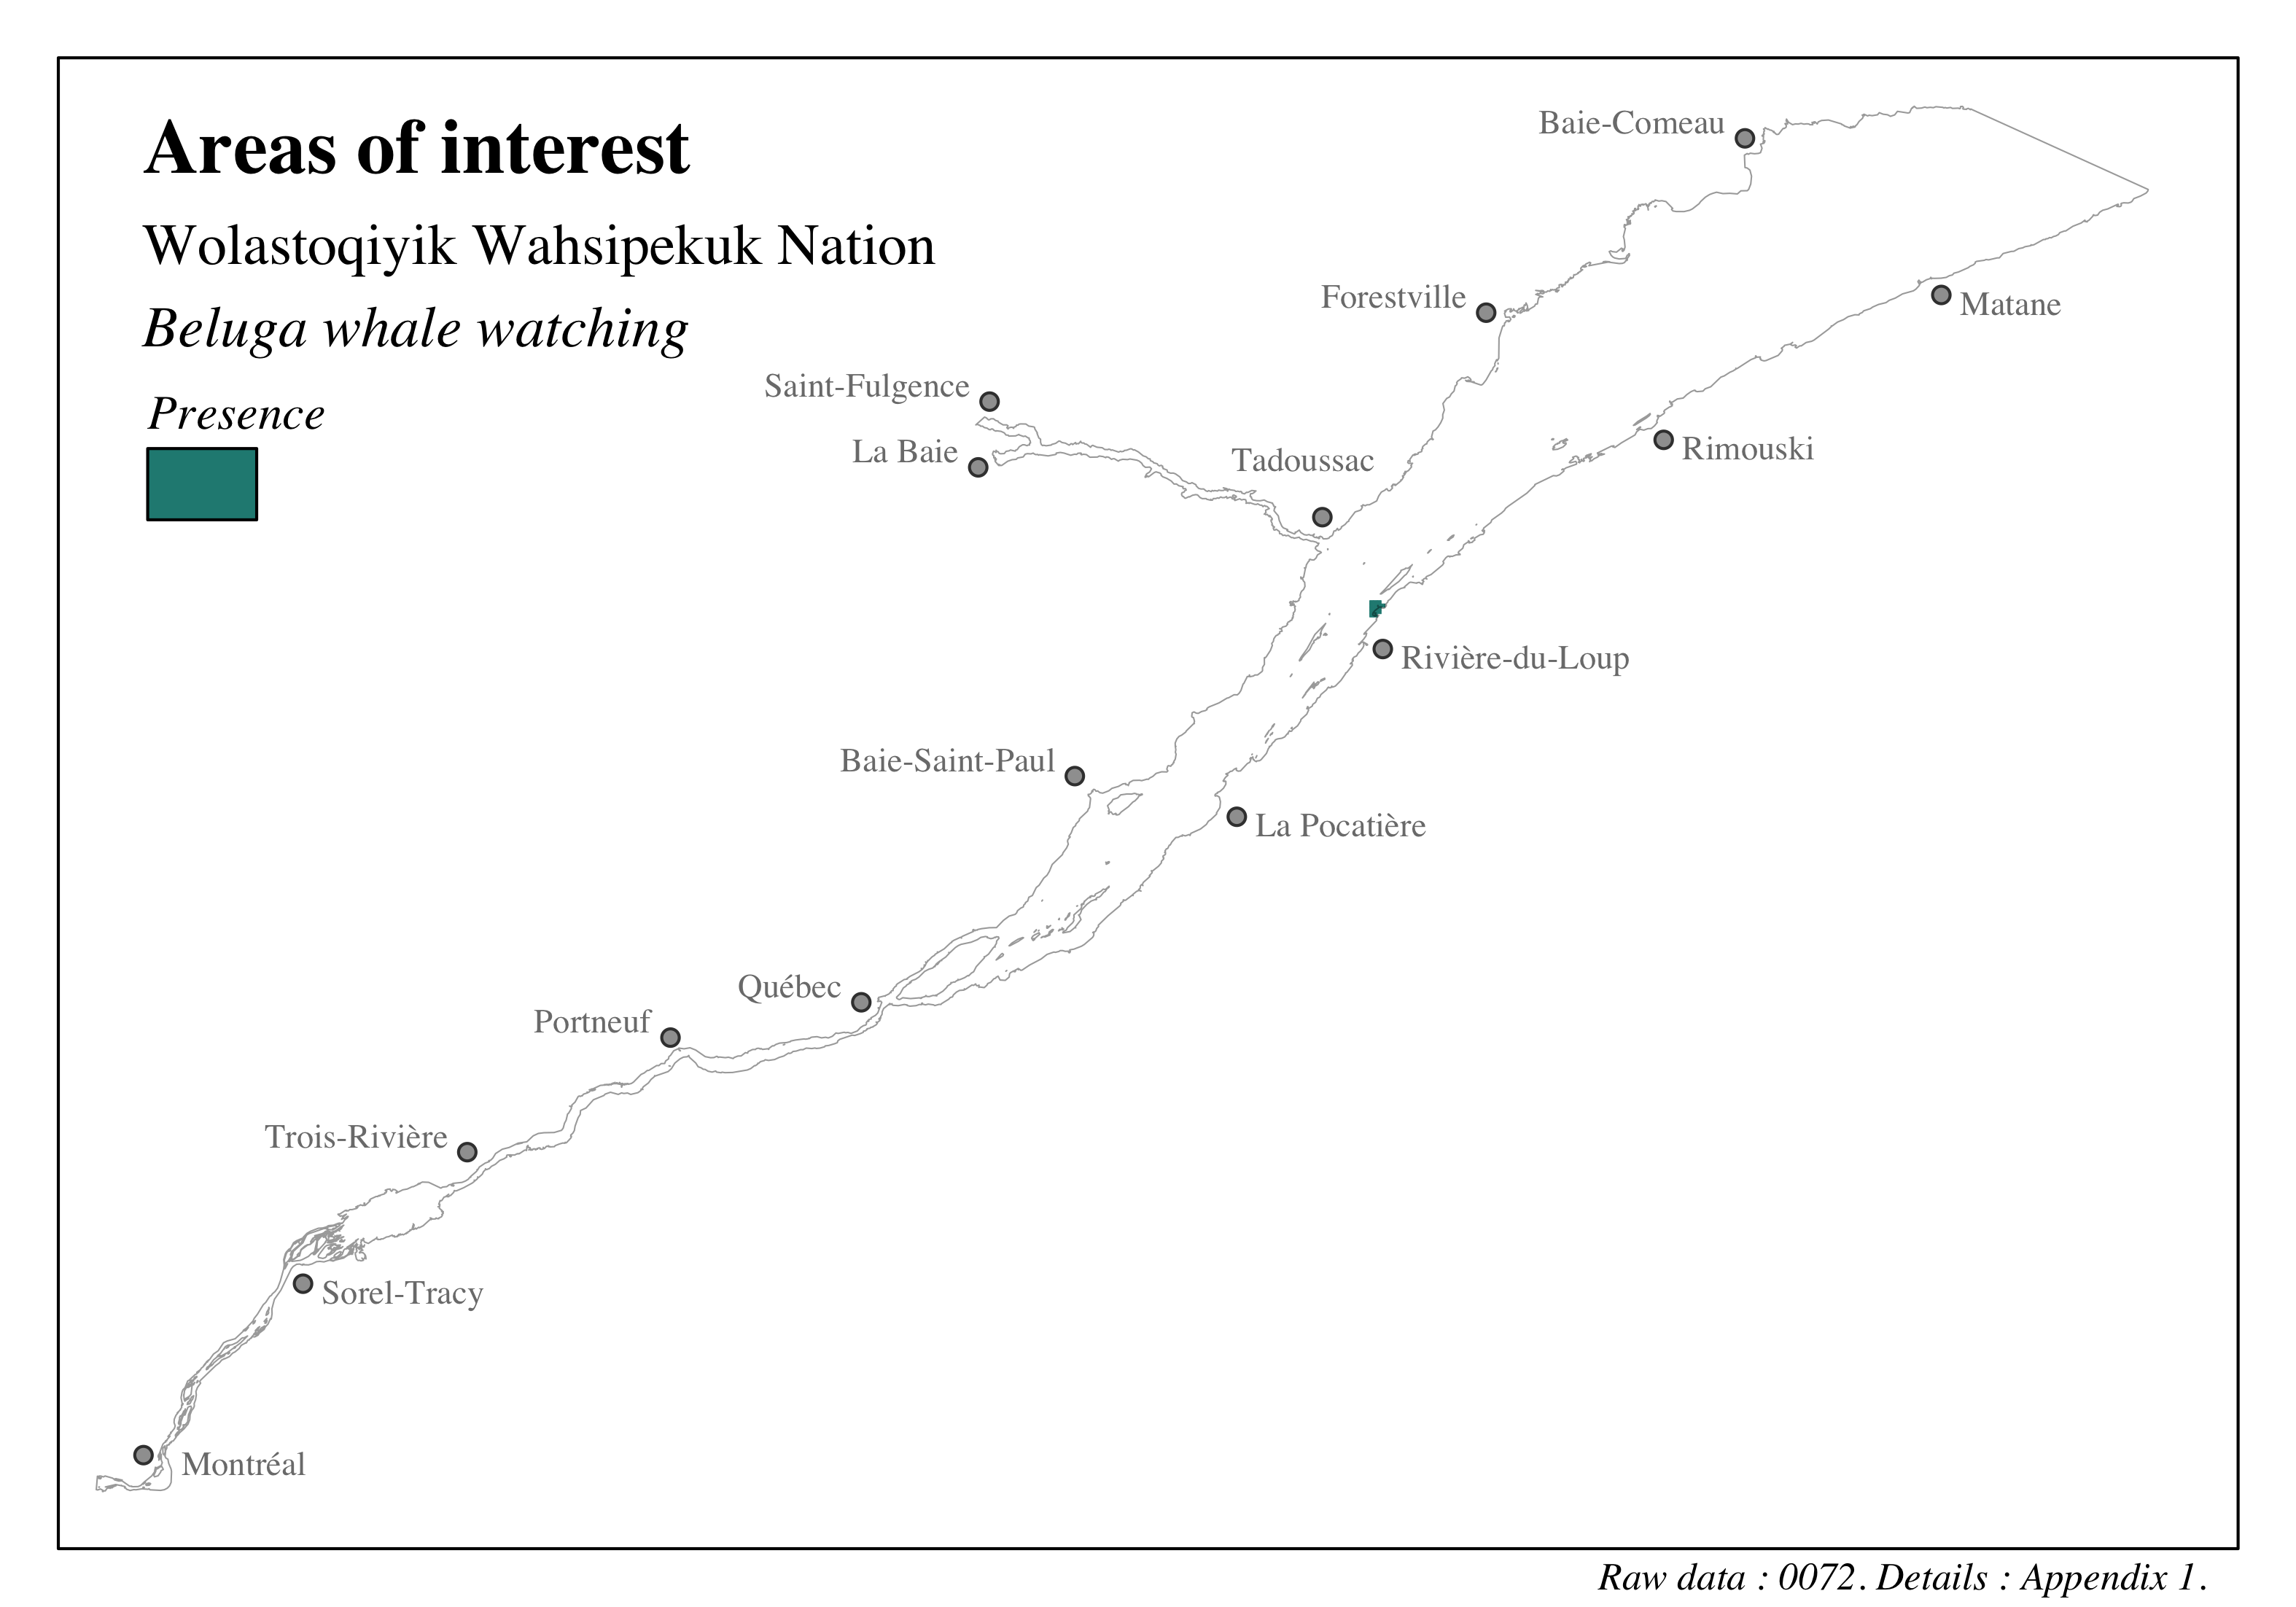
Figure 4.99: Distribution of sites of cultural, heritage and archeological interest in the St. Lawrence and the Saguenay river - Wolastoqiyik Wahsipekuk Nation - Beluga whale watching
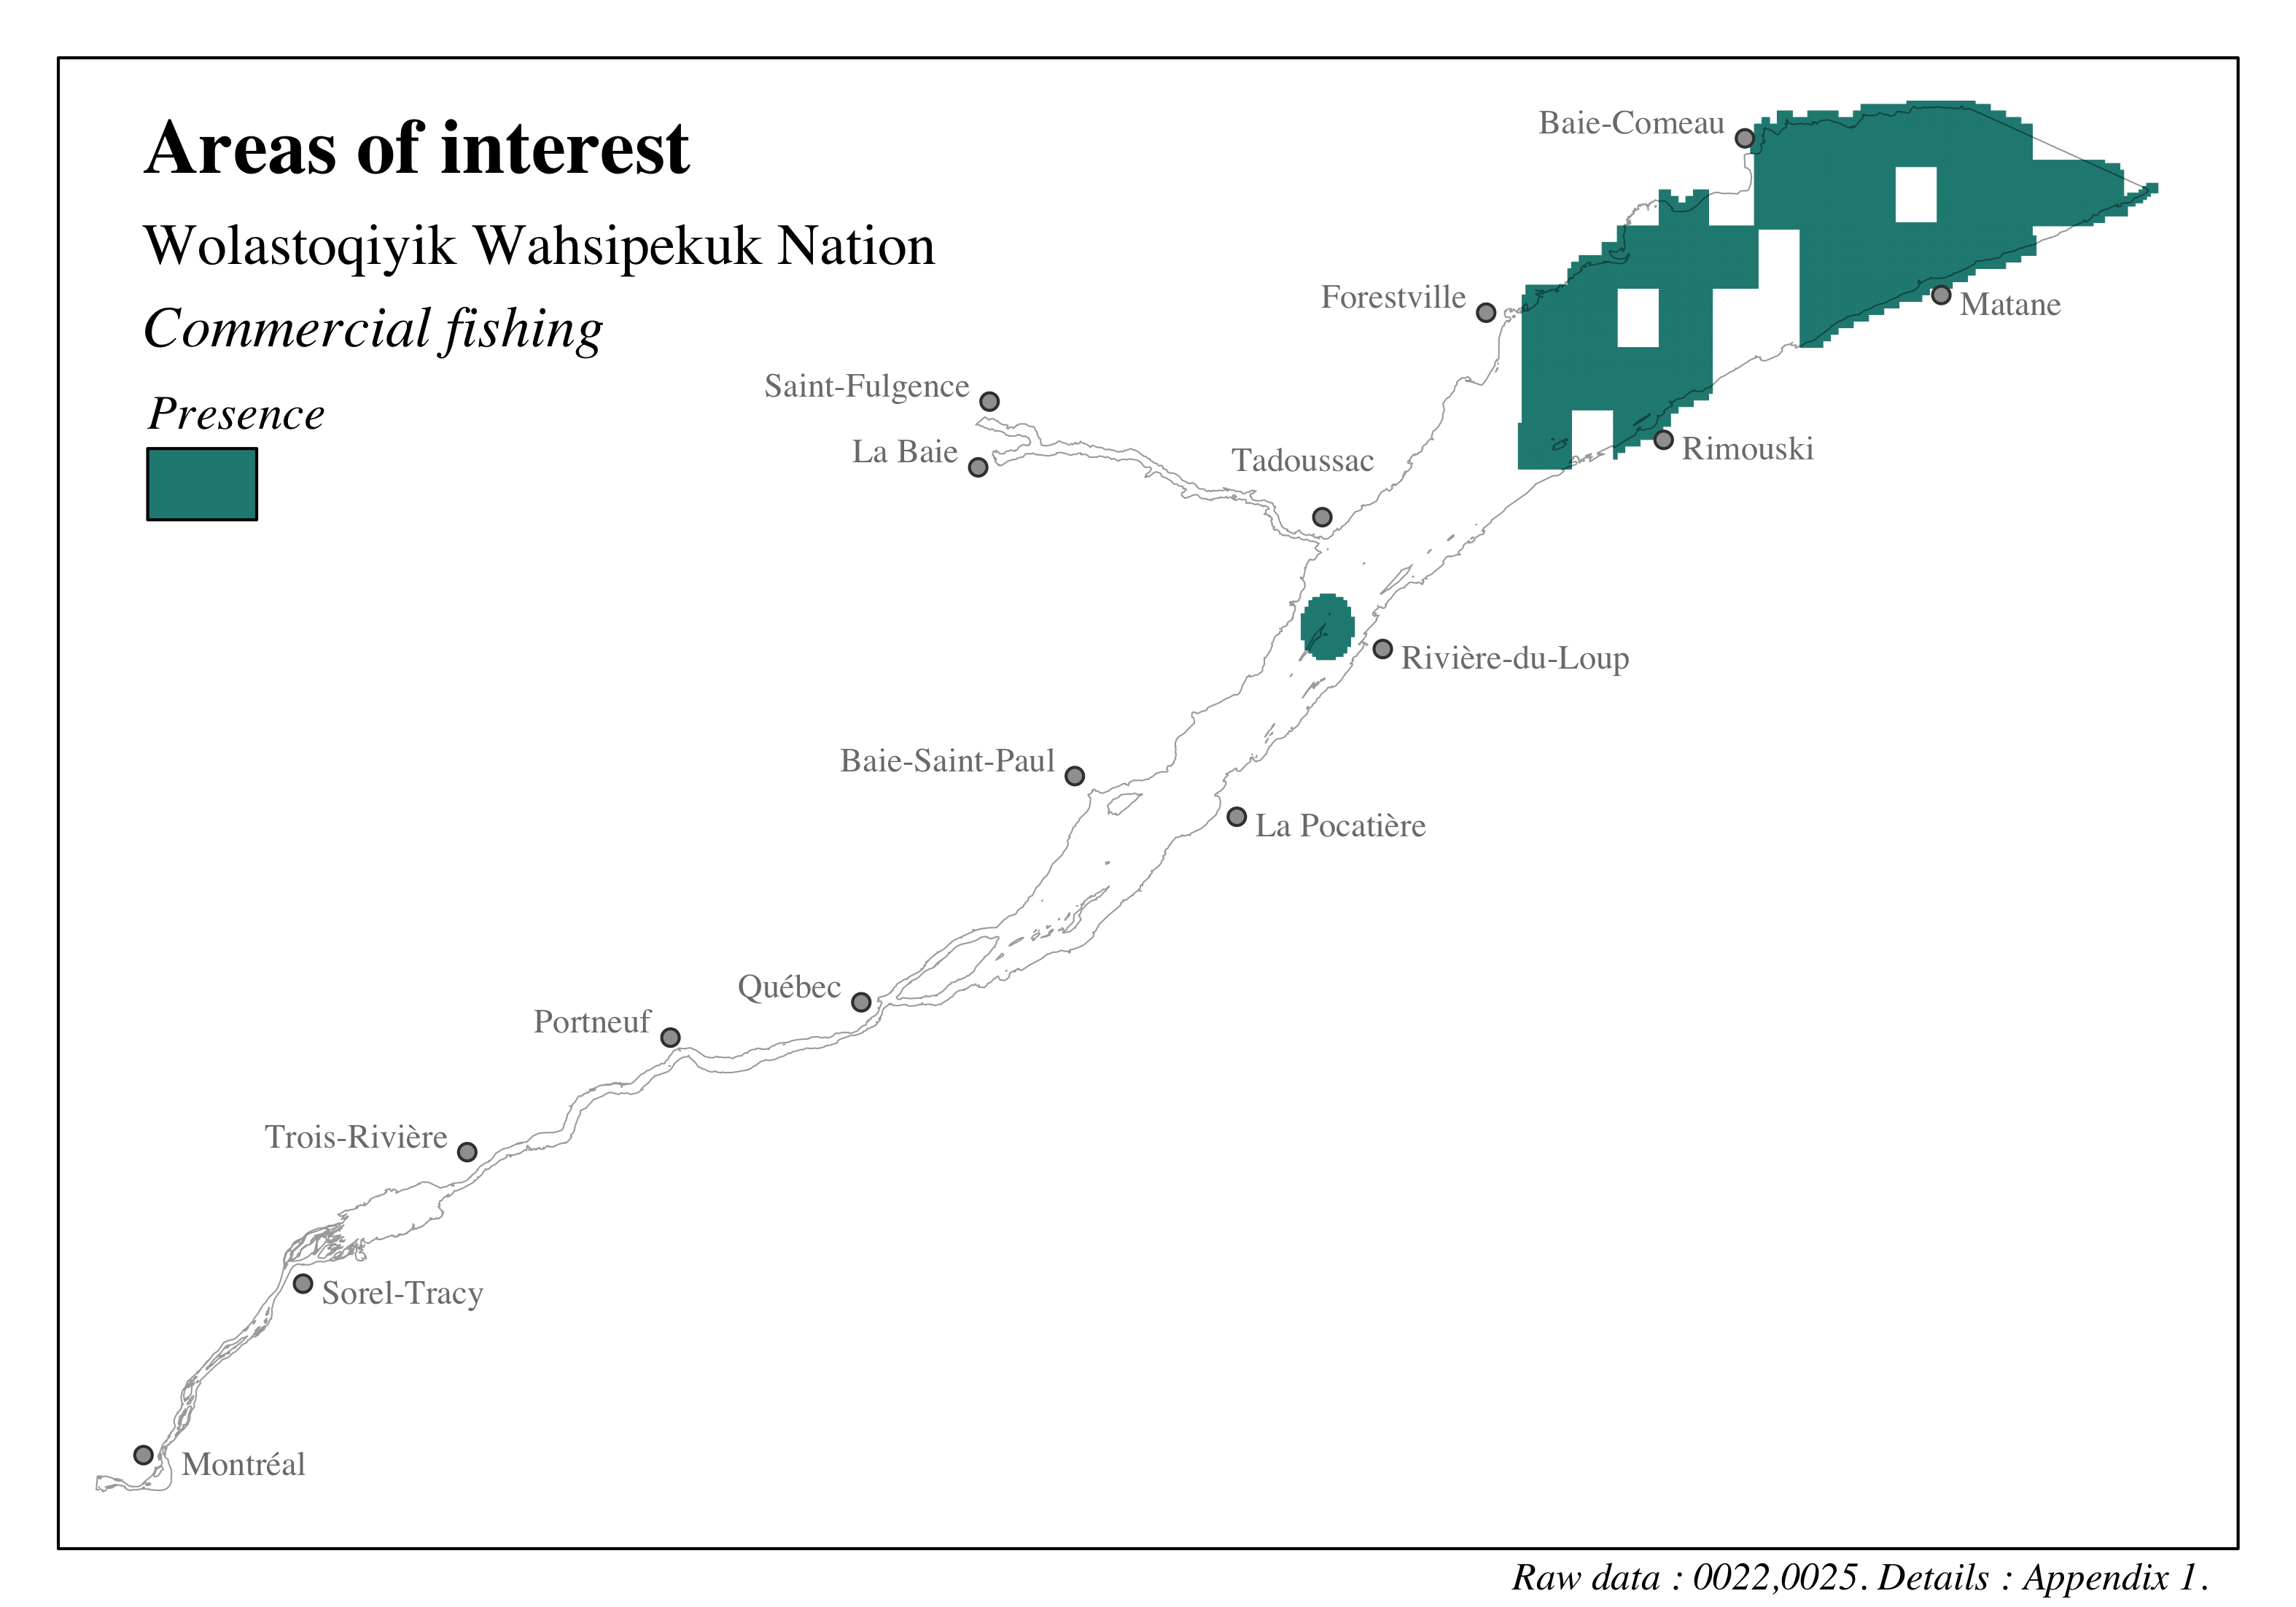
Figure 4.100: Distribution of sites of cultural, heritage and archeological interest in the St. Lawrence and the Saguenay river - Wolastoqiyik Wahsipekuk Nation - Commercial fishing
4.3.5.2 Areas of public interest
4.3.5.2.1 Protected areas
We thank Joannie Ferland from Ministère de l’Environnement, de la Lutte contre les changements climatiques, de la Faune et des Parcs for the discussions and support.
The unique identifiers given to the data presented in this section are: 0030, 0038, 0039, 0082. Refer to the following section and to Appendix 1 for more details on these data.
The protected areas were characterized by integrating four databases. The first database corresponds to the delineation of the different spatial management measures implemented in the Saguenay-St. Lawrence Marine Park (Canada, 2021b). This database includes the delineation of regulatory spatial measures (e.g. no-shipping zones and slow-down zones) as well as voluntary spatial measures (e.g. slow-down zones and avoidance zones). The second database comes from the Government of Canada and delineates environments where management measures are recognized as other effective conservation measures by area [EMCEZ; Pêches et Océans Canada (2021e)]. Within our study area, this database shows a single protected area upstream of the Saguenay River that limits fishing activities to protect beluga habitat and to avoid resuspension of contaminated sediments.
Finally, data from the Register of Protected Areas in Quebec (Registre des aires protégées au Québec) (Ministère de l’Environnement et de la Lutte contre les changements climatiques, 2021b) was used to complete the portrait. This register provides a compilation of protected areas in Quebec – identified according to the definitions of the Natural Heritage Conservation Act (NHCA; RLRQ, chapter C-61.01) or the International Union for Conservation of Nature (IUCN) – and territories of conservation importance – identified by the Ministère de l’Environnement, de la Lutte contre les changements climatiques, de la Faune et des Parcs (MELCCFP) or an authority of the Quebec government. During the March 2023 update, these data were enhanced by integrating data from work carried out by the MELCCFP’s ecological knowledge department, integrating an update of the Register of protected areas in Quebec and its territories of importance (Ministère de l’Environnement et de la Lutte contre les changements climatiques, 2022), of the Directory of voluntary conservation sites of Quebec (Réseau de milieux naturels protégés, 2022), of wildlife habitats (Ministère des Forêts, de la Faune et des Parcs, 2021b) and of exceptional forest ecosystems not appearing in the Registry (Ministère des Forêts, de la Faune et des Parcs, 2022). We removed wildlife habitats and land reserves for protected area purposes from these databases because these categories covered the entire study area, as well as the habitats of a threatened or vulnerable plant species because that they were covered by other valued components.
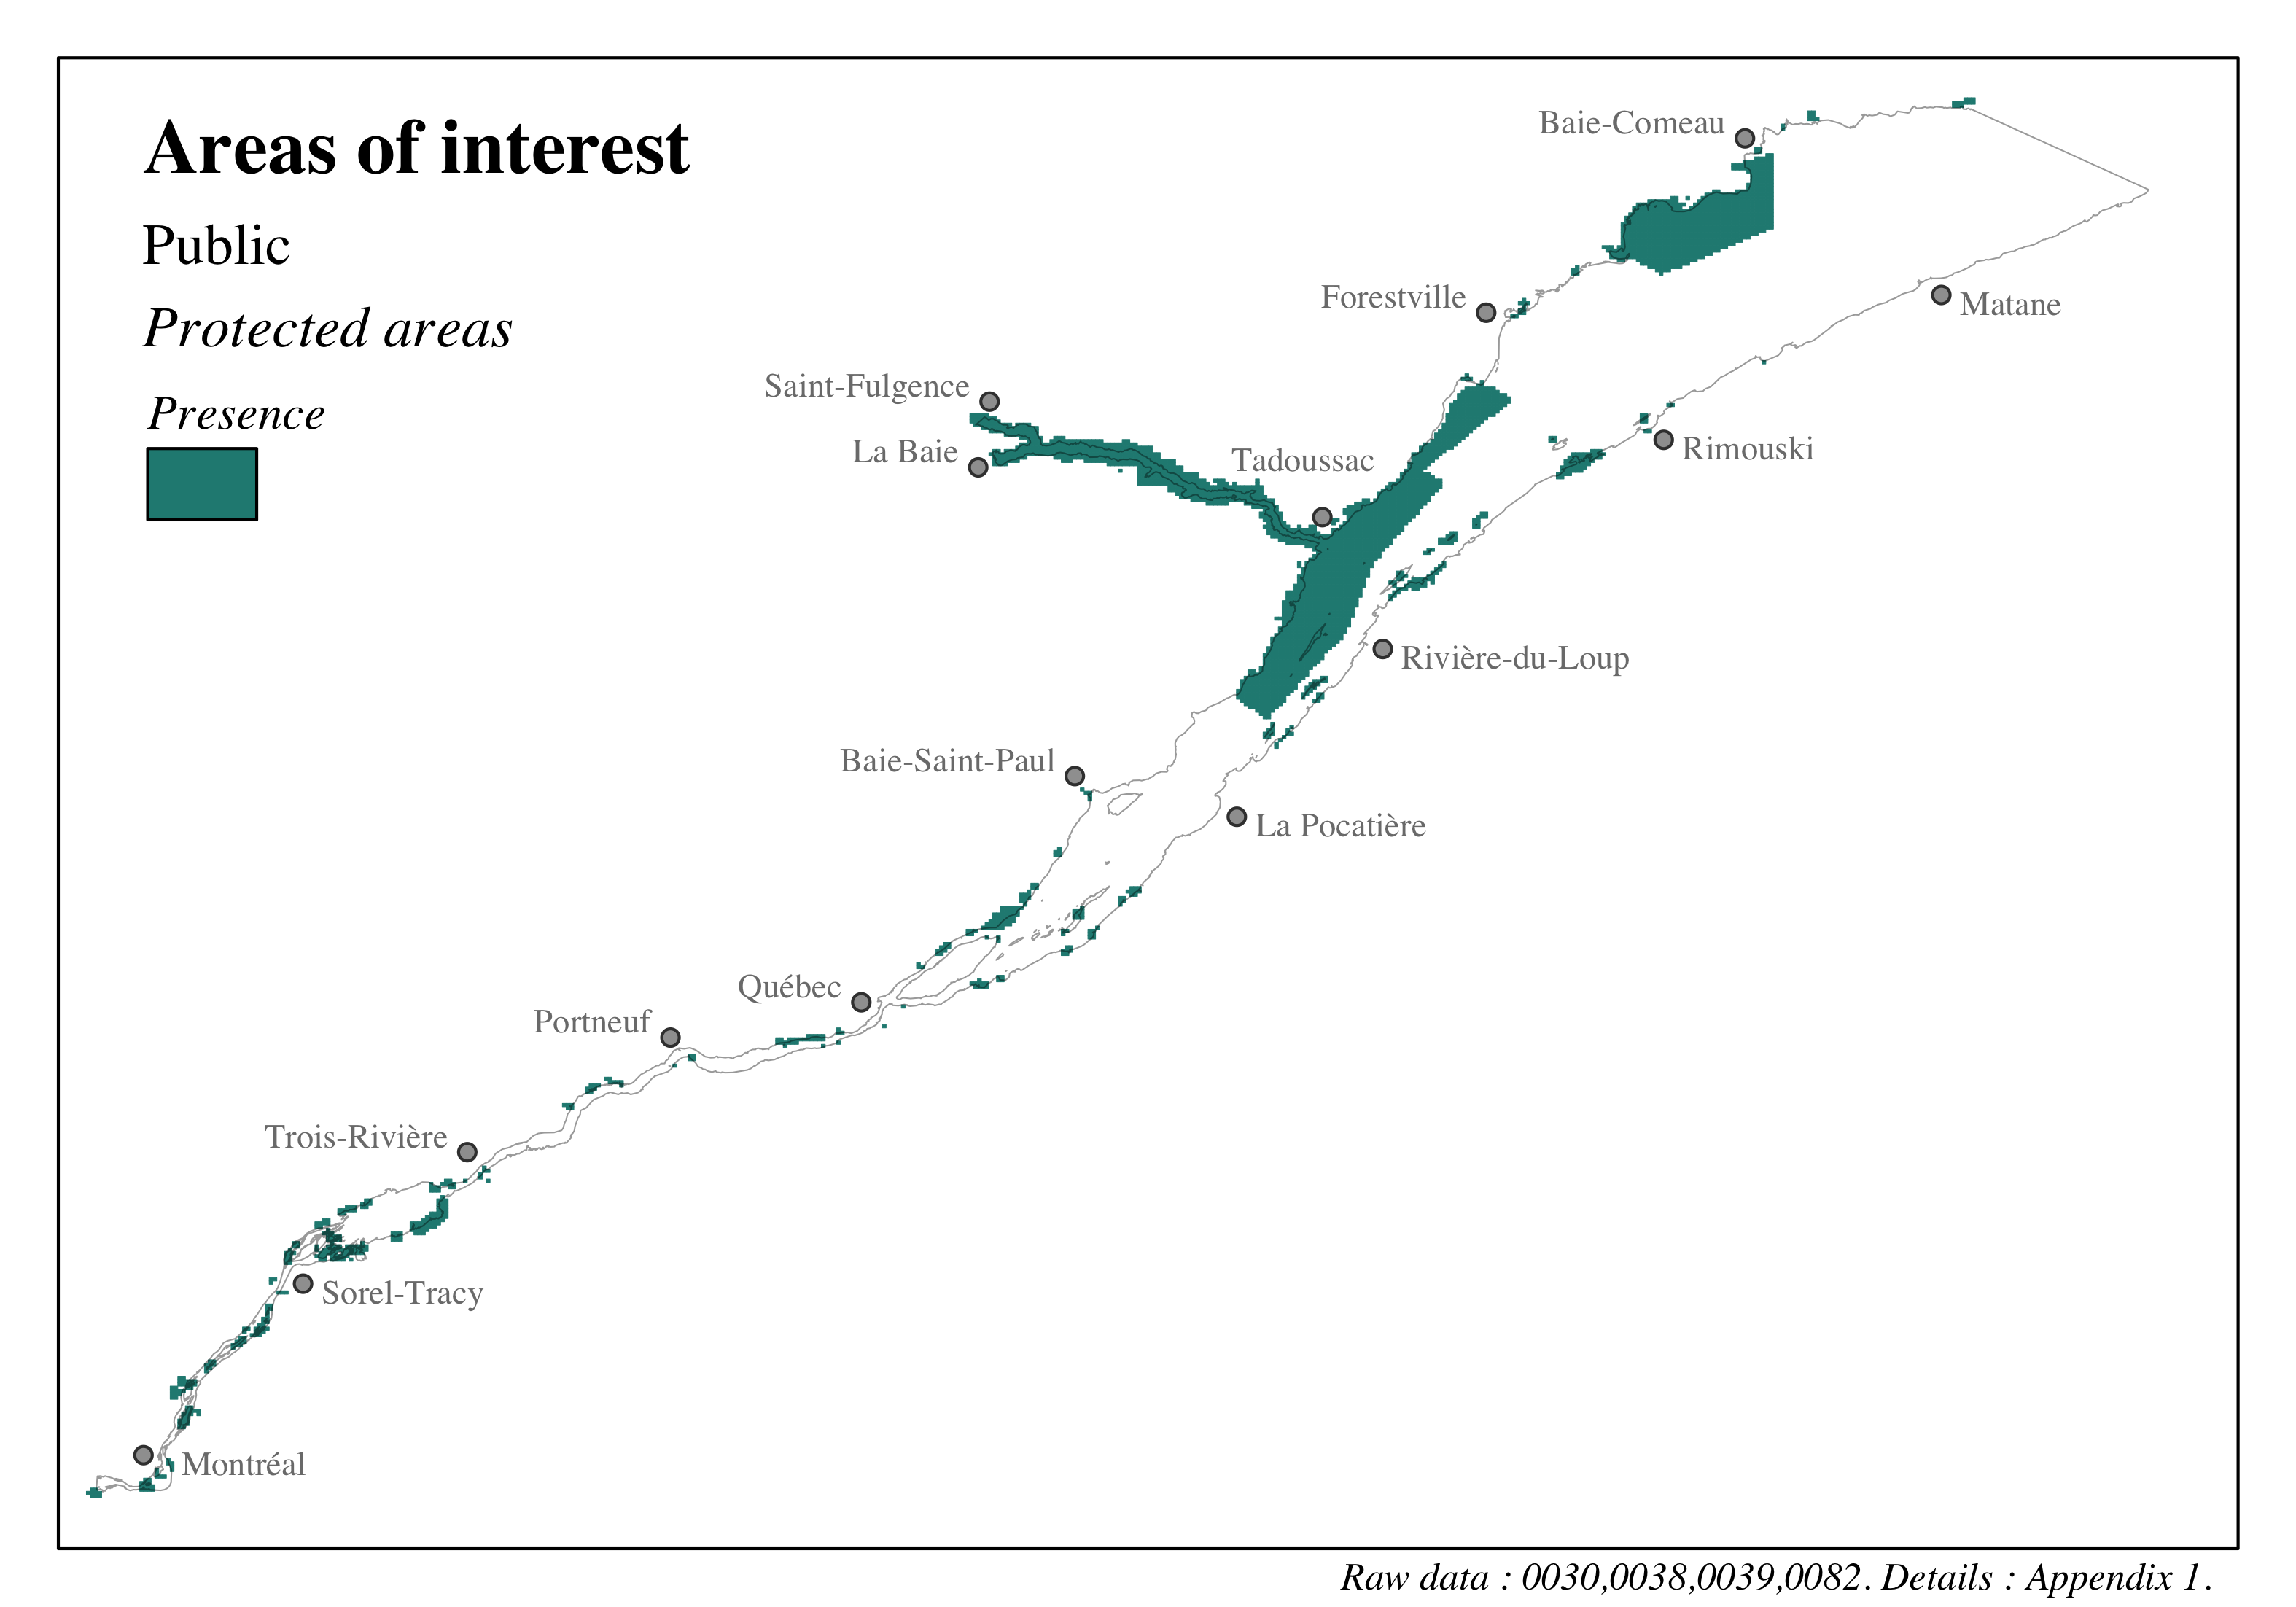
Figure 4.101: Distribution of sites of cultural, heritage and archeological interest in the St. Lawrence and the Saguenay river - Public - Protected areas
4.3.5.2.2 Heritage sites
The unique identifiers given to the data presented in this section are: 0044, 0045. Refer to the following section and to Appendix 1 for more details on these data.
The characterization of public heritage sites comes from the integration of two databases from the Ministère de la Culture et des Communications. The first database presents data on heritage sites classified by the Minister and which are part of the heritage protected under the Cultural Heritage Act [R.S.Q., c. 21; Ministère de la Culture et des Communications (2021b)]. The second database corresponds to heritage sites cited by municipalities and Indigenous communities (Ministère de la Culture et des Communications, 2021a); these sites are also part of the heritage protected under the Cultural Heritage Act.
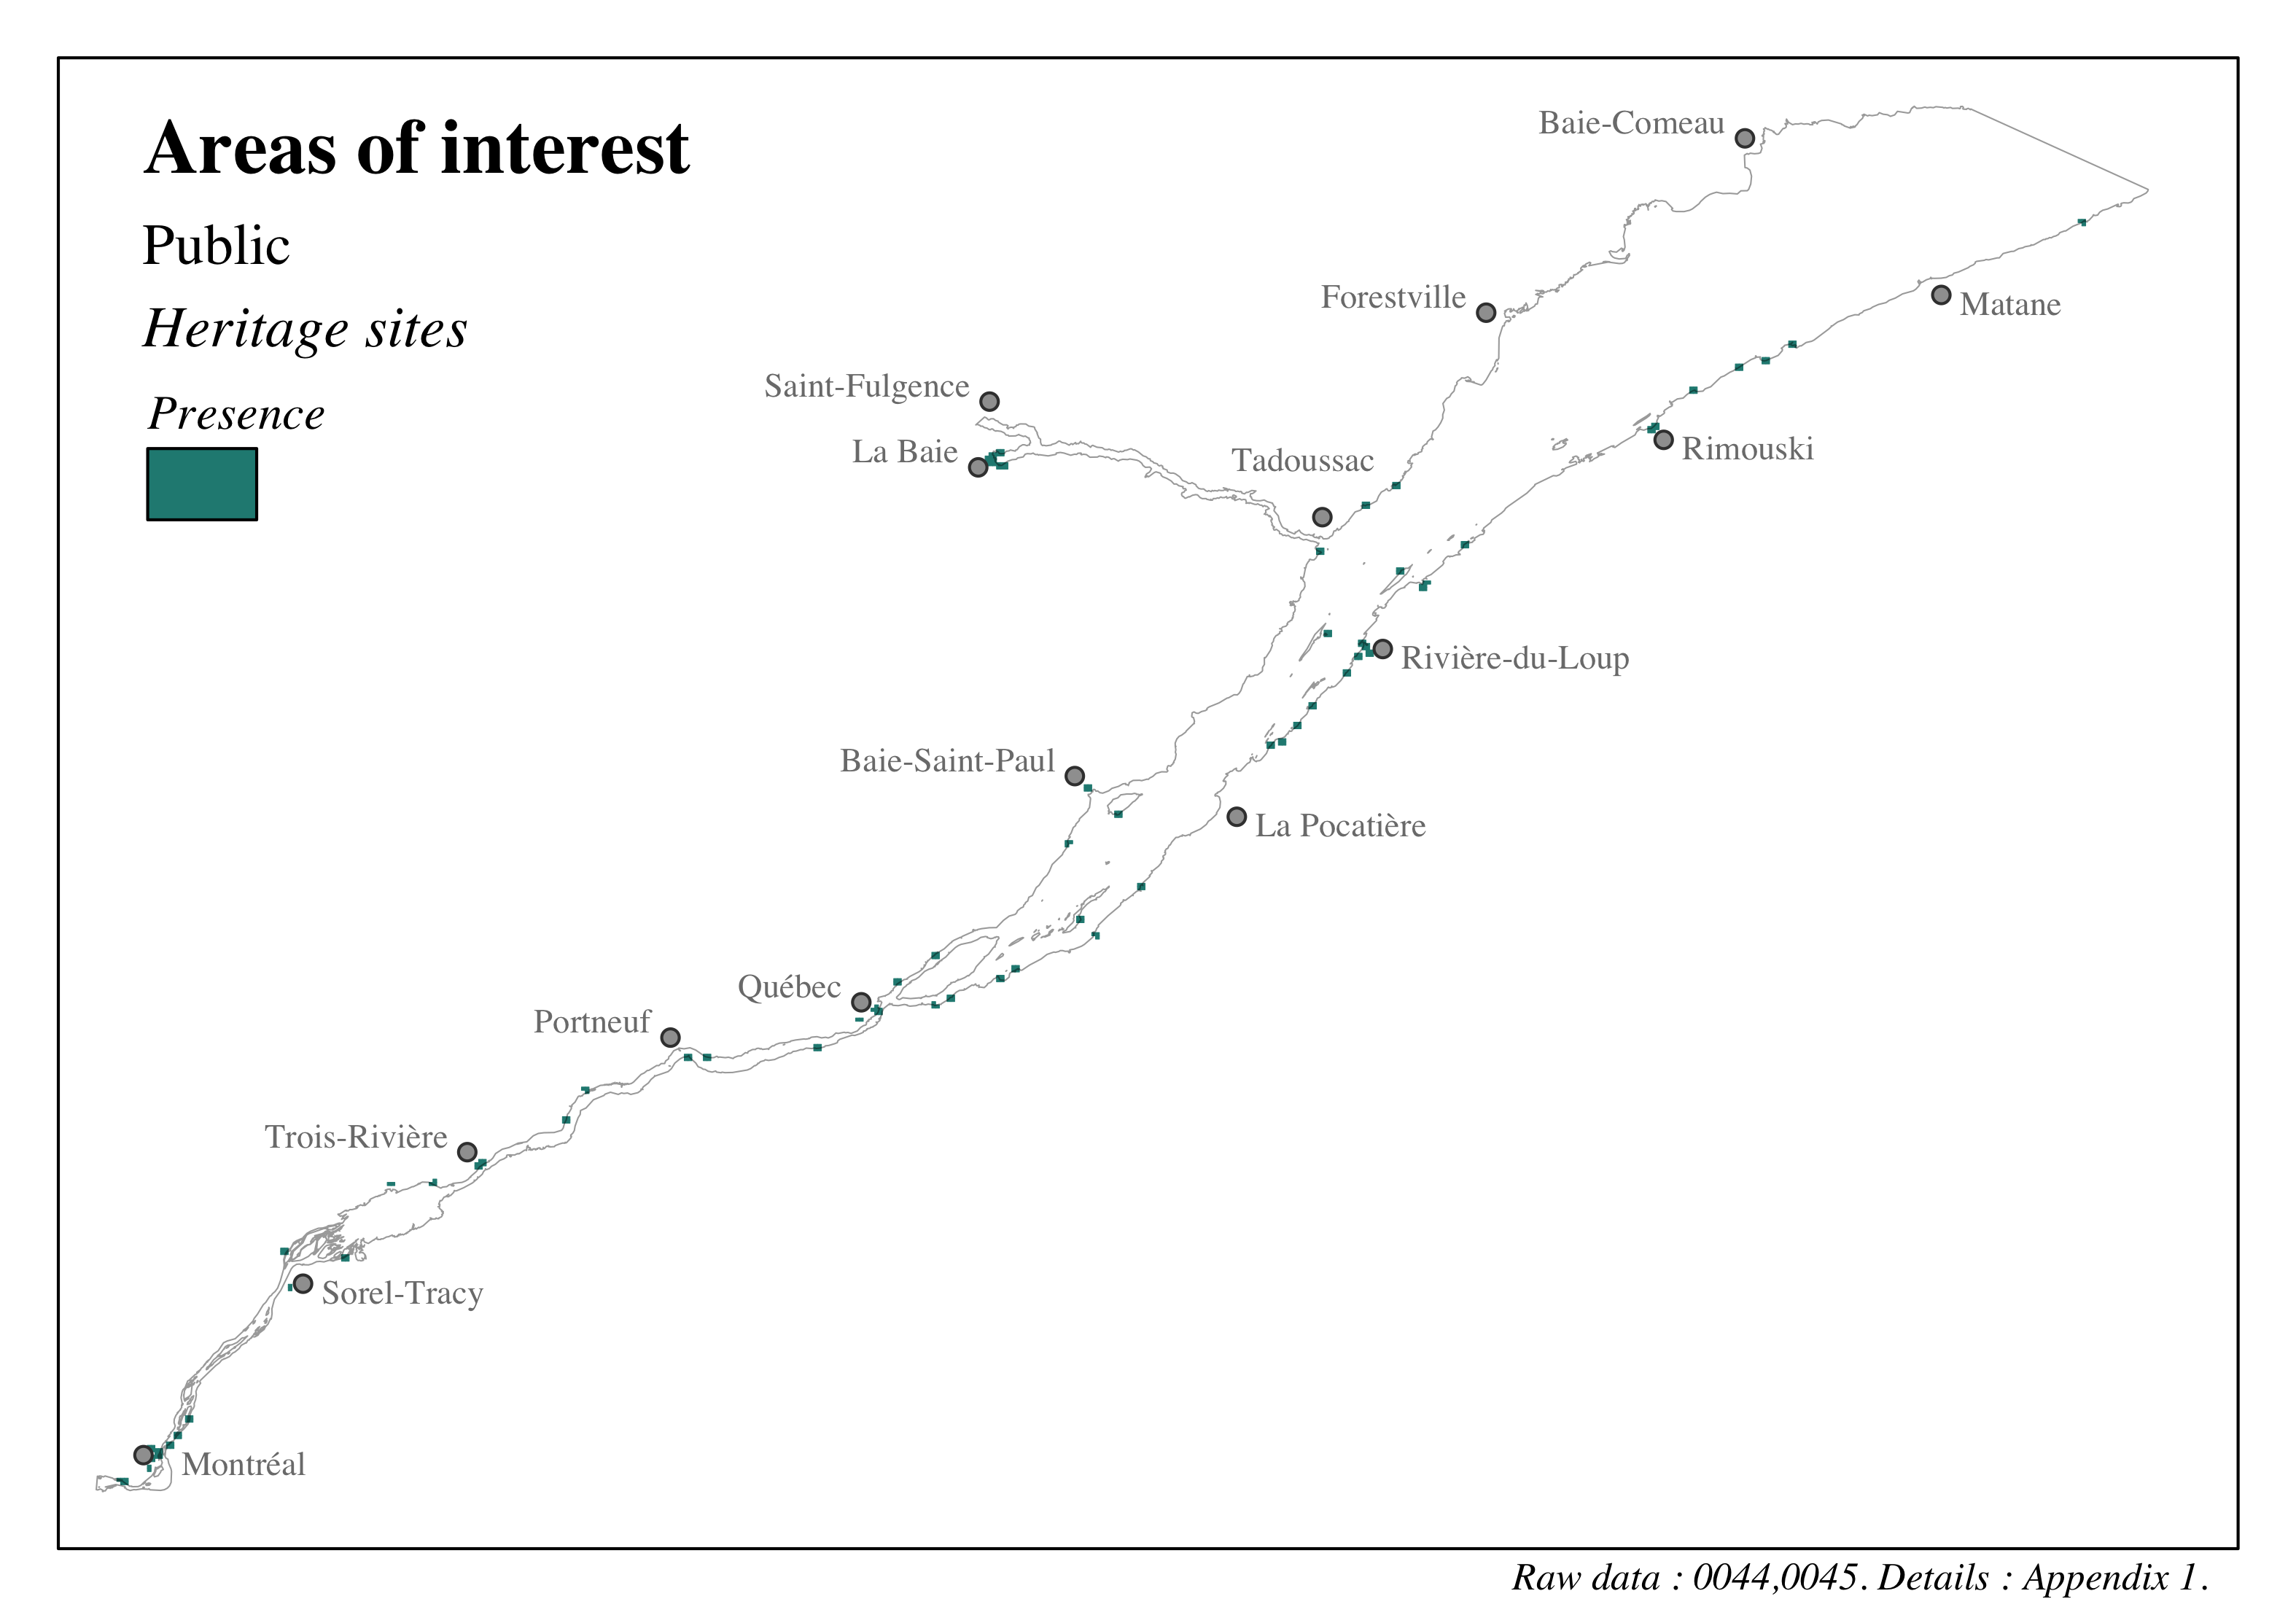
Figure 4.102: Distribution of sites of cultural, heritage and archeological interest in the St. Lawrence and the Saguenay river - Public - Heritage sites
4.3.5.2.3 Shipwrecks
We thank Francis Bouchard et Virginie Galindo of the Ministère de l’Environnement, de la Lutte contre les changements climatiques, de la Faune et des Parcs for the discussions and support.
The unique identifier given to the data presented in this section is: 0088. Refer to the following section and to Appendix 1 for more details on these data.
Shipwrecks that are part of the archaeological heritage within the study area were characterized using data from the Ministère de l’Environnement, de la Lutte contre les changements climatiques, de la Faune et des Parcs [MELCCFP; Ministère de l’Environnement, de la Lutte contre les changements climatiques, de la Faune et des Parcs (2023b)]. The data comes from a literature review on the subaquatic archaeological potential within the land reserves for the purposes of protected areas in the L’Isle-aux-Grues sector, the Kamouraska sector, the Basques sector, the Banc-des-Américains marine protected area and the proposed Manicouagan aquatic reserve carried out by AECOM (AECOM, 2021). The data provided contains the potential location of wrecks within the St. Lawrence and a total of 428 wrecks are listed between Quebec and the eastern limit of the study area. Since these data are of a sensitive nature, a buffer zone of 1 km was used around each site; the resulting areas were then combined into a single layer. This layer was integrated into our 1 \(km^2\) study grid in order to identify cells with subaquatic archaeological potential. This approach was used to avoid providing the specific location of known shipwrecks.
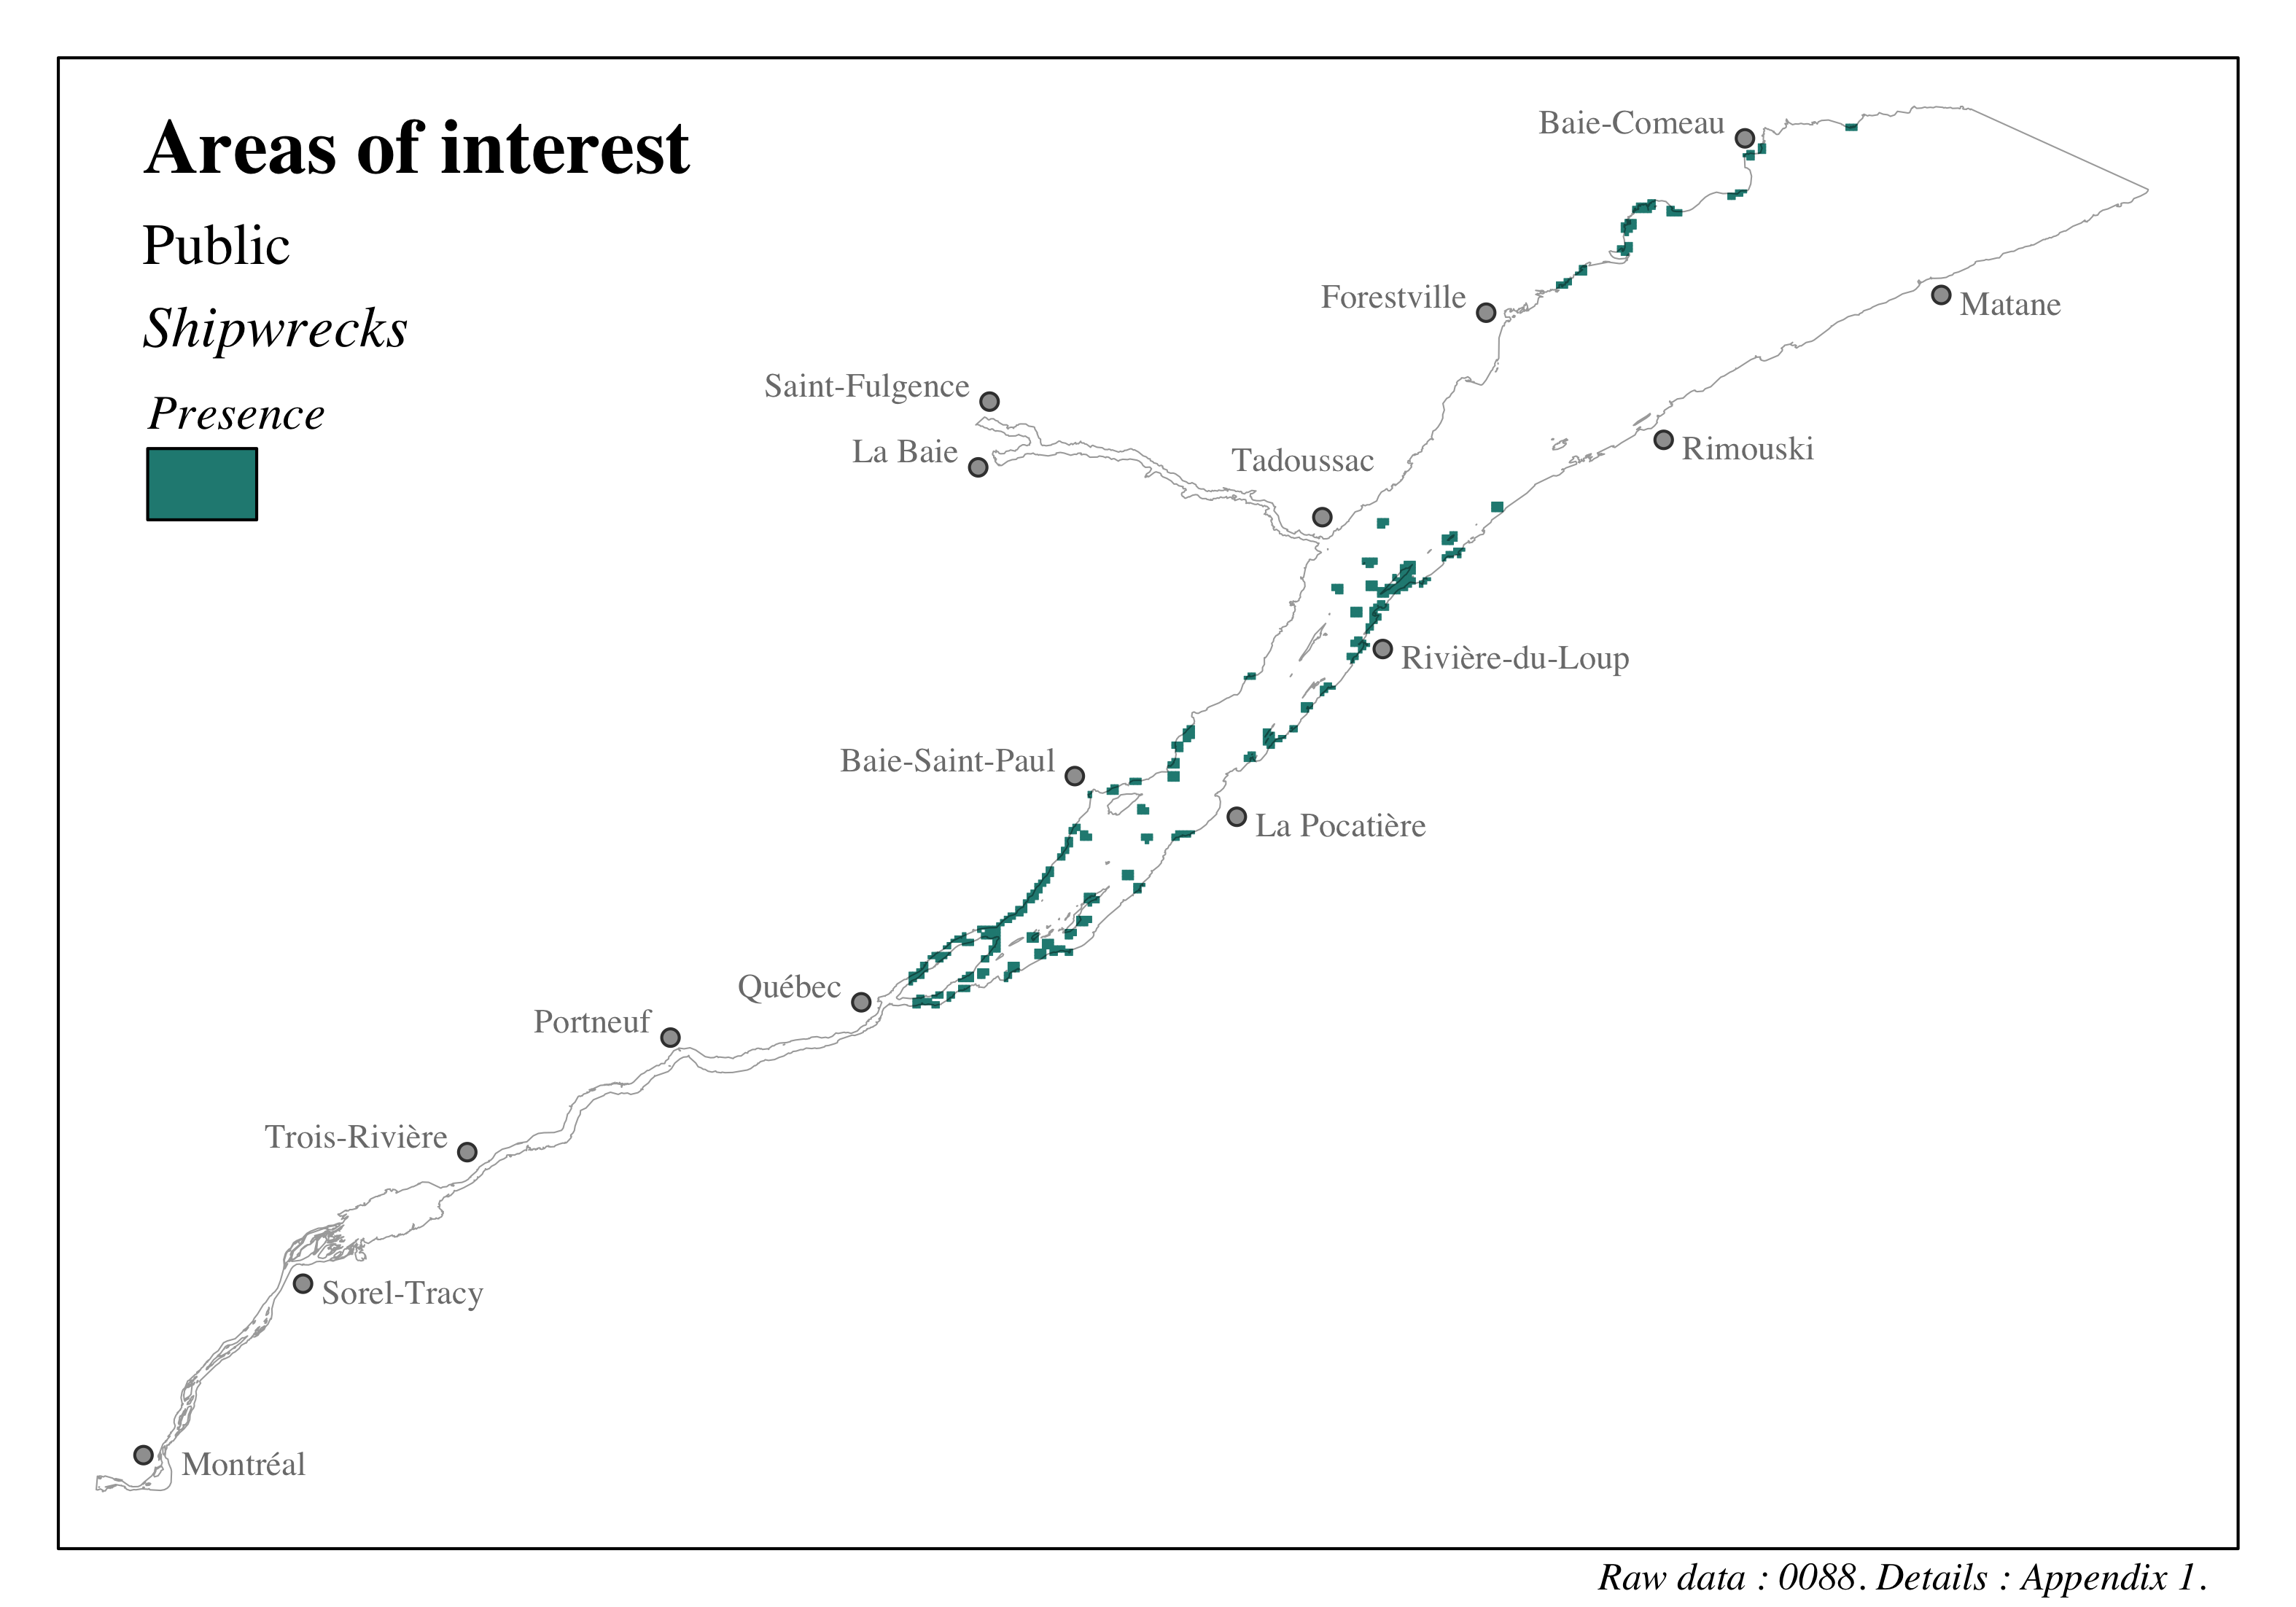
Figure 4.103: Distribution of sites of cultural, heritage and archeological interest in the St. Lawrence and the Saguenay river - Public - Shipwrecks
4.4 Vulnerability
The following sections present the data, approaches, and results of the vulnerability assessment of valued components to the environmental stressors considered for the marine vessel activities cumulative effects assessment in the study area. A general description of the vulnerability assessment in a cumulative effects assessment context is presented in section 3.2.5 of the report.
4.4.1 Plant and wildlife habitats
4.4.1.1 Natural environments
Several exercises to assess the vulnerability of different habitat types to various environmental stressors have been published in Canada (e.g. Ban et al., 2010; Clarke Murray et al., 2015b, 2015a) and elsewhere in the world (Kappel et al., 2012; Teck et al., 2010). A similar process led by Fisheries and Oceans Canada is currently underway to characterize the vulnerability of West Atlantic habitats to approximately 50 stressors. Originally developed by Halpern et al. (2007) to characterize habitat vulnerability on a global scale, this approach uses exposure and sensitivity metrics to assess five ecosystem vulnerability criteria (i.e. habitats in our study): spatial scale, frequency, trophic impact, resistance, and resilience (Table 4.21).
| Vulnerability criterion | Description |
|---|---|
| Spatial scale | The spatial scale (\(km^2\)) at which a stressor impacts the habitat, both directly and indirectly |
| Frequency | The mean annual frequency (number/year) of a stressor at a particular location within a given region |
| Trophic impact | The degree to which marine life is affected by a stressor within a given ecosystem and region (i.e., one or more species, one or more trophic levels, or an entire ecosystem) |
| Resistance | The degree (in %) to which species, trophic levels, or the natural state of an entire ecosystem is affected by the stressor |
| Recovery time | The mean time (in years) required for the affected species, trophic level(s), or entire community to return to its former natural state following disturbance caused by the stressor |
These allow the use of quantitative factors that provide greater transparency than the qualitative approach (Kappel et al., 2012; Teck et al., 2010). The vulnerability scores \(\mu\) are the weighted sum of the five vulnerability criteria:
\[mu_{D_i,E_j} = \sum_{k = 1,...,5} W_k * D^j_{i,k}\]
where \(D^j_{i,k}\) is the value of stressor \(i\) for criterion \(k\) within ecosystem \(j\) and \(W_k\) is the weight associated with criterion \(k\), with the sum of all weights equal to 1. The weight \(W_k\) is thus used to weight the value attributed to individual criteria according to their individual importance. This additive and linear model assumes that vulnerability is monotonic for all vulnerability criteria, i.e. that vulnerability increases with an increase in the value of each criterion. A transformation of the \(W_k\) values is required to ensure that the range of values is comparable for the different criteria. This equation ultimately generates a matrix of vulnerability scores for all stressor-ecosystem combinations.
Teck et al. (2010) and Kappel et al. (2012) used expert surveys to assess the values and weights associated with each vulnerability criterion for each stressor-habitat combination. A total of 107 experts assessed the relative vulnerability of 19 habitat types to 53 environmental stressors. The resulting vulnerability matrices have been used and adapted many times since (e.g. Ban et al., 2010; Clarke Murray et al., 2015b). These vulnerability matrices also provide a starting point for our assessment; indeed, all of the environmental stressors, and a significant portion of the habitats considered for our assessment, are found in the list presented by Teck et al. (2010), Kappel et al. (2012) and Clarke Murray et al. (2015b). Specifically, we used the vulnerability matrix from Kappel et al. (2012) to inform the vulnerability assessment of habitats for which a clear match could be made, i.e., natural environments. Refer to Appendix 6 and Appendix 7 for the matches used between our study and Kappel et al. (2012) for stressors and valued components, respectively.
Some habitats considered for our assessment, however, did not have a clear match with the matrix of Kappel et al. (2012). In these cases, we adopted the approach used by Clarke Murray et al. (2015b) and selected the habitat(s) presented by Kappel et al. (2012) that were most like those for which a clear match was unavailable. For example, the Kappel et al. (2012) shallow soft sediment and salt marsh habitat scores were used for mollusk beds and fluvial terraces, respectively. If a habitat under consideration could aggregate multiple Kappel et al. (2012) habitats, we instead used the average score of these habitats to obtain a vulnerability score. Vulnerability scores assigned to floodplains were thus obtained based on the average of the vulnerability scores assigned to rocky intertidal, intertidal, and salt marsh environments in the Kappel et al. (2012) matrix. Similarly, the government and research shipping category includes a significant diversity of vessel types such as military craft, patrol vessels, and scientific research vessels. The vulnerability of habitats to this type of shipping was thus assessed using the average of the scores assigned to shipping, military, research, and scientific sampling from Kappel et al. (2012). Finally, for the 2023 update, the vulnerability scores for eelgrass and algal zones were used for aquatic grass bed habitats.
Some modifications were also made to the vulnerability scores reported by Kappel et al. (2012). First, the vulnerability values assigned to wetlands were modified to appropriately capture the fineness of the dataset available for our study. The characterized wetlands reflect the tiered nature of wetlands, with shallow water wetlands, followed by marshes, then swamps, with the potential exposure of these environments to marine-based stressors gradually decreasing. We thus decreased the vulnerability of wetlands to all stressors proportionally by a factor of 5% for marshes and 10% for swamps. We retained the Kappel et al. (2012) assessment for the wetland habitat category containing wetlands of unknown type as a precaution. Second, accidental spills were categorized to differentiate hydrocarbon spills from other types of spills, meaning that we decrease the spill vulnerability values by a factor of 10% for other spills. Third, the vulnerability scores for aquatic grass beds was decreased by 10% per biovolume category under the assumption that higher biovolumes are more important, and thus have a higher vulnerability: high biovolume (100%), moderate biovolume (90%), and low biovolume (80%). As with the wetlands, we kept the vulnerability value intact for spills of unknown content as a precaution. Lastly, a relative score was estimated by normalizing the total scores by the maximum observed vulnerability value among the habitats considered (i.e. 3.6) to obtain a score ranging from 0 to 1. The resulting vulnerability matrix can be consulted in Table 4.104.
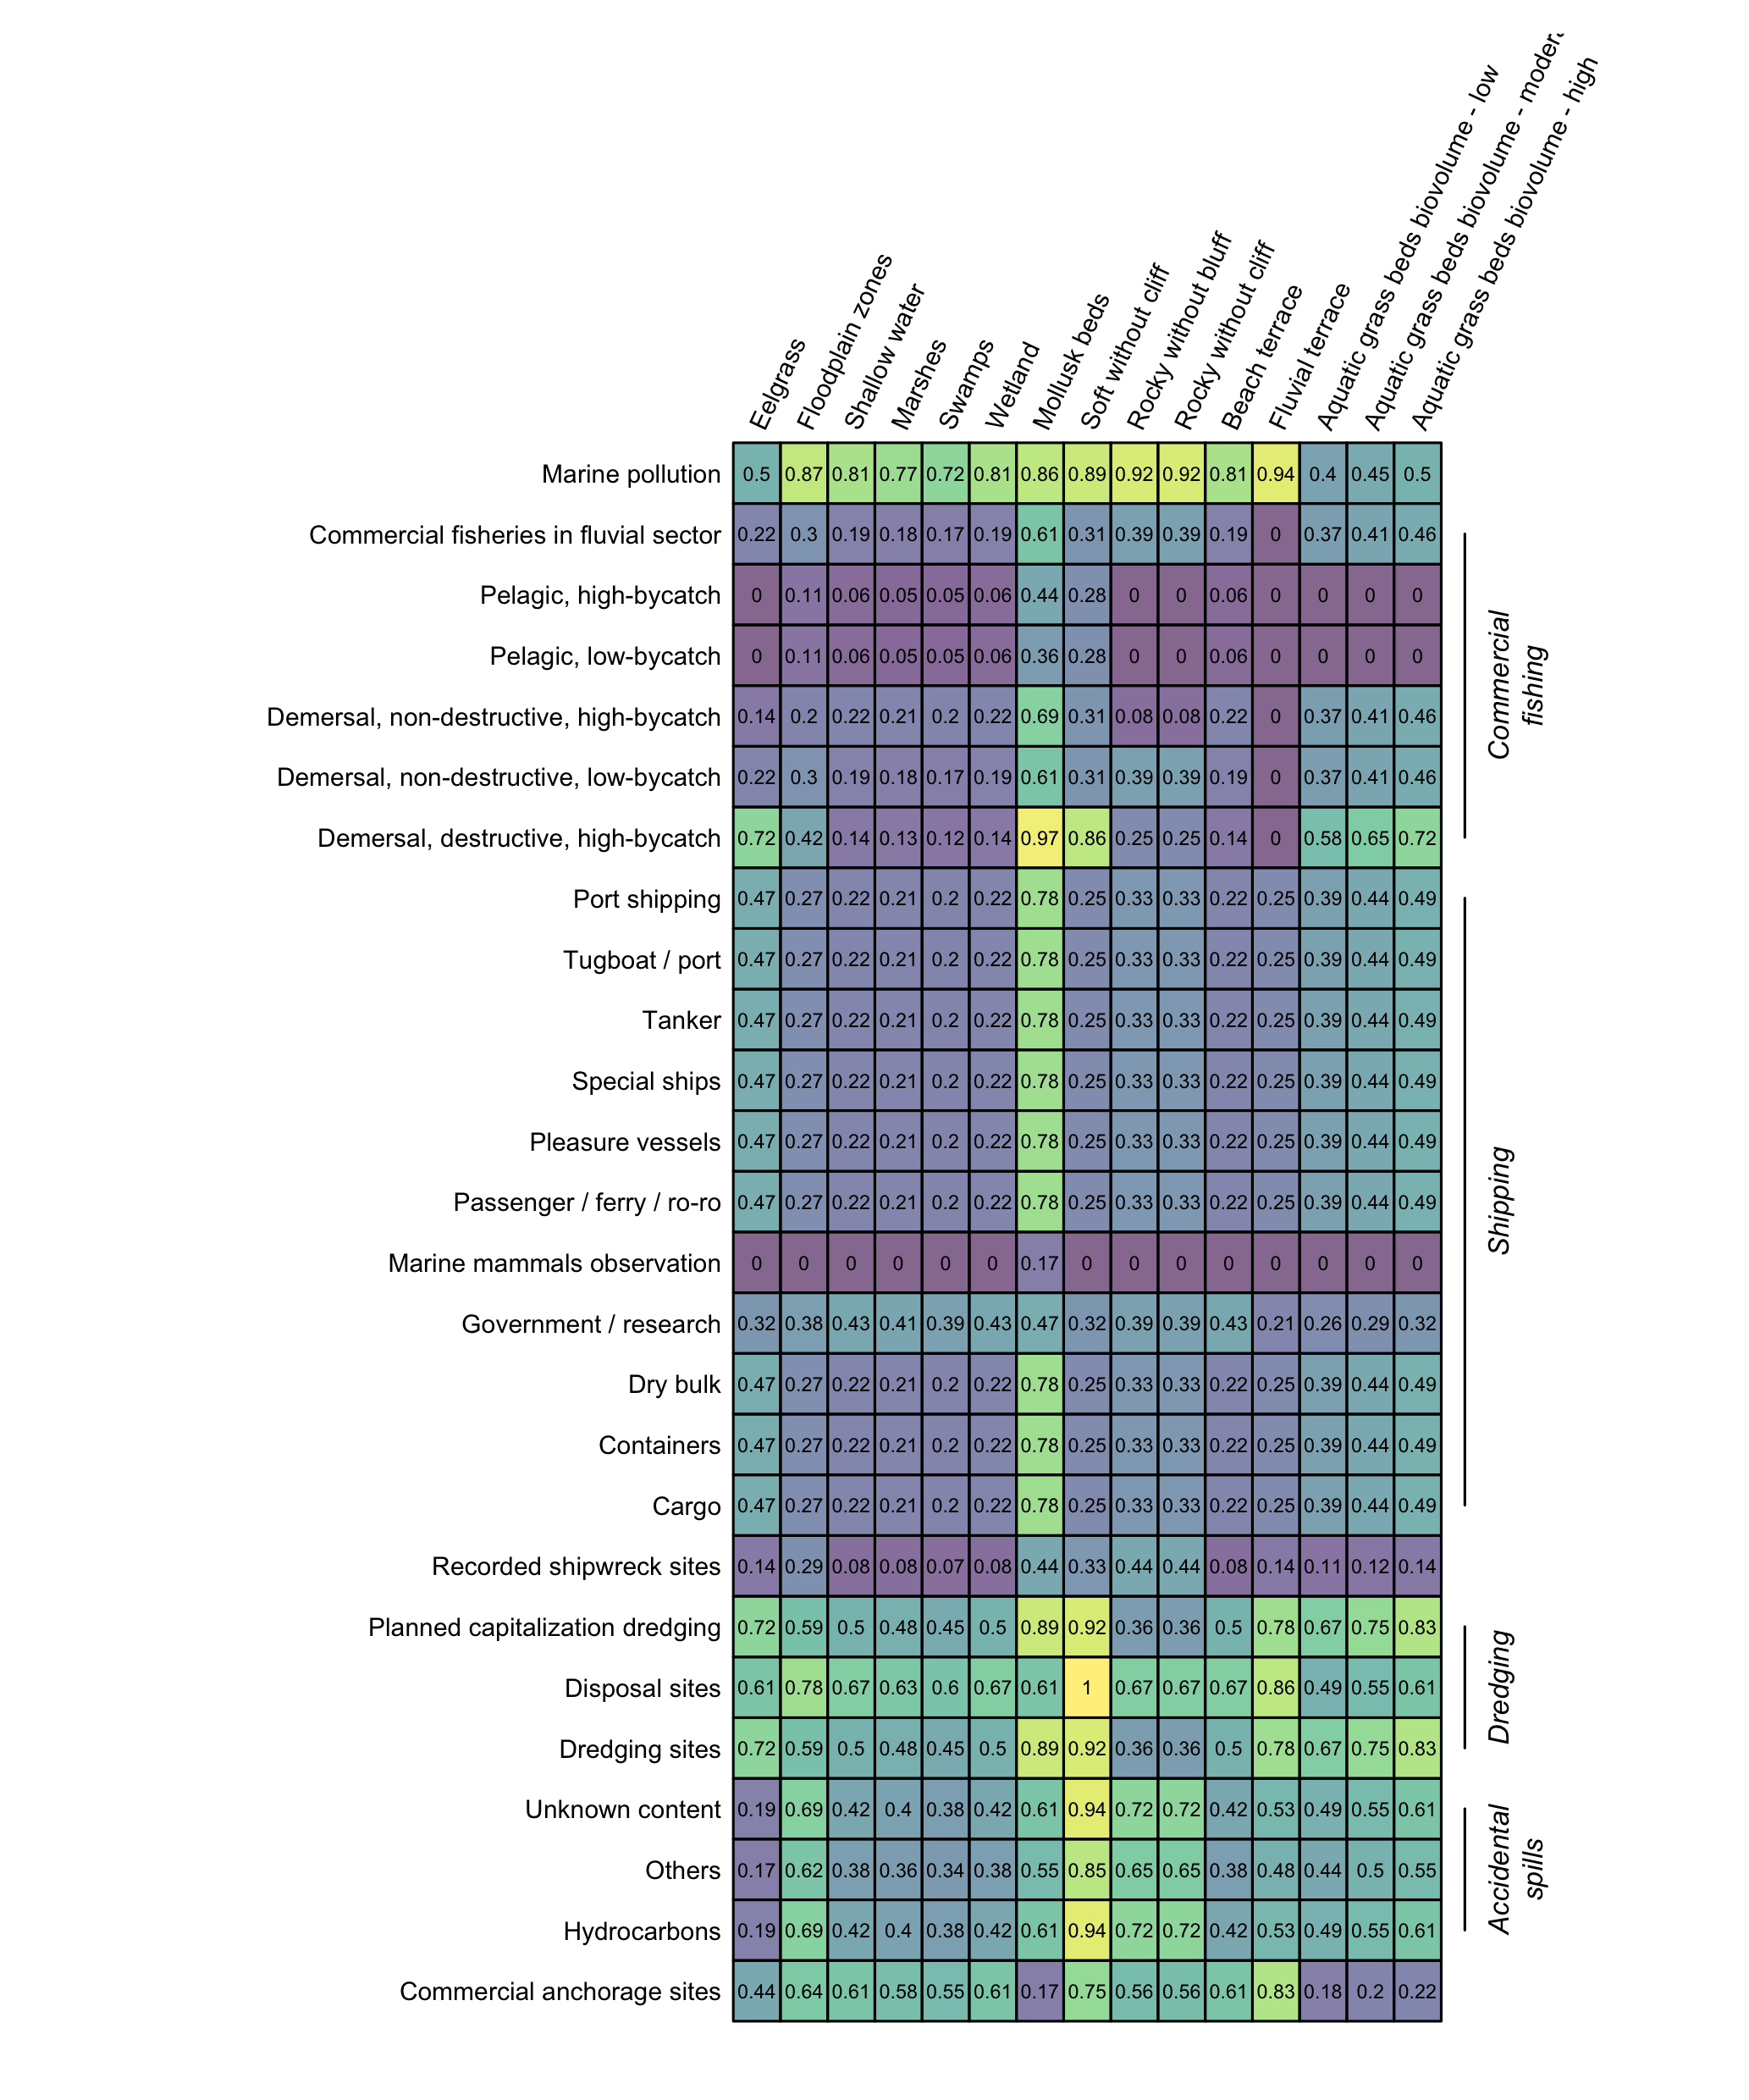
Figure 4.104: Relative vulnerability scores of habitats to environmental stressors. Scores are obtained from Kappel et al. (2012) and normalized between 0 and 1 using the maximum vulnerability score among habitats considered (i.e. 3.6). Original scores from Kappel et al. (2012) can be obtained by multiplying matrix values by 3.6.
4.4.1.2 Habitats of importance to wildlife and plant species
The vulnerability of habitats identified for their importance to life cycles and special status species cannot be assessed using the same approach used for natural environments. These sites differ from the habitats presented above in that they are environments whose characteristics may vary, but which perform essential functions for the maintenance of certain species, or are deemed important for the conservation of certain special status species. As such, the vulnerability of these sites cannot be assessed in the same way as the assessment presented in the previous section. An alternative approach using species-based criteria rather than habitat-based criteria was used to assess their relative vulnerability to the effects of the stressors under consideration.
Exercises to assess species vulnerability to the effects of stressors are less common in cumulative effects assessments, although some assessment processes do exist (e.g. Maxwell et al., 2013; O’Hara et al., 2021; Trew et al., 2019). These assessments primarily involved marine megafauna species (e.g. whales and sharks) and species at risk. However, these publications do not cover all species and stressors included in this assessment. They do provide a set of criteria for assessing species vulnerability to stressors. We used a similar process to determine the vulnerability to marine vessel activities of environments of importance to species in the St. Lawrence and Saguenay rivers.
The criteria used to assess species vulnerability to the effects of marine vessel activities are taken from Maxwell et al. (2013): 1) the frequency of stressors, 2) whether the effect of the stressor is direct or indirect, 3) the resistance of the species to the effects of the stressor, 4) the recovery time of the species, 5) the relative effect on reproduction, and 6) the relative effect on the population (Table 4.22). We added two criteria to this list in order to consider regional particularities specific to the St. Lawrence and Saguenay rivers, namely 7) the status of the species and 8) whether the species is resident in the study area (Table 4.22).
| Vulnerability criteria | Rank | Categories | Description | Examples |
|---|---|---|---|---|
| Frequency | 0 | Never | ||
| What is the frequency of the stressor? | 1 | Rare | Infrequent, but enough to affect long-term dynamics or populations | Hydrocarbon spills |
| 2 | Occasional | Frequent, but irregular | Toxic algae blooms | |
| 3 | Annual or regular | Frequent and often seasonal or periodic | Leaching due to seasonal precipitation | |
| 4 | Persistent | More or less constant annually over a number of years or decades | Persistent hypoxic zones or transportation of goods | |
| Direct or indirect effect | 0 | No effect | ||
| How does the stressor affect individuals? | 1 | Distant indirect effect | The effects are more than one degree away | Distant trophic cascade, ecosystem degradation |
| 2 | Indirect effect | The stressor affects the individual via an indirect link | Prey, food resource, direct trophic link | |
| 3 | Direct minor effect | A direct effect that affects mechanisms other than mortality, such as metabolism, physiology or behaviour | Changes in marine mammal behaviour due to marine traffic | |
| 4 | Direct major effect | Mortality | Bycatch in fishing gear or collision with a vessel | |
| Resistance (probability of mortality) | 0 | No effect | ||
| How likely is it that the stressor affects an individual’s mortality? | 1 | Low | Unlikely to cause mortality (0-33%) | Anthropogenic noise |
| 2 | Moderate | Moderate probability of causing mortality (33-66%) | Domoic acid | |
| 3 | High | High probability of causing mortality (66-100%) | Massive reduction of food resources | |
| Recovery time (years) | 1 | <1 | ||
| How long does it take an individual to recover from exposure to the stressor? | 2 | 1-10 | ||
| 3 | 10-100 | |||
| 4 | >100 | |||
| Effect on reproduction | 0 | No effect | ||
| How much does the stressor affect the reproduction of individuals? | 1 | Low | Affects certain aspects (e.g. behaviour) without affecting reproductive capacities | Temporary relocation of feeding grounds |
| 2 | Moderate | Decreased reproductive capacities | Overall reduction in resource availability resulting in reduced reproduction | |
| 3 | High | Direct mortality | Mortality resulting in no reproduction | |
| Effect on the population | 0 | No effect | ||
| How are the effects distributed across the population? | 1 | Low | Affects one individual at a time | Collision with a vessel |
| 2 | Moderate | Affects a specific portion or a high proportion of the population | Effects targeting the females in the population | |
| 3 | High | Affects the entire population | Departure from normal temperatures associated with climate change | |
| Status of the species | 0 | Aucun statut | ||
| Does the species have a conservation status? | 1 | Susceptible / Of concern | ||
| Provincial status / Federal status | 2 | Vulnerable / Threatened | ||
| 3 | Threatened / Endangered | |||
| Resident species | 1 | >0 - 6 months | ||
| Is the species present all year or for a period of the year? | 2 | 6 - <12 months | ||
| 3 | Resident |
The criteria used varied depending on the habitat types assessed. The frequency of environmental stressors was used for all habitats of importance to the species. The vulnerability of spawning and nursery sites considered the frequency of environmental stressors and the effects on reproduction and population. The vulnerability of habitats of importance to seabirds was assessed by considering the frequency of stressors and the effects on populations. Lastly, the vulnerability of habitats of importance to special status species was assessed using the frequency of environmental stressors, effects on populations, and species status. It should be noted that the vulnerability of sites of importance to special status wildlife and plant species was considered in the same way. Although wildlife and plant species respond differently to environmental stressors, our assessment uses occurrences of species at risk as a proxy for vulnerable environments rather than a species-specific assessment. The general characterization used did not allow us to differentiate between species, so we focused on criteria specific to species status.
For each combination of valued component \(CV_i\) and stressor \(S_j\), the final vulnerability score \(\mu_{CV_i, S_j}\) is obtained from the sum of the scores for each criterion:
\[mu_{CV_i, S_j} = \sum_{k \in K} C^i_{j,k}\]
where \(C^i_{j,k}\) is the value of the valued component \(i\) for the stressor \(j\) and the criterion \(k\), and \(K\) are the set of criteria considered to assess the vulnerability of the valued component \(i\).
Lastly, a relative score was assessed by normalizing the total scores by the maximum observed vulnerability value per habitat group assessed using the same criteria. Spawning and nursery sites were the first group, seabirds the second, and special status species the third. The final vulnerability scores are available in Table 4.105 and the individual criteria assessment tables per habitat category are available in Appendix 8.
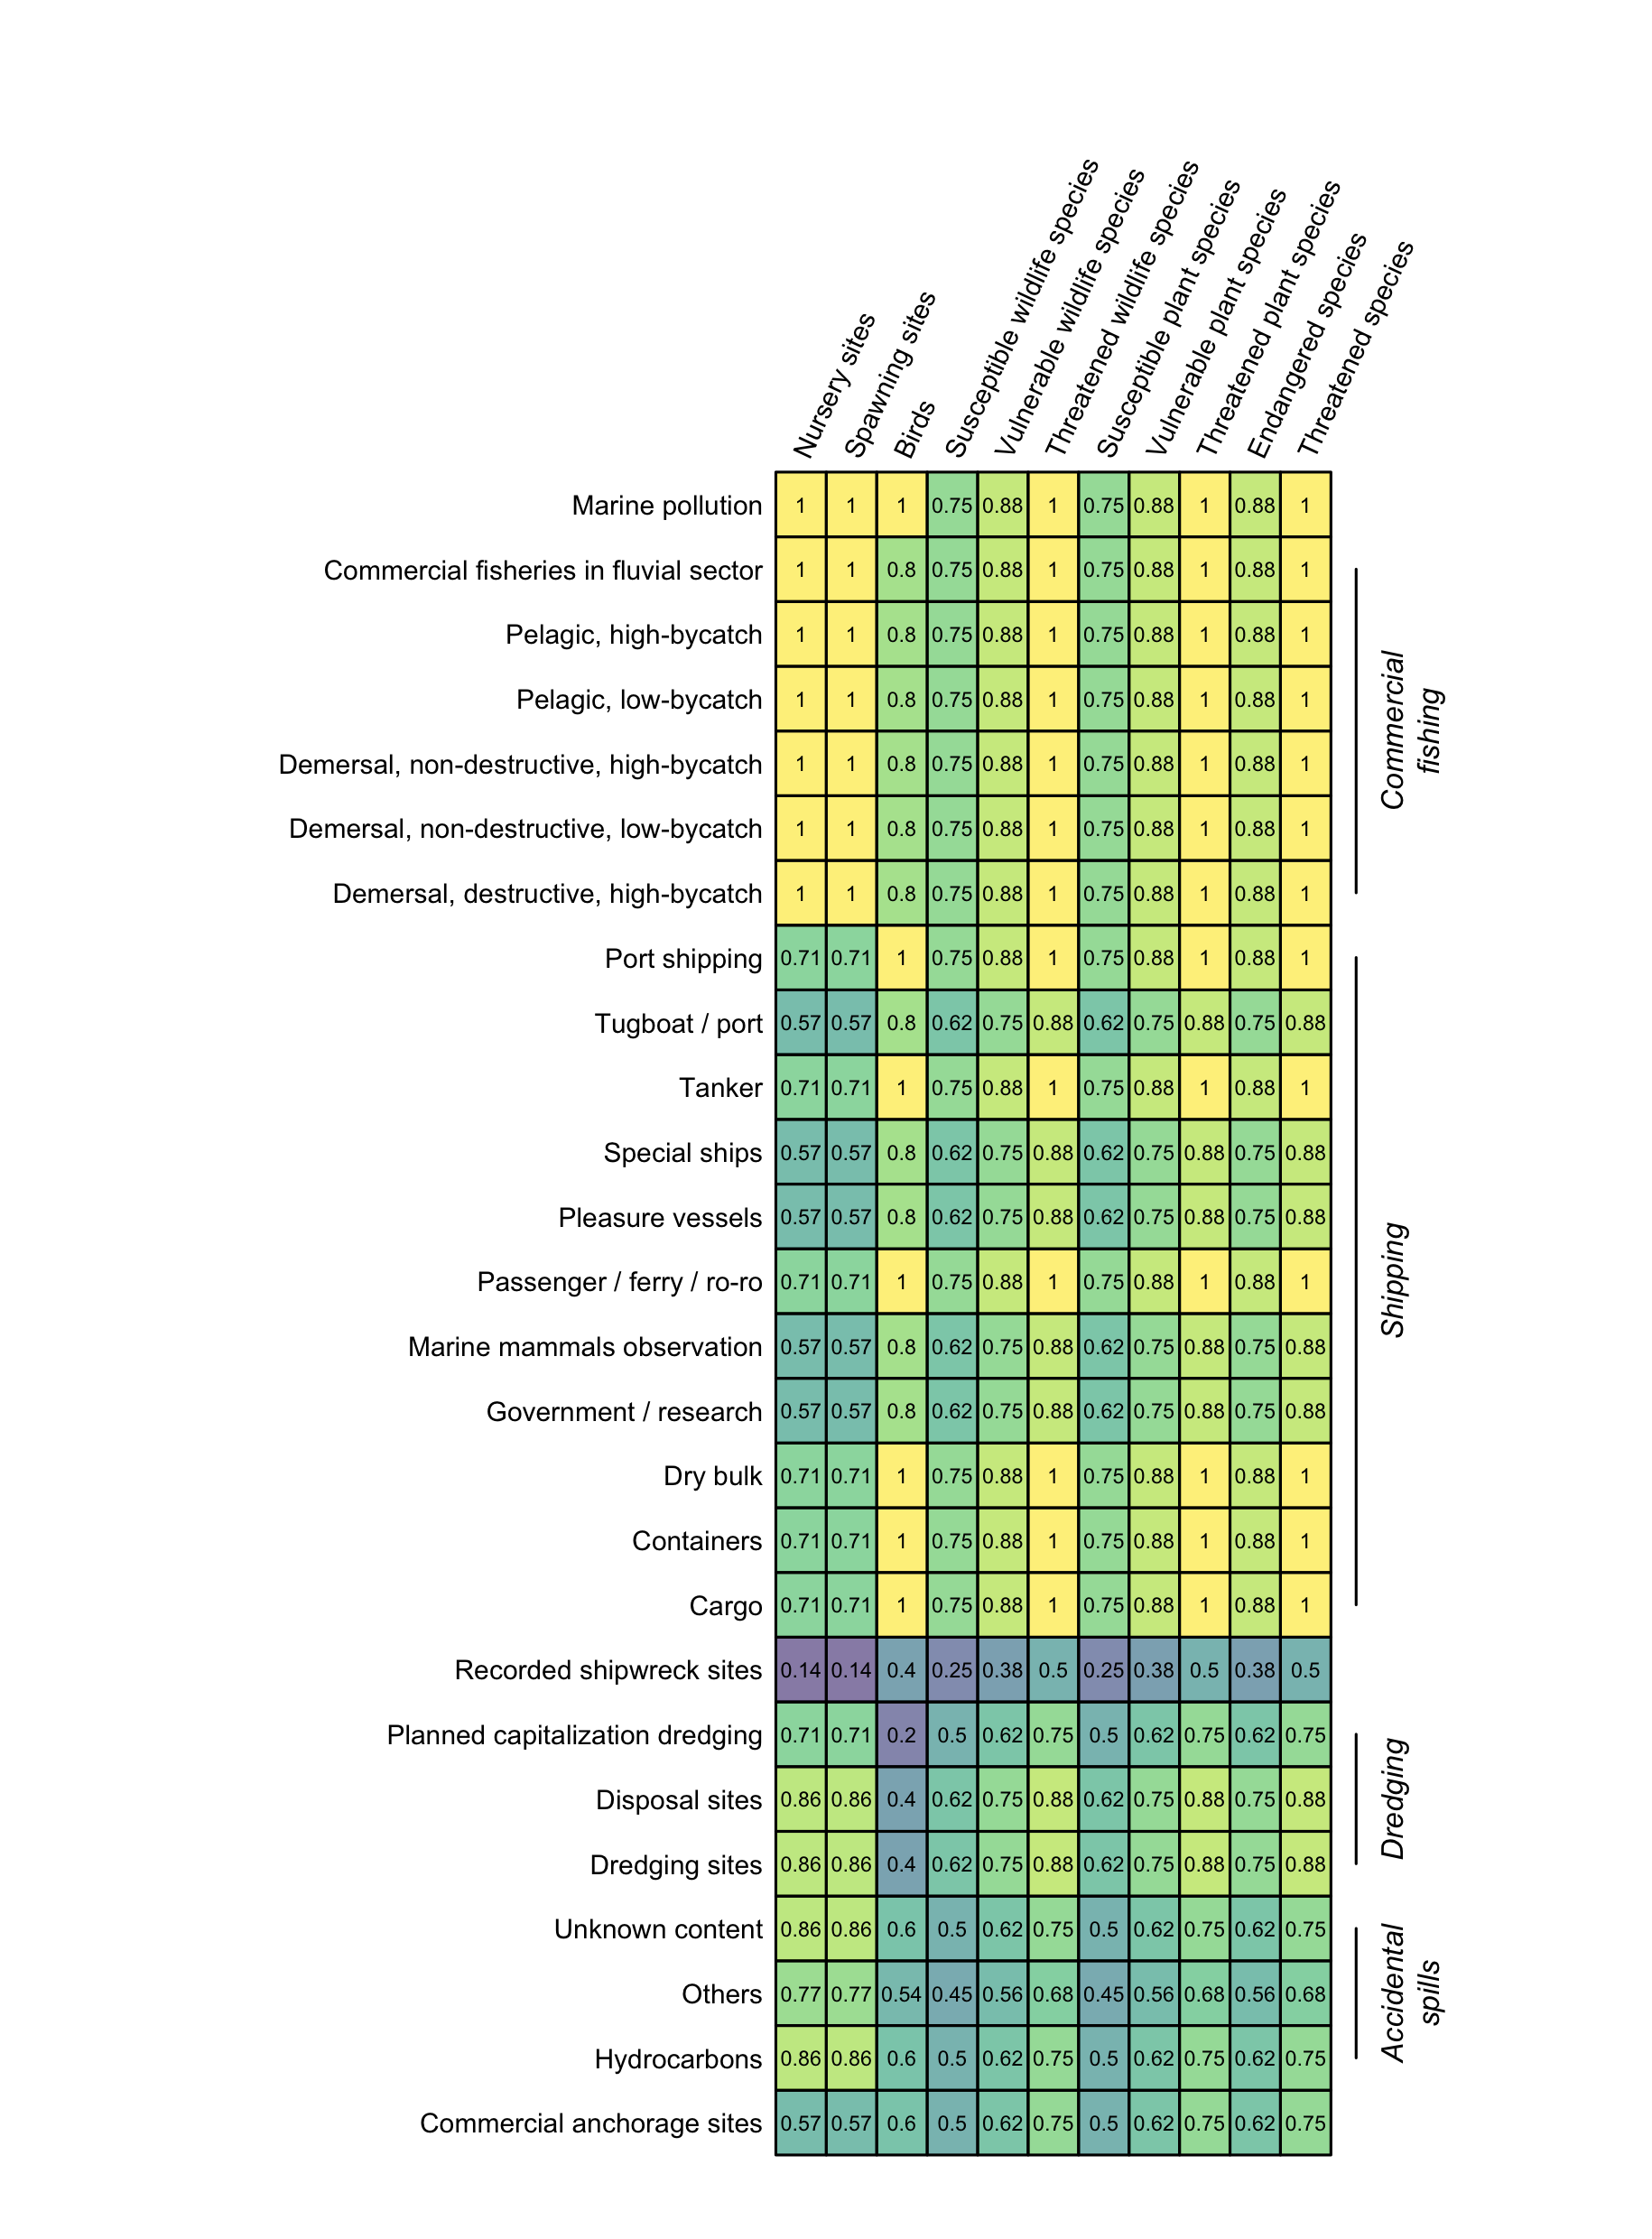
Figure 4.105: Relative vulnerability scores of habitats of importance to wildlife and plant species to environmental stressors.
4.4.2 Bank integrity
Several environmental stressors of anthropogenic and natural origins are added to the natural geomorphological mechanisms that govern the dynamics of bank erosion. With respect to anthropogenic pressures, the factors exerting a particular impact on bank erosion are: wave action caused by marine traffic, flow management, dredging, bank artificialization, and coastal infrastructure and activities (Bernier et al., 2020; Bernier et al., 2021). Climate change may also impact bank erosion by altering flood dynamics and water flows (Bernier et al., 2020; Bernier et al., 2021). In our assessment, shipping and dredging are the stressors related to marine vessel activities with an established link to bank erosion. This means that we considered bank vulnerability to erosion from the other environmental stressors identified in our study to be zero.
The vulnerability scores assigned to shipping and dredging were directly informed by the data used to characterize bank integrity in the study area, which provides a characterization of bank susceptibility to erosion by dividing bank state into three erosion index levels, with the third level identifying banks that are not vulnerable to erosion (Bernier et al., 2020; Bernier et al., 2021). We also distinguished between natural and artificial banks, assigning a higher value to natural banks (see Full Picture of the Study Area).
We can thus classify the categories of banks based on the magnitude of their vulnerability, for which we assigned a relative vulnerability score decreasing by 10% intervals:
- Natural - Active (EI = 2): 1.
- Artificial - Active (EI = 2): 0.9.
- Natural - Semi-vegetated (EI = 1): 0.8.
- Artificial - Semi-vegetated (EI = 1): 0.7.
No comparison was made to distinguish the vulnerability of the banks to shipping from that of dredging; we instead opted to assign them similar vulnerability values (Table 4.106).
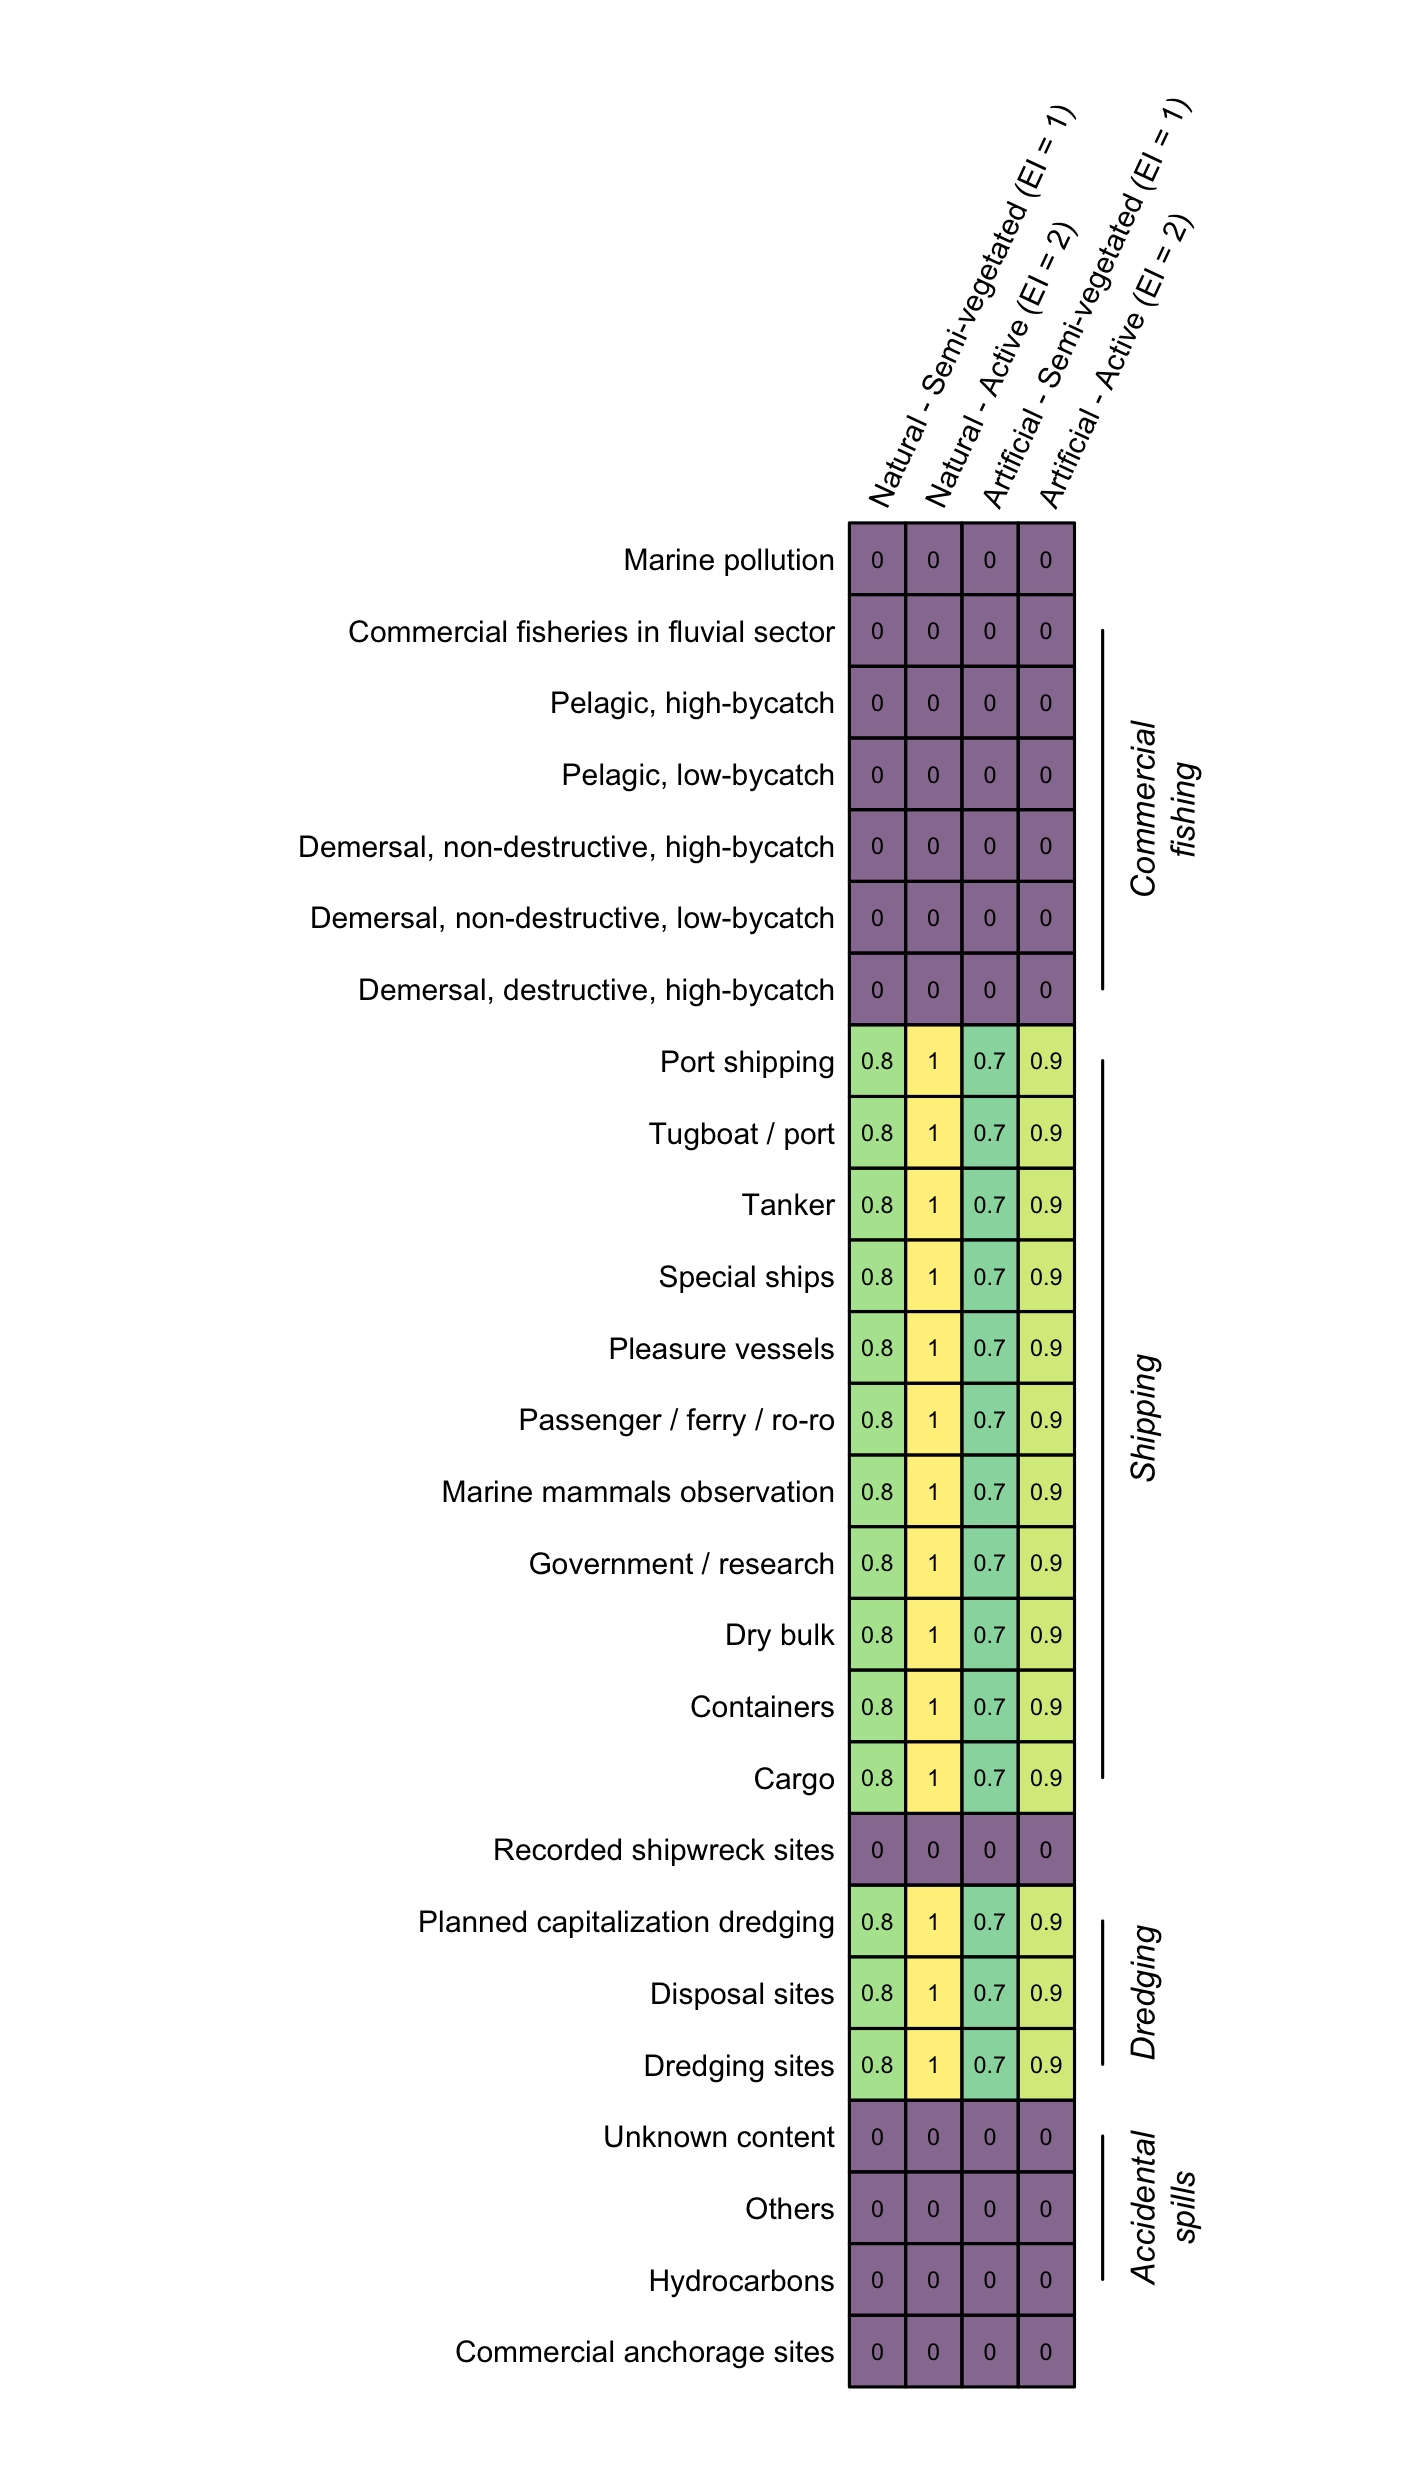
Figure 4.106: Relative vulnerability scores of coastlines to erosion from the effects of environmental stressors.
4.4.3 Marine mammals
We thank Sonia Giroux of the Marine Mammal Observation Network and Marie Guilpin of the Royal Netherlands Institute for Sea Research for their discussions and support.
The previous section presents the different criteria used to characterize species vulnerability to environmental stressors. Vulnerability of marine mammals was assessed using the set of criteria presented in table 4.22 and the equation presented in the previous section.
The Committee on the Status of Endangered Wildlife in Canada (COSEWIC) federal statuses were used to determine the status of marine mammal species.
The final vulnerability scores are available in Table 4.107 and the individual criteria assessment tables by marine mammal species are available in Appendix 9.
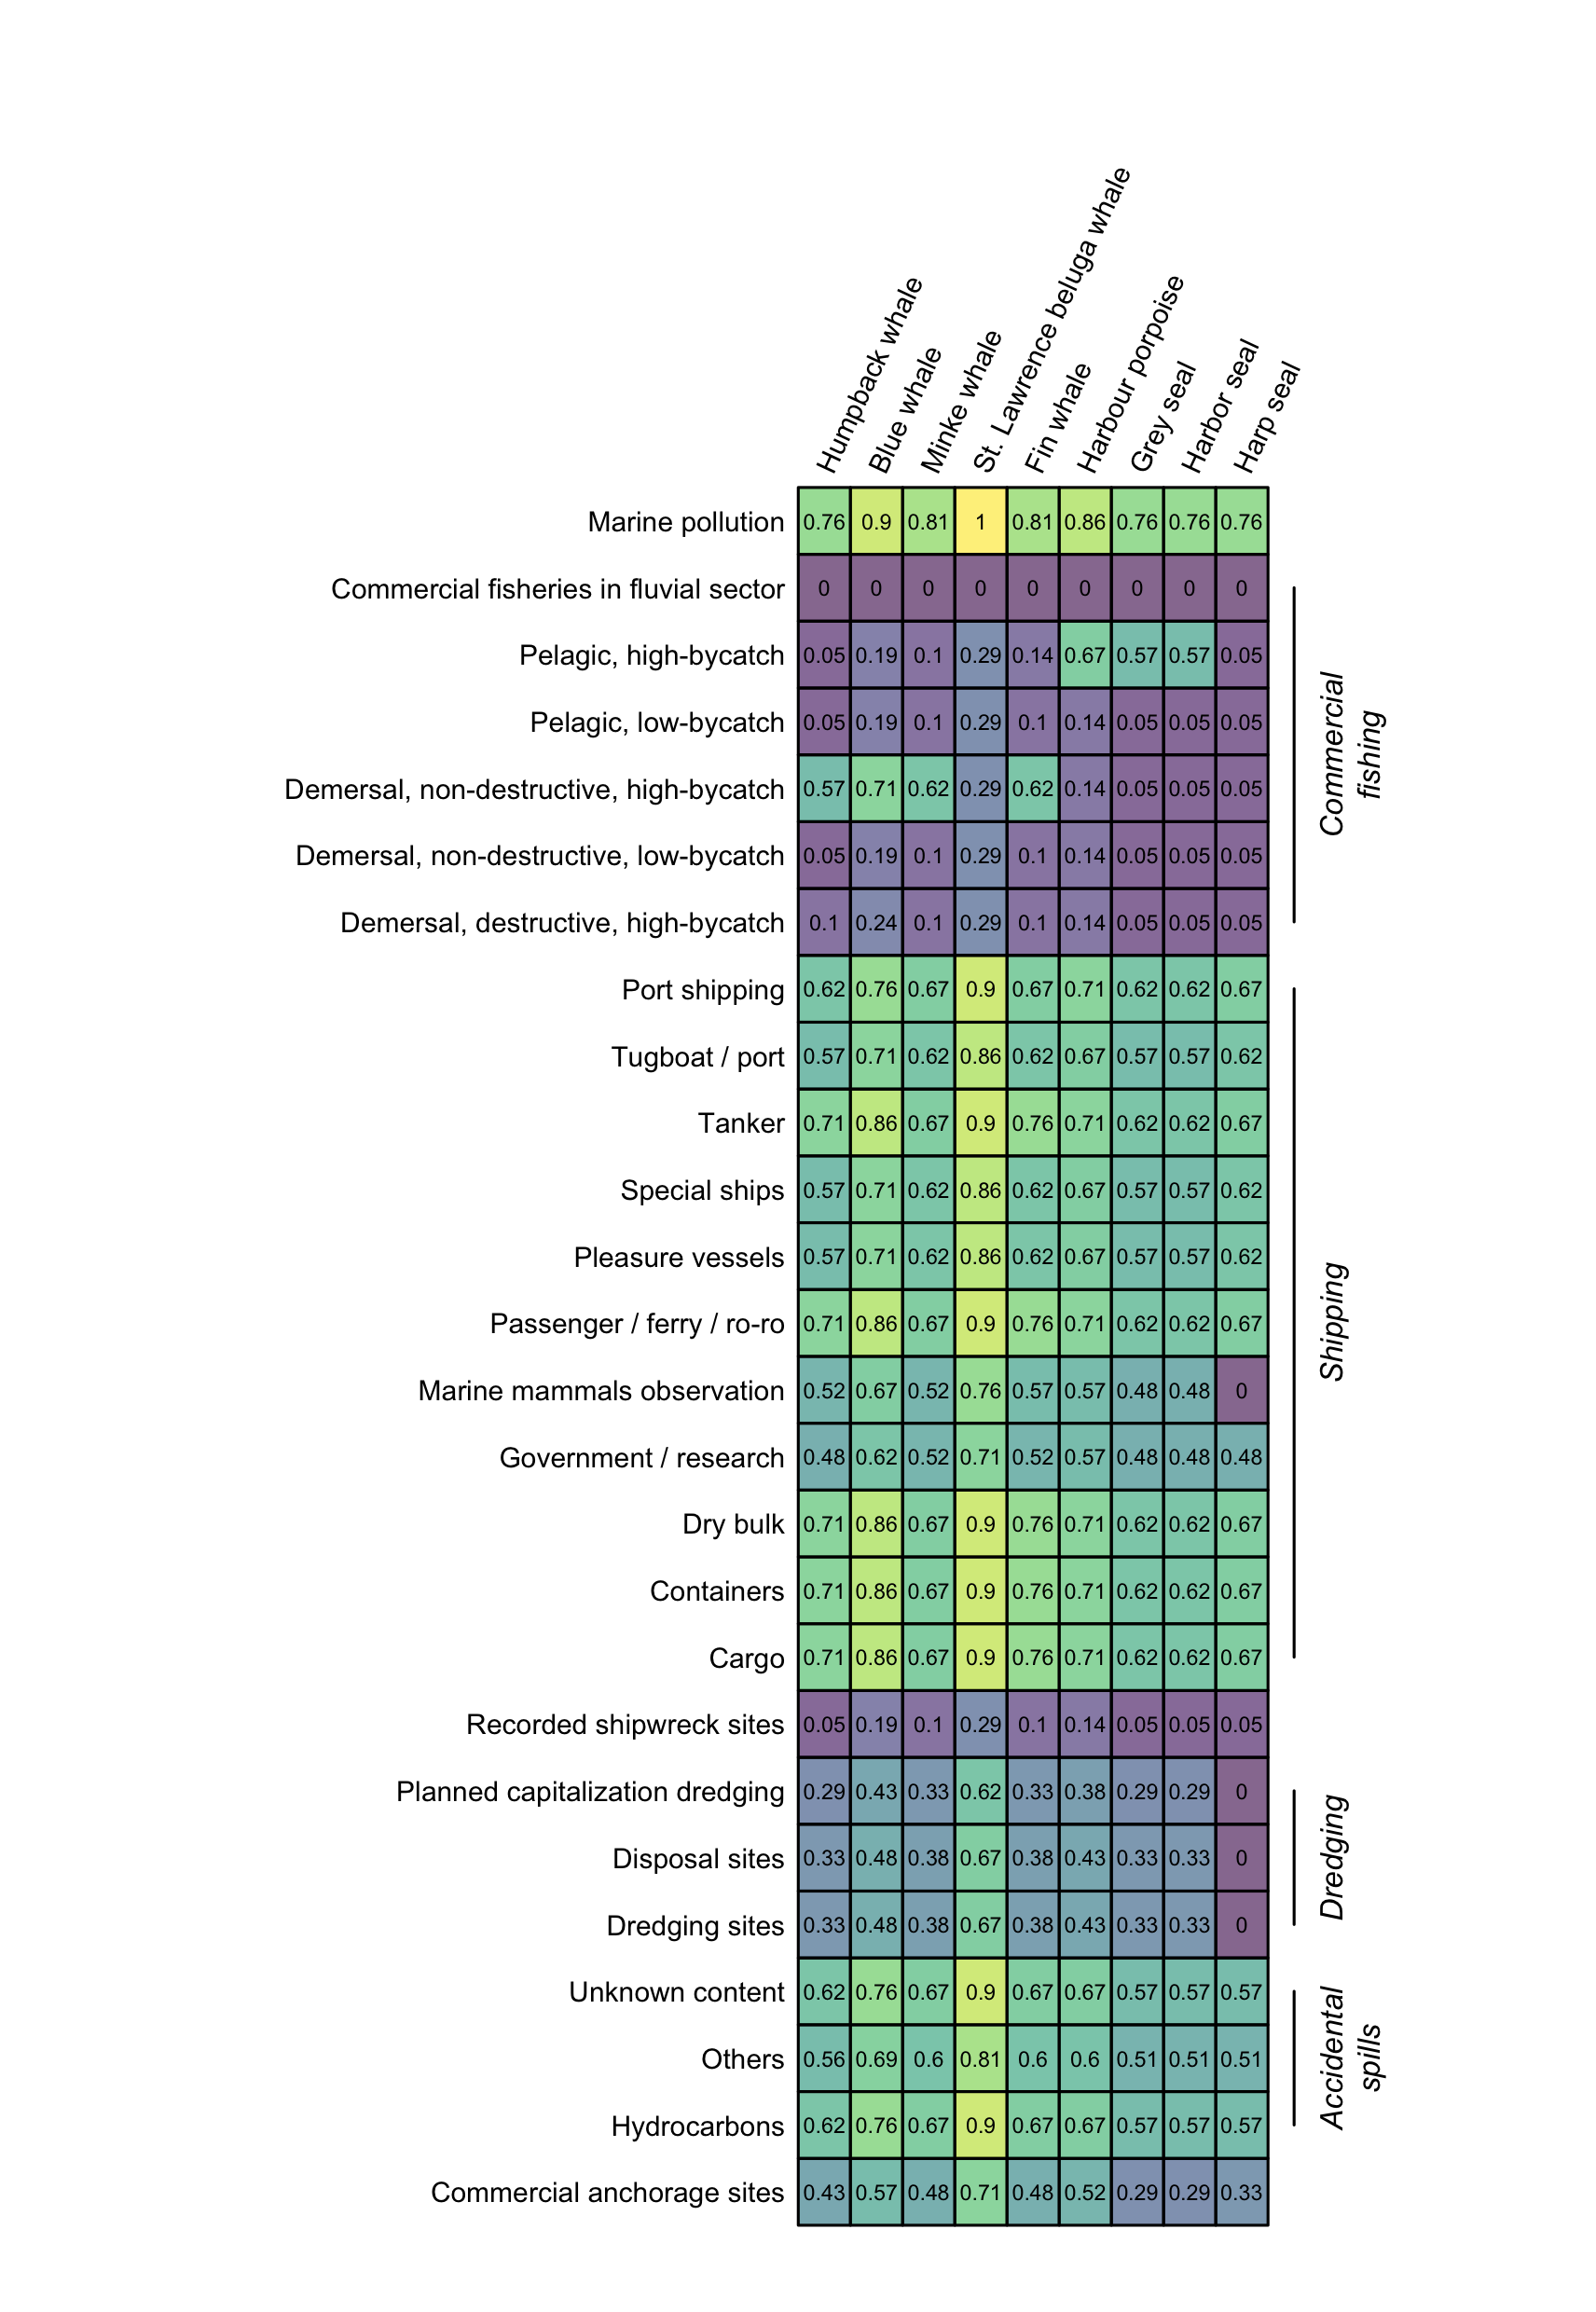
Figure 4.107: Relative vulnerability scores of marine mammals to environmental stressors.
4.4.4 Areas of cultural, heritage and archeological interest
The areas of interest are mainly sites identified by the First Nations. These areas of interest represent the use and occupation of the territory by the various participating Nations and have already been deemed important to the project on the basis that marine vessel activities may affect the conditions that underlie the exercise of First Nations’ Indigenous rights. Determining the relative vulnerability of an area of interest to an Indigenous Nation as done for the other valued components (see previous sections) would be akin to assigning a higher or lower value to sites by comparing them to each other. However, assigning a value to an area of interest is a particularly complex, if not impossible, exercise. For example, is a hunting site more valuable than an archeological site? As noted by the Grand Council of the Waban-Aki Nation (Grand Conseil de la Nation Waban-Aki (GCNWA), 2021):
[…] it is impossible to appropriately map the values assigned to particular sites or activities. The importance of a site depends on a multitude of factors. For example, although not visited on a regular basis, some places are associated with stories or legends, with the history or collective imagination of the Nation, with archeological or sacred sites, etc.
In this regard, and after discussions with a number of representatives of the participating First Nations, we deemed that it would be inappropriate to assign a vulnerability score to the sites identified in the context of this pilot project. Instead, we have assigned a vulnerability value of 1 for all the identified areas of interest. This does not mean that all areas of interest are automatically considered affected by marine vessel activities for the cumulative effects assessment. Rather, the cumulative effects assessment becomes the result of intersecting the distribution and intensity of environmental stressors with the distribution of areas of interest, i.e. the exposure of areas of interest to environmental stressors. This means that an area of interest exposed to several high-intensity stressors would be more affected than an area of interest that is not similarly exposed to the environmental stressors considered.
Using a vulnerability value of 1 for all areas of interest has an effect, however, on the overall assessment of cumulative effects including all valued components; areas of interest receive a maximum vulnerability score, which is not the case for the other valued components considered in this assessment (see previous sections). In relative terms, the vulnerability of the areas of interest is thus considered higher than most of the other valued components included in the assessment. This necessarily imposes a bias “in favour” of the areas of interest for the overall assessment. However, the results of the assessment are presented and discussed by individual valued components to overcome this bias.
To ensure continuity for the vulnerability of areas of interest, a vulnerability value of 1 was also assigned to areas of public interest, i.e. protected areas and heritage sites.
R is a free software environment for statistics, data science and graphics (https://www.r-project.org/)↩︎
ArcGIS is a geographic information software (GIS) suite developed by the US company Esri (https://www.arcgis.com/index.html)↩︎
GitHub is a web-based software development hosting and management service with over 40 million users worldwide (https://github.com/).↩︎