5 Assessment results
The following sections present the main results of the cumulative effects assessment. We begin by presenting and discussing results from the partial models, i.e. cumulative stressors, cumulative valued components, and cumulative exposure; these results provide a starting point for interpreting the cumulative effects assessment results by exploring smaller portions of the full assessment. We then present the results of the full cumulative effects assessment based on the assessment general model.
5.1 Cumulative stressors and hotspots
The method used to obtain the following results is presented in section 3.2.2.1 of the report.
The assessment of cumulative stressors in the study area indicates that the entire study area is exposed to at least low levels of environmental stressors related to marine vessel activities (Figures 5.1 and 5.2). Large port cities and the waterway are particularly exposed to stressors. In the fluvial sector, the Quebec City, Trois-Rivières, Sorel-Tracy, and Montreal regions are environments at risk from the effects of stressors; in the marine sector, the regions most at risk are the south of Île d’Orléans, the mouth of the Saguenay River, Rivière-du-Loup, Rimouski, Matane, and Baie-Comeau. Since the fluvial sector is much narrower than the marine sector, environmental stressors are more concentrated there than in the marine sector, where stressors are widespread but spatially diffuse. All of these observations are reinforced by the results of cumulative hotspots, which allow for a more precise delineation of the environments most exposed to the accumulation of high-intensity stressors (Figure 5.3).
The most prevalent environmental stressors are shipping throughout the study area and commercial fisheries (Figure 5.4). Marine pollution is also widespread in the study area (Figure 5.4), an expected observation since it was assessed using the distribution of shipping and fishing, among other things (see section 4.2.7). The distribution of anchorages, accidental spills, dredging activities, and shipwreck sites, on the other hand, are distributed in an ad hoc manner throughout the study area (Figure 5.4). A number of these stressors, however, overlap at high intensity within environments that are also exposed to shipping, fishing, and pollution; these stressors thus contribute to the total exposure of the environments most exposed to cumulative stressors in the study area.
Figure 5.1: Distribution of cumulative stressors in the study area.
Figure 5.2: Distribution of normalized cumulative stressors in the study area
Figure 5.3: Distribution of cumulative hotspots in the study area
Figure 5.4: Distribution of cumulative stressors in the study area for each category of environmental stressors considered in this study. In cases where the stressors is composed of a single category (i.e. anchorages and shipwrecks), this corresponds to the log-transformed and standardised intensity of those stressors.
5.2 Cumulative valued components
The method used to obtain the following results is presented in section 3.2.2.2 of the report.
The assessment of cumulative valued components shows that the entire study area is covered by at least one valued component (Figures 5.5 and 5.6). Coastal environments, however, are generally covered by a greater number of valued components. This is primarily influenced by the bank integrity and habitat valued components, which are predominantly described as coastal, and by a significant number of areas of interest in coastal environments (Figure 5.7). The entire fluvial coastal environment is characterized by several valued components, but the Lake St. Pierre region, including both upstream and downstream areas, appears to be particularly important (Figures 5.5 and 5.6). On closer examination, this region is characterized by a significant diversity of habitats and areas of interest, and has several categories of erosion-sensitive banks (Figure 5.7).
In general, the fluvial sector is characterized by more valued components than the marine sector. The area of the marine sector presenting with the greatest number of valued components is the mouth of the Saguenay River, which essentially covers the Saguenay-St. Lawrence Marine Park (Figures 5.5 and 5.6). This observation is based on the important diversity of marine mammals that frequent this region and on a large number of areas of interest (Figure 5.7). It is also important to remember that the characterization of the bank integrity valued component was limited to the fluvial sector only.
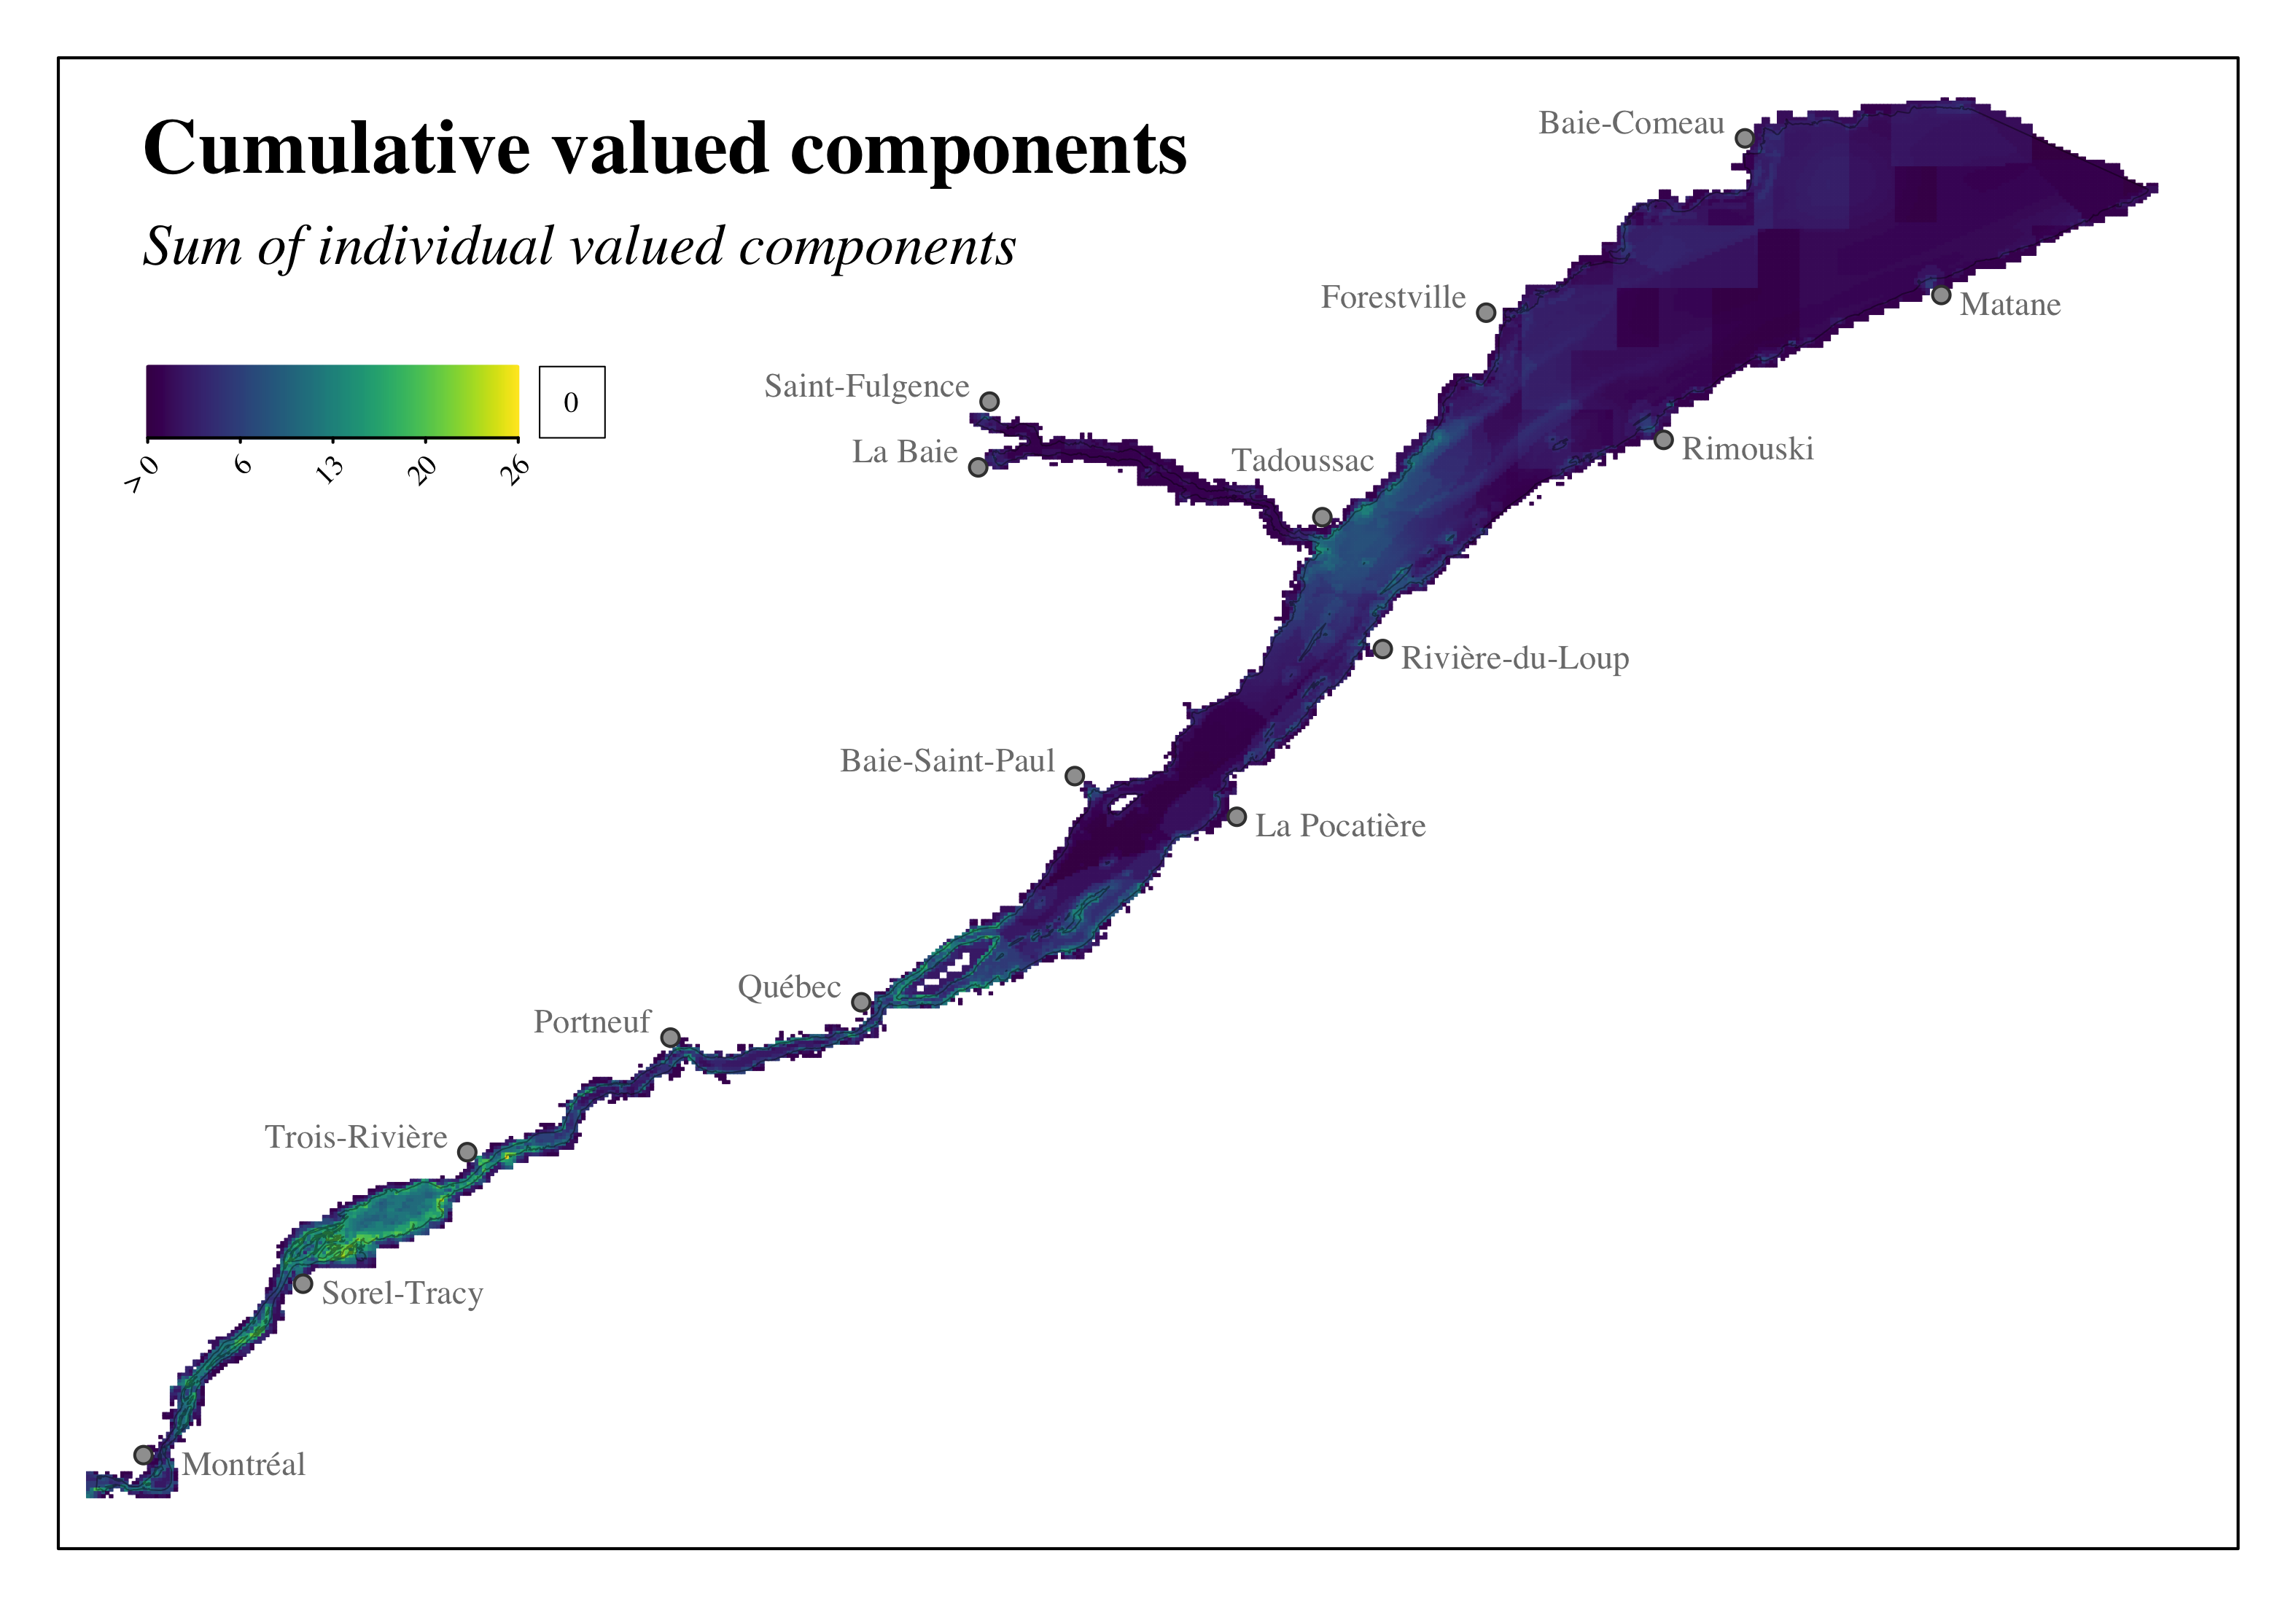
Figure 5.5: Distribution of cumulative valued components in the study area.
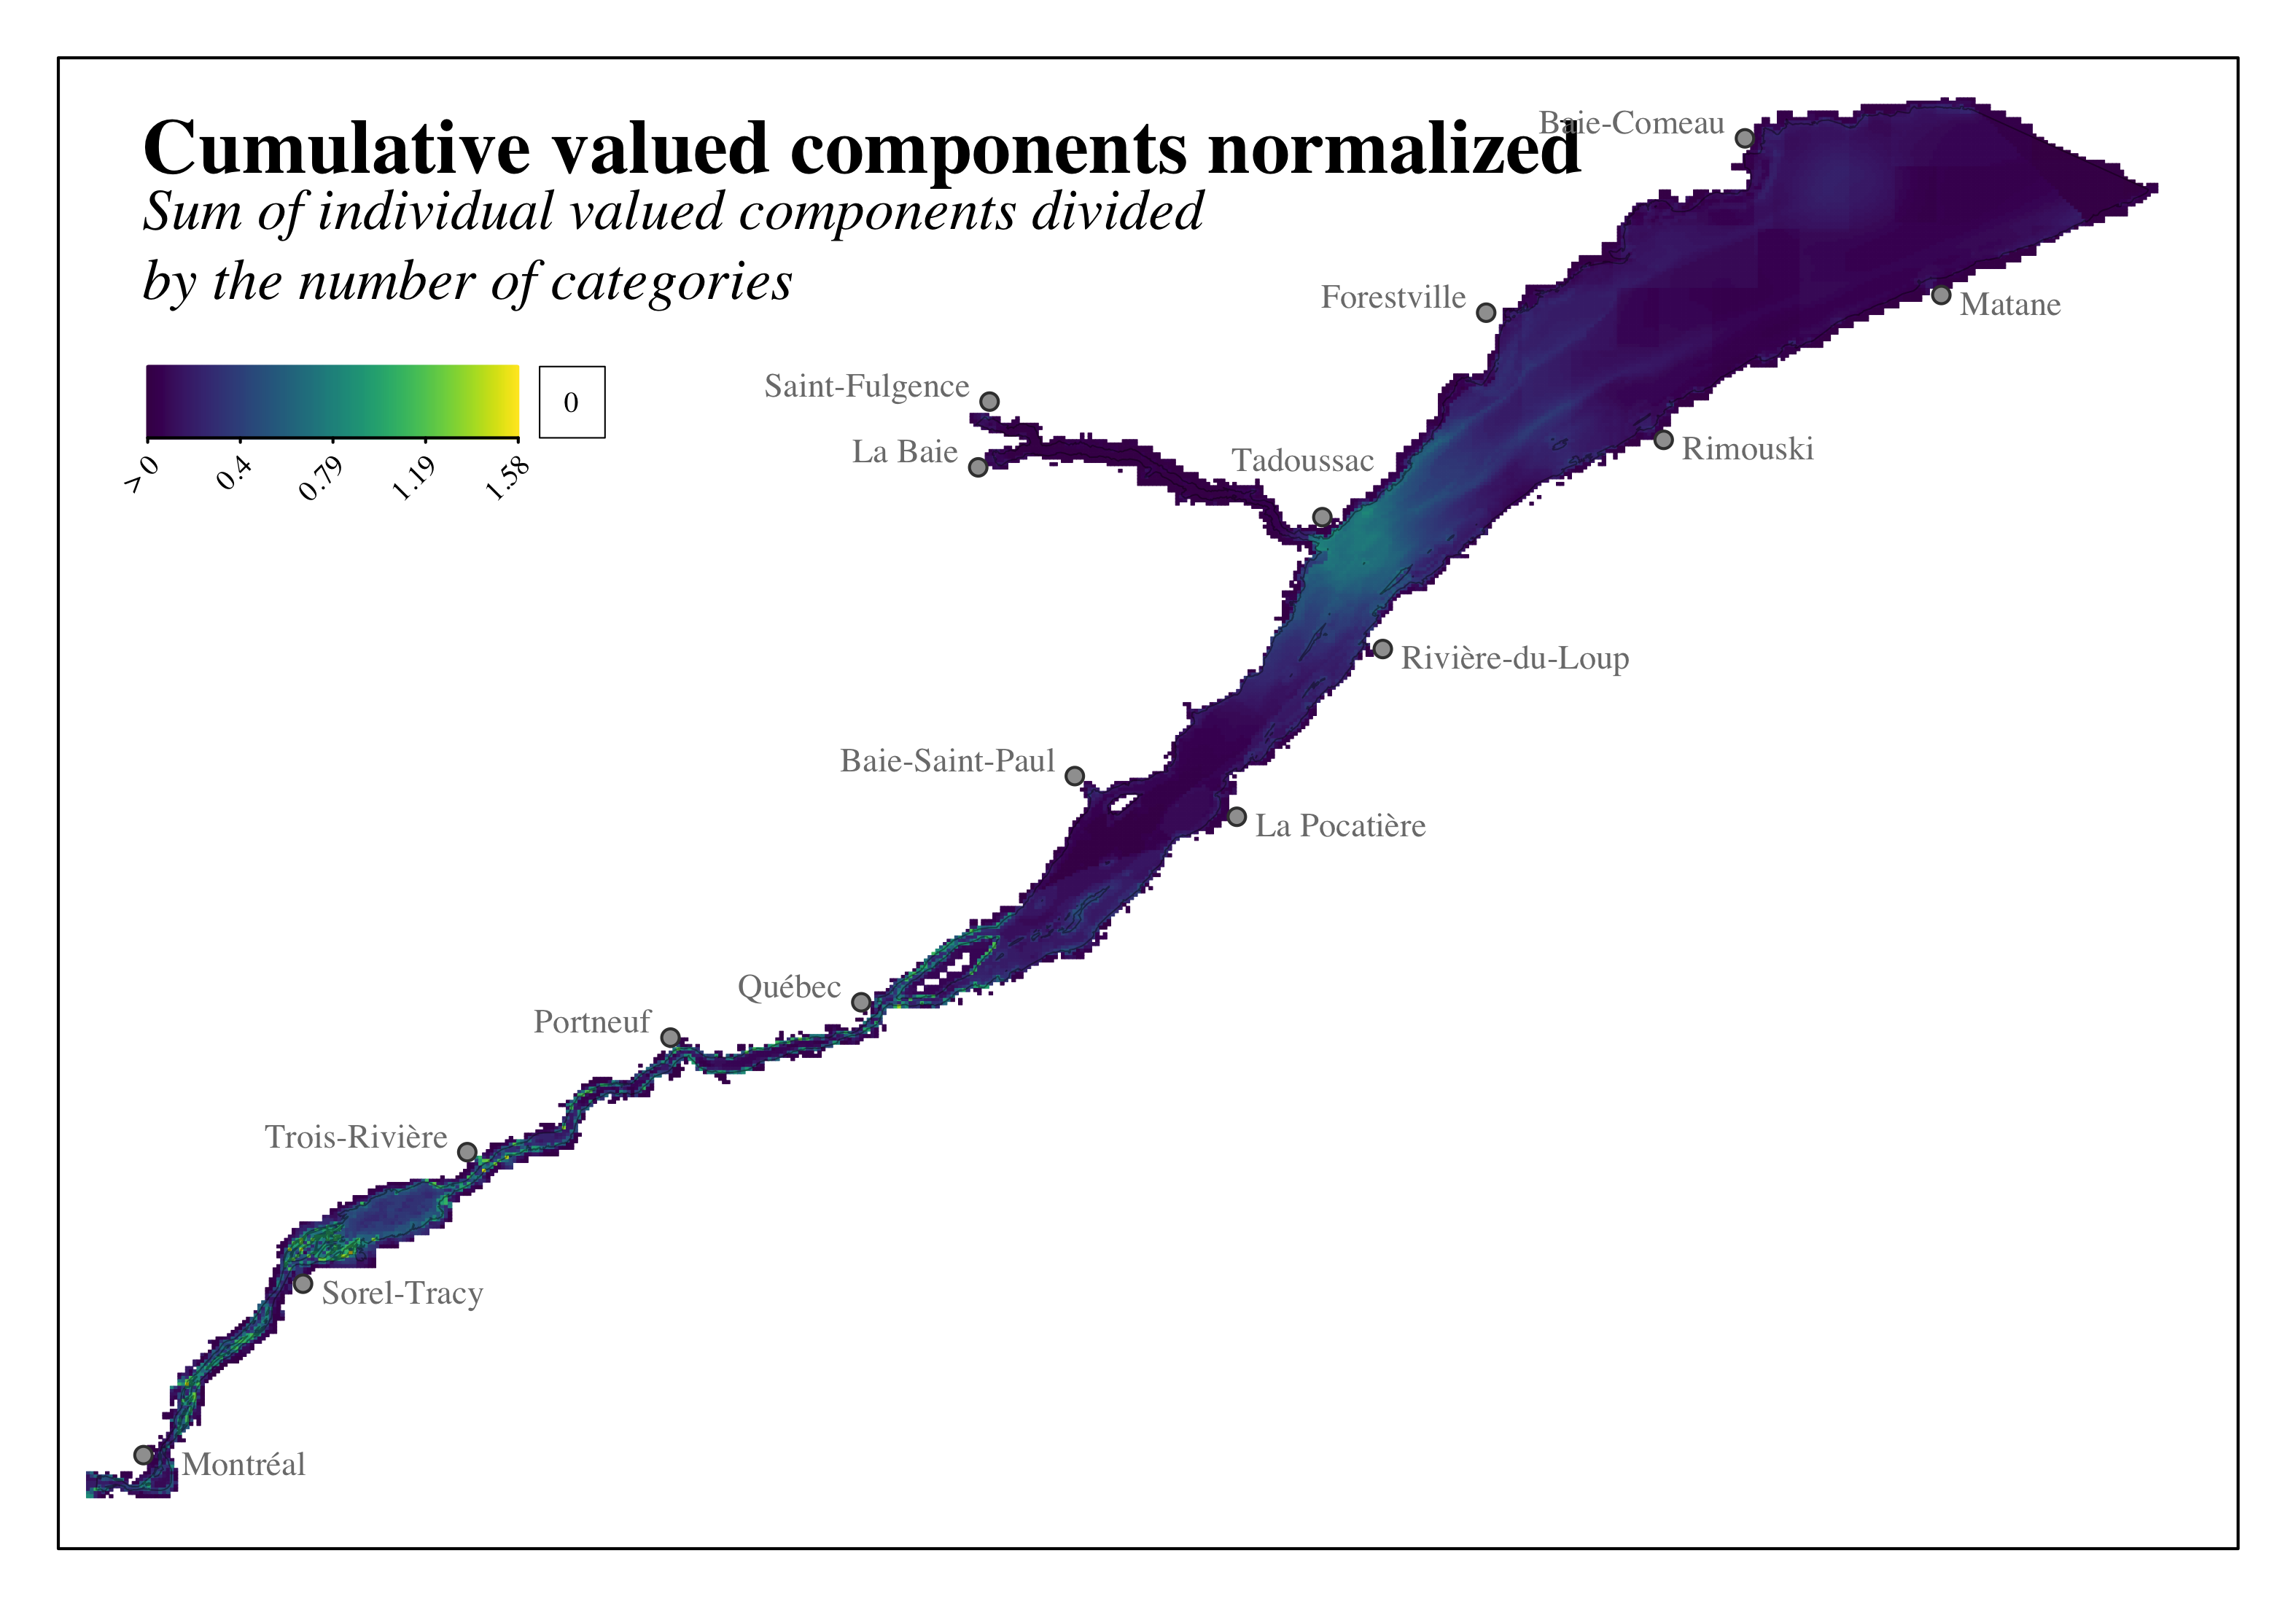
Figure 5.6: Distribution of normalized cumulative valued components in the study area.
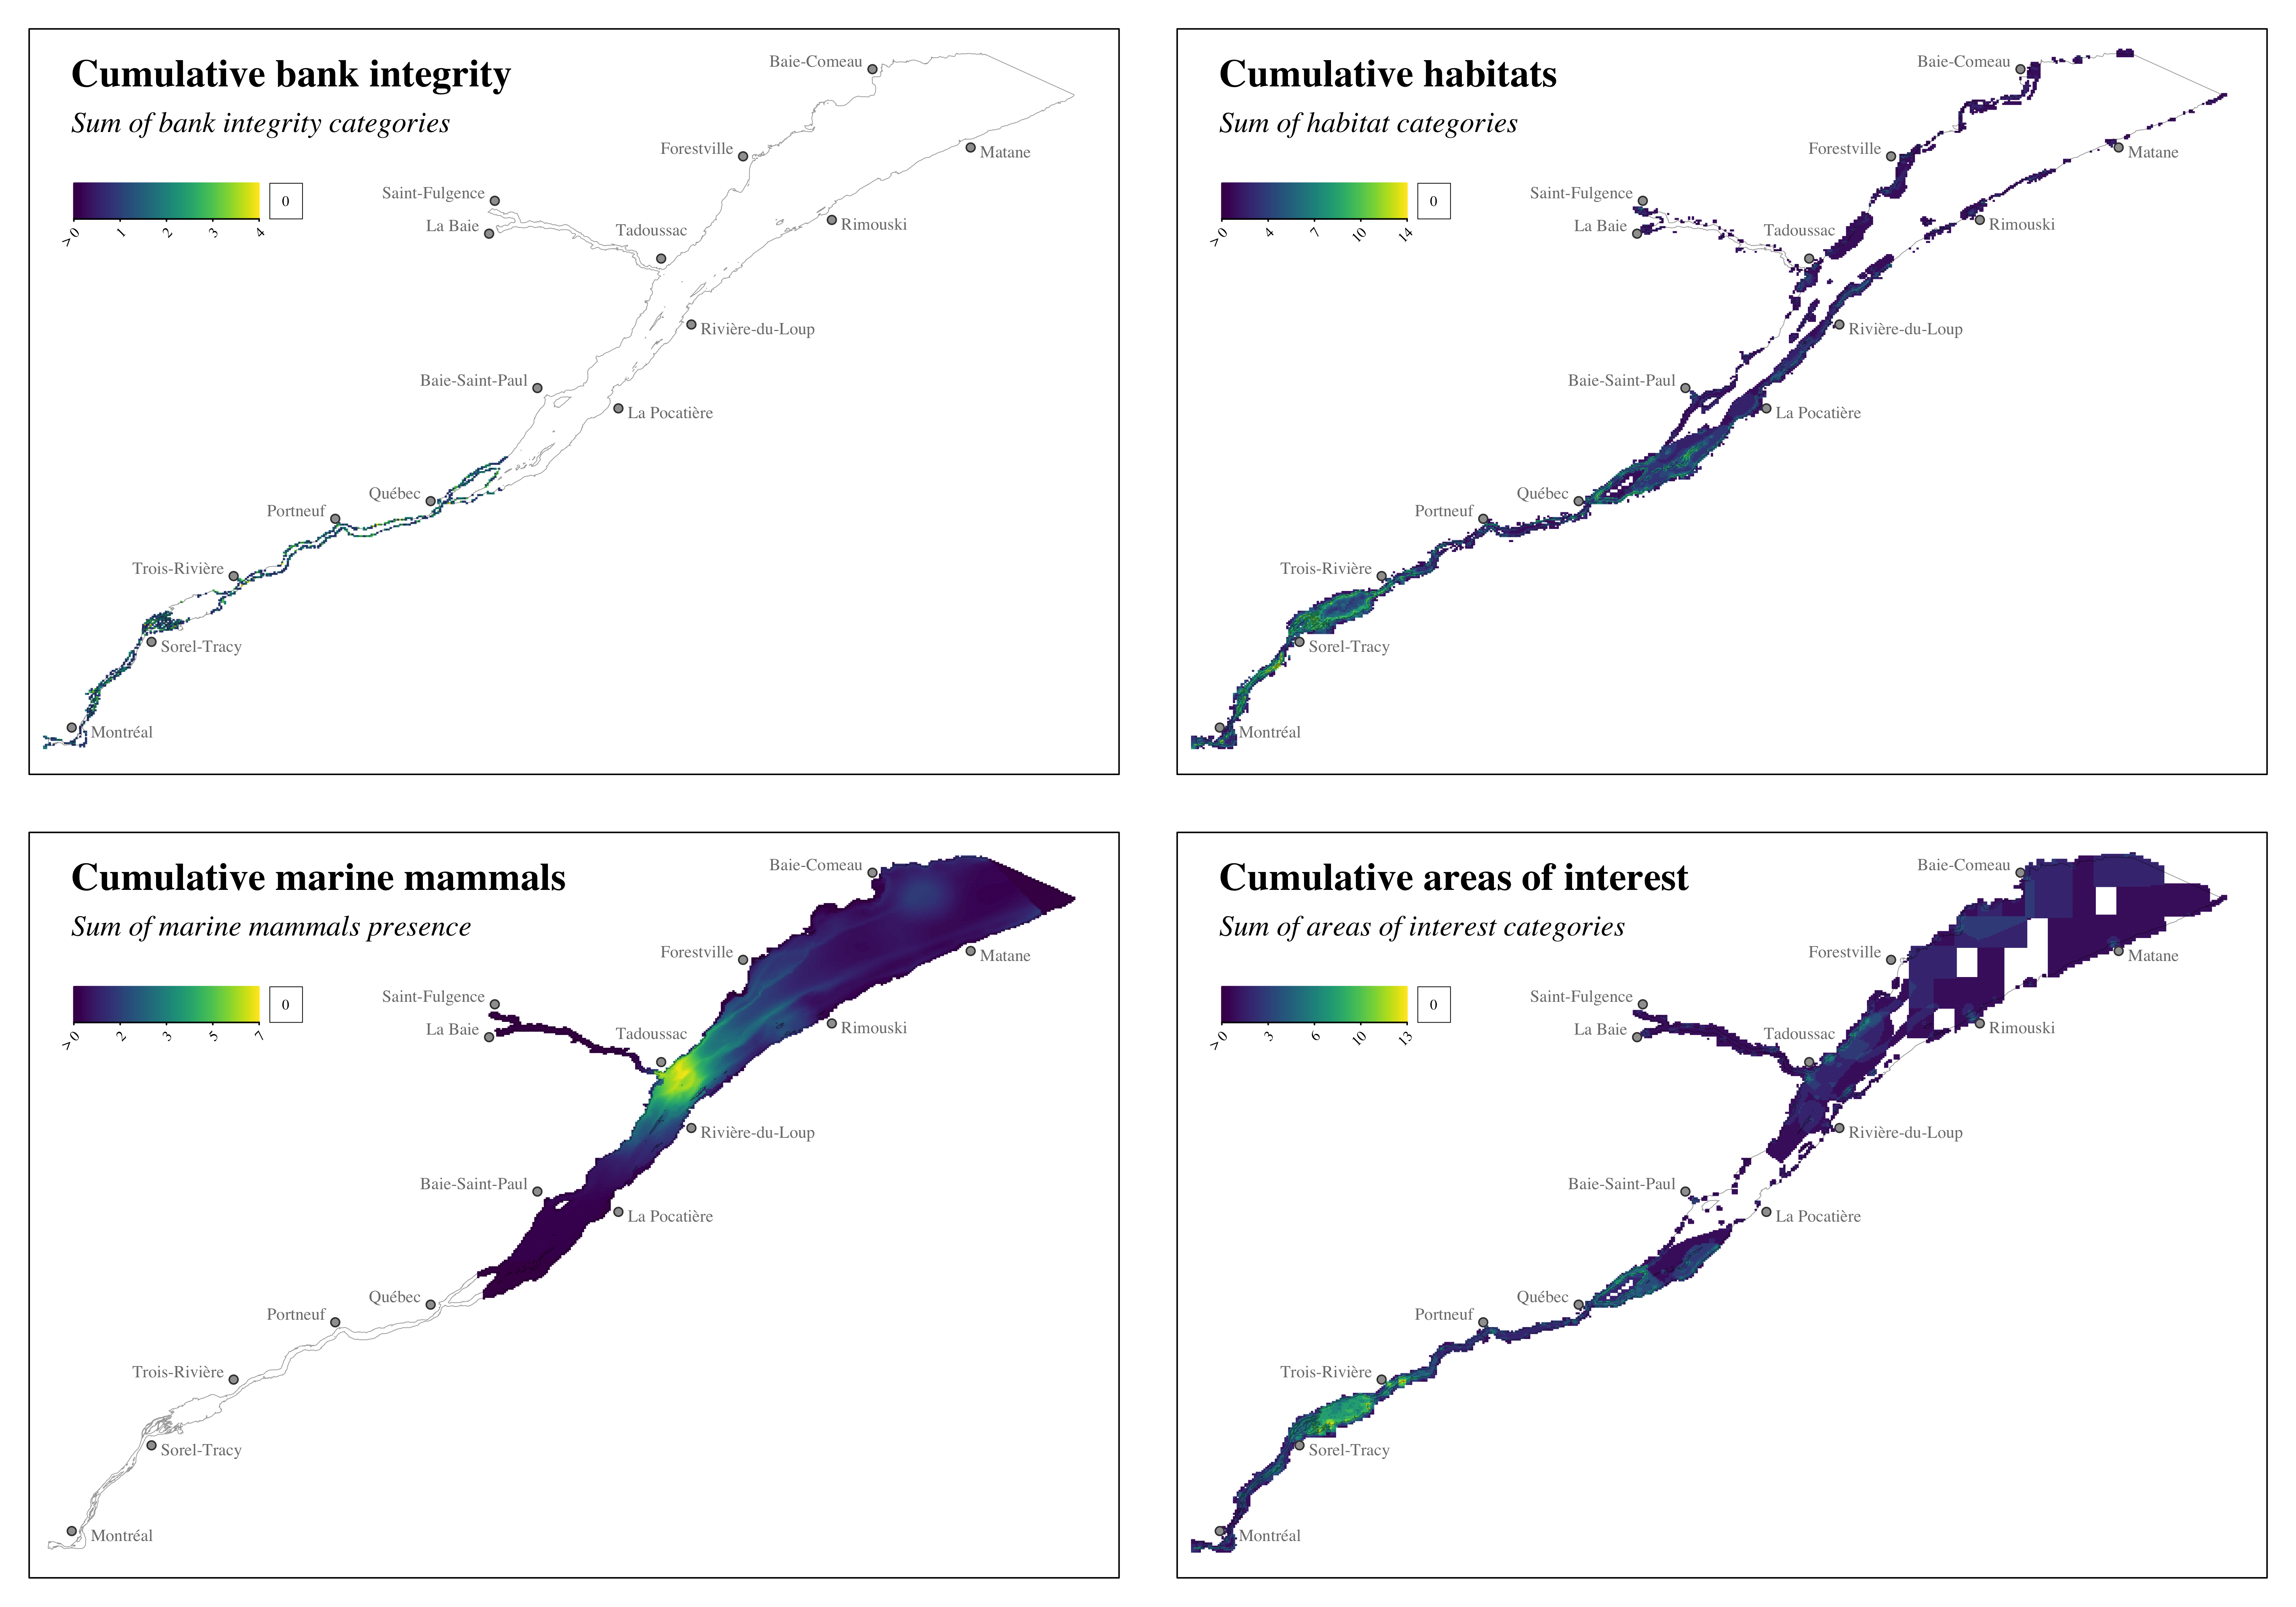
Figure 5.7: Distribution of cumulative valued components in the study area for each category of valued component.
5.3 Cumulative exposure
The method used to obtain the following results is presented in section 3.2.2.3 of the report.
As a reminder, the spatial distribution of cumulative exposure is entirely constrained by the areas of overlap between environmental stressors and valued components, i.e. stressors and valued components must occur within the same environments to obtain a cumulative exposure value. The cumulative exposure assessment shows that valued components are exposed to stressors throughout the study area (Figures 5.8 and 5.9). However, some environments appear to be particularly exposed to stressors. In the fluvial sector, the Quebec City area and the southern part of Île d’Orléans, as well as the shipping channel between Trois-Rivières and Montreal, including Lake St. Pierre, are especially exposed to stressors. In the marine sector, the area most exposed to stressors is the mouth of the Saguenay River within the Saguenay-St. Lawrence Marine Park, particularly on the north shore of the St. Lawrence River up to the portion of the Saguenay that covers the crossing between Tadoussac and Baie-Sainte-Catherine.
High-exposure environments are characterized by a significant diversity of valued components (Figure 5.5) and environmental stressors (Figure 5.1). For example, the Sorel-Tracy region, which extends into Lake St. Pierre, has several habitat types, areas of interest, and erosion-sensitive environments (Figure 5.7); this same region is also characterized by a significant presence of commercial shipping, commercial fisheries, anchorage sites, accidental spills, shipwreck sites, annual dredging operations, and a greater risk of marine pollution (Figure 5.7). Similarly, the mouth of the Saguenay River is characterized primarily by high shipping pressure (Figure 5.4) that overlaps with a significant diversity of marine mammals (Figure 5.7); in addition, there are several habitats and sites of importance, as well as more ad hoc stressors such as spills, anchorage sites, and commercial fishing (Figures 5.4 and 5.7).

Figure 5.8: Distribution of the cumulative exposure of valued components to environmental stressors in the study area.
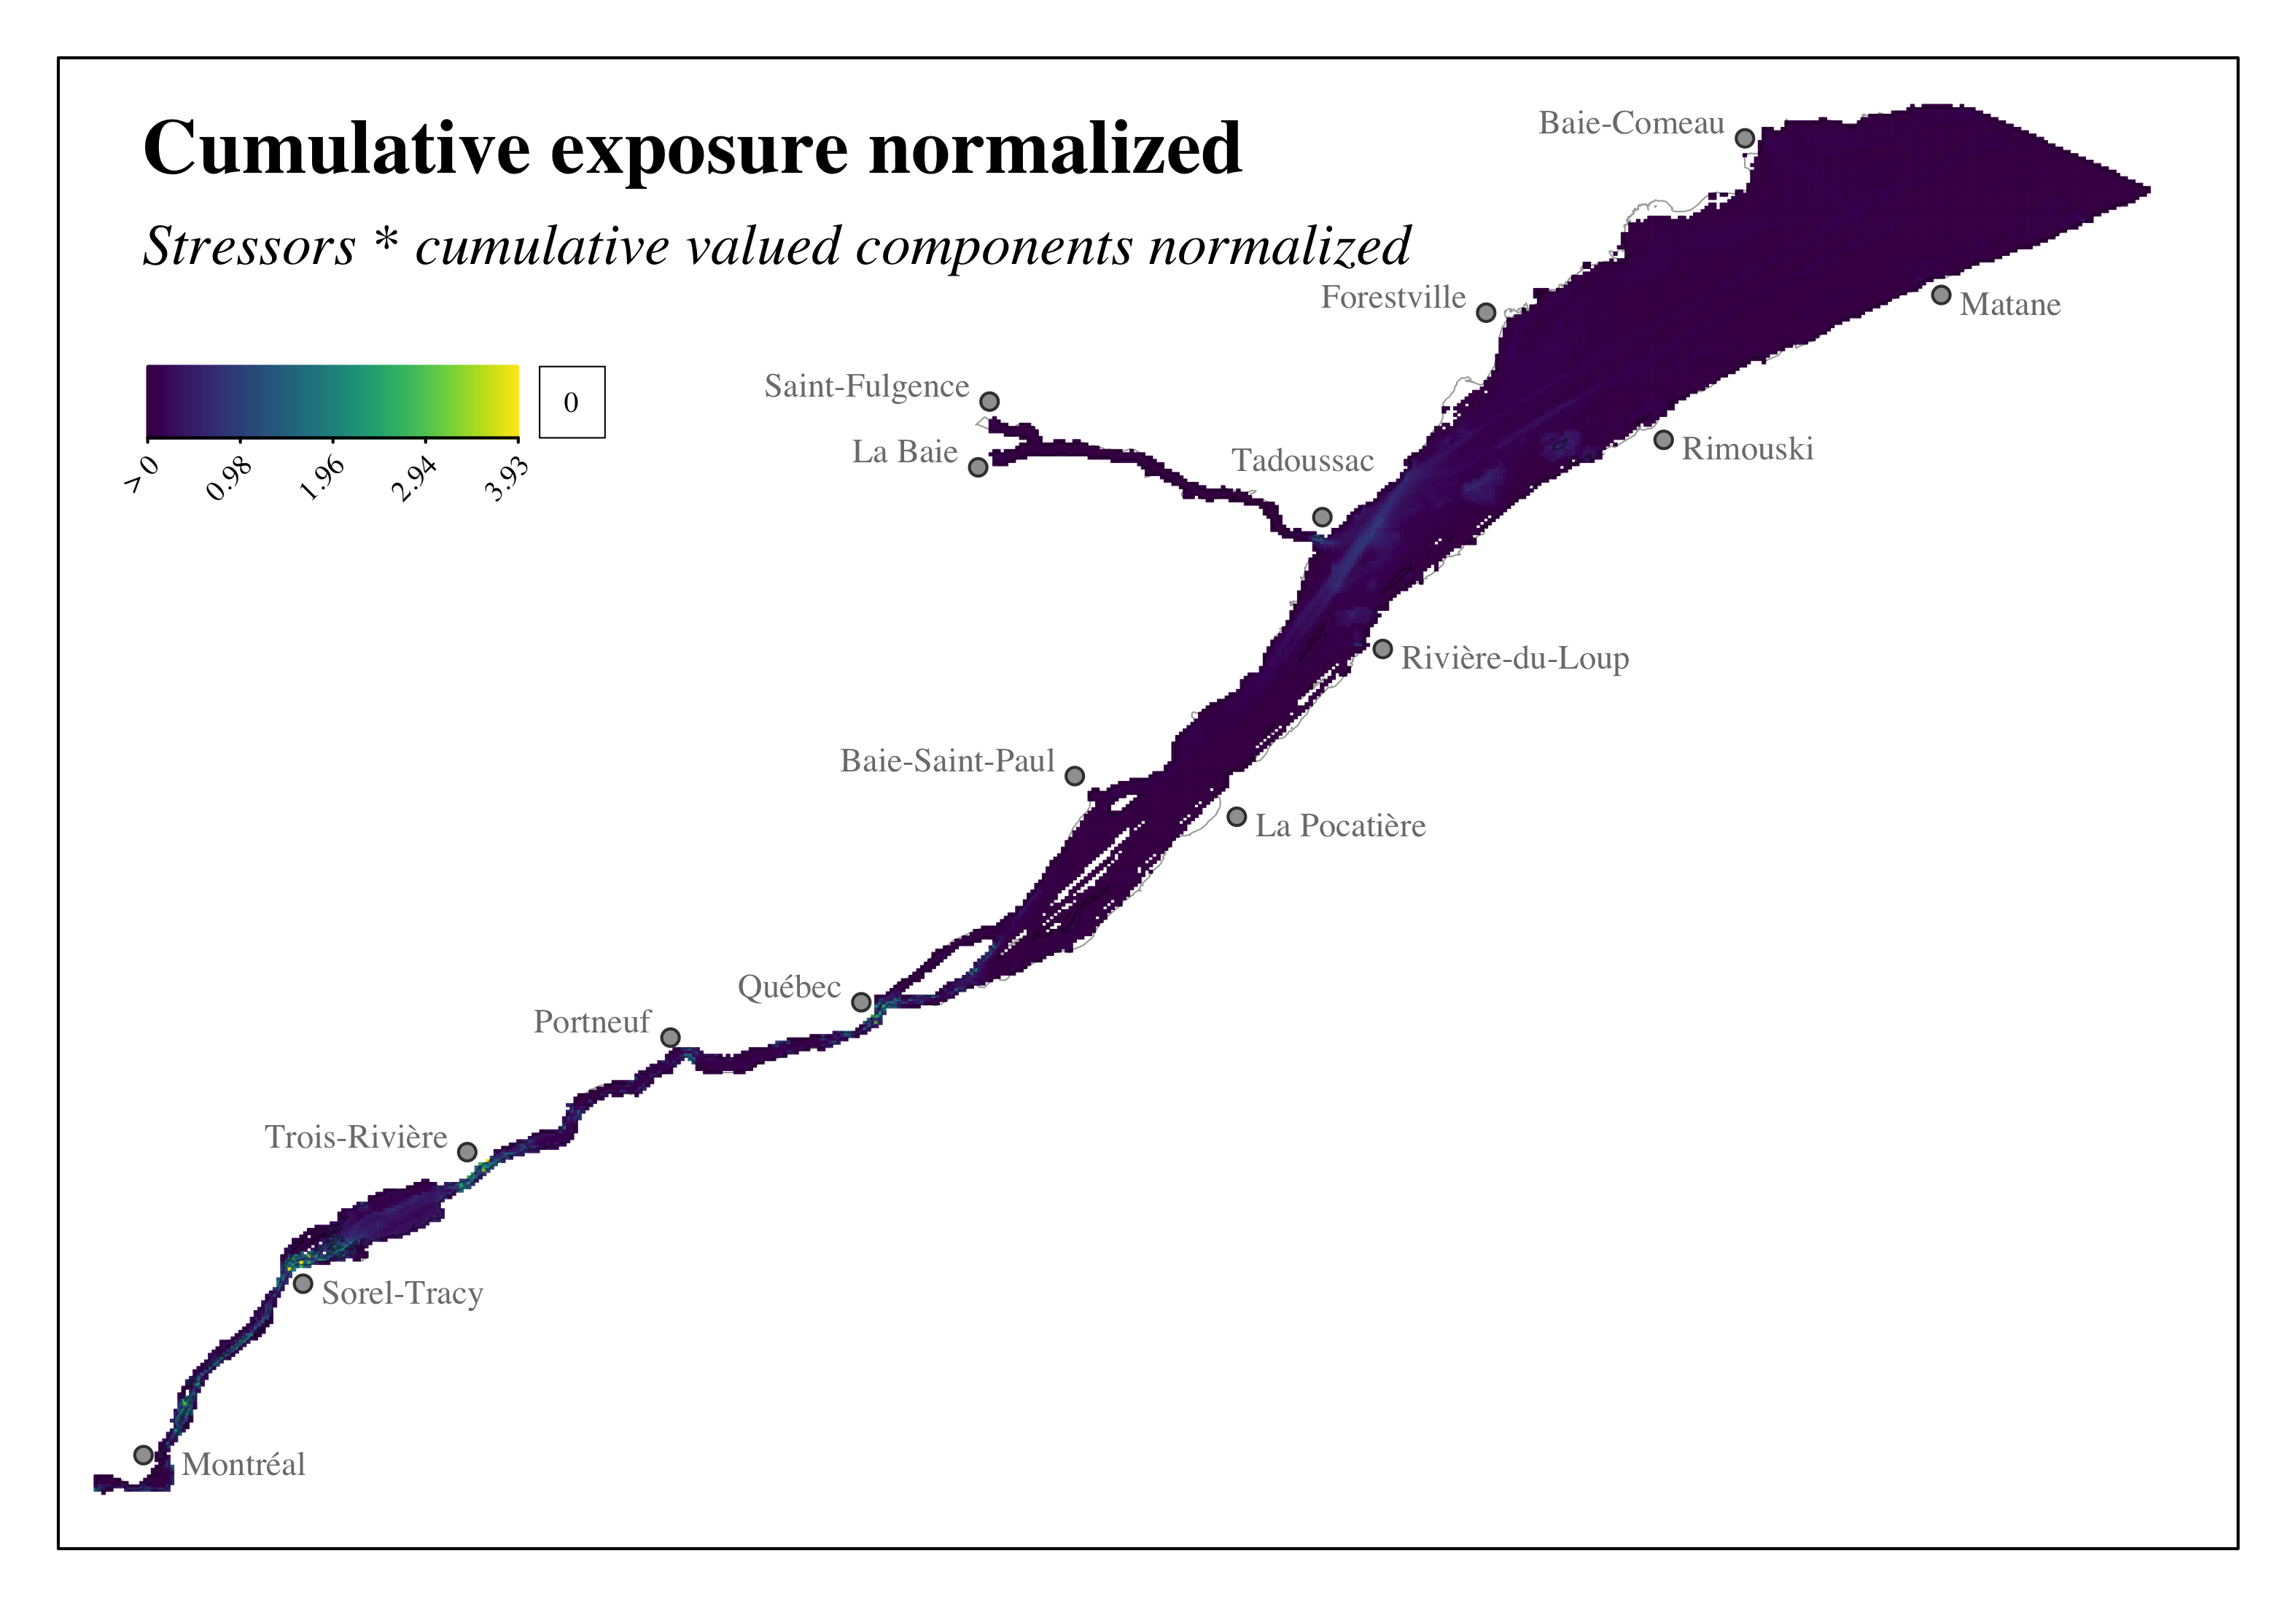
Figure 5.9: Distribution of the normalized cumulative exposure of valued components to environmental stressors in the study area.
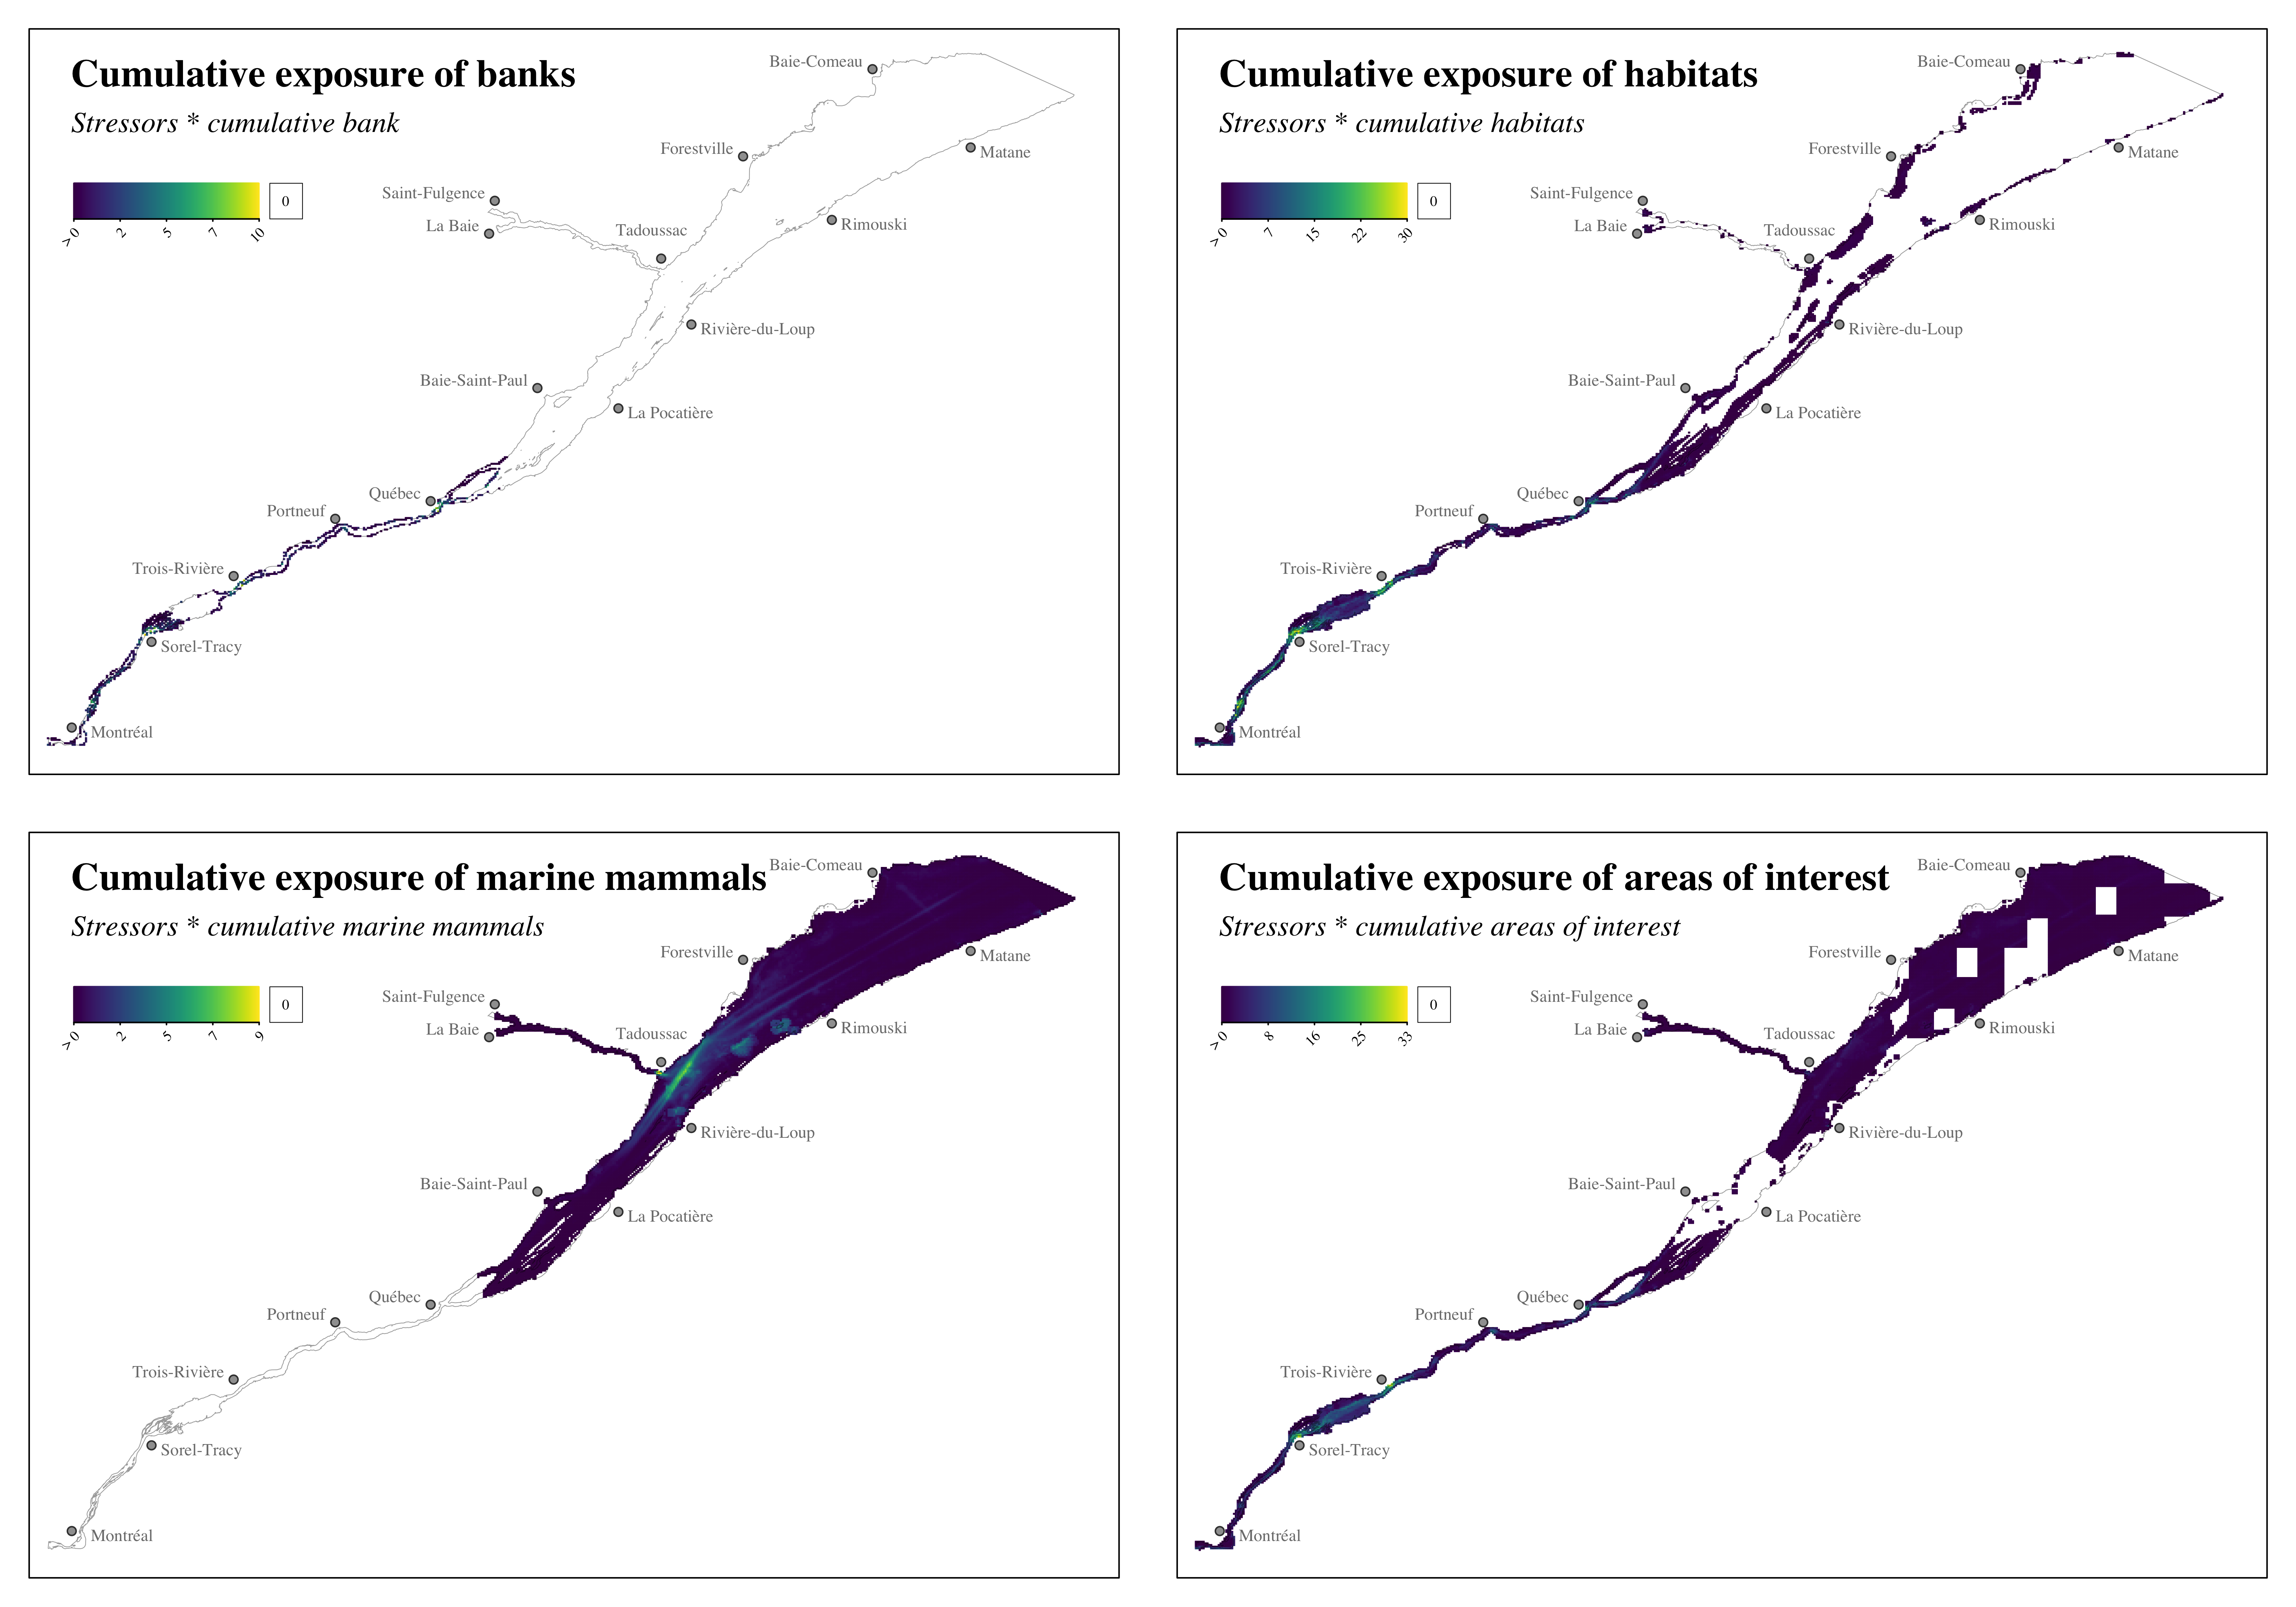
Figure 5.10: Distribution of the cumulative exposure of valued components to environmental stressors in the study area for each category of valued component.
5.4 Cumulative effects
The method used to obtain the following results is presented in section 3.2.1 of the report.
The main result of the assessment applies the overall cumulative effects assessment model by including the distribution and intensity of environmental stressors, the distribution of valued components, and the vulnerability of valued components to environmental stressors. The presentation of the results of the overall model has thus already been initiated by exploring the results of the partial models (see sections 5.1, 5.2 and 5.3). By including the vulnerability of valued components to the environmental stressors, the overall model allows for modulation of the intensity of the predicted cumulative effects; thus, the distribution of cumulative effects may be similar to that of cumulative exposure, but the relative intensity of the predicted effects may be greater or lesser depending on the vulnerability of the valued components (see section 3.2 for more details).
The results of the cumulative effects assessment reveal that the environments most affected by environmental stressors are similar to those identified by the cumulative exposure assessment (Figures 5.8 and 5.11); a similar interpretation can therefore be made regarding the spatial distribution of cumulative effects. The valued components are at risk for cumulative effects of marine activity-related environmental stressors throughout the study area. The environments most at risk from cumulative effects of marine vessel activities are those with a greater overlap of valued components (Figure 5.5) and environmental stressors (Figure 5.1).
Within the fluvial sector, the Quebec City and southern Île d’Orléans regions, as well as the entire shipping channel between Trois-Rivières and Montreal, including Lake St. Pierre, are particularly at risk; the mouth of the Saguenay River is the marine sector region most affected by stressors related to marine vessel activities (Figure 5.11 and 5.12). In terms of valued components, these environments display a significant diversity of habitats and areas of interest, as well as areas where bank integrity is at risk from marine vessel activities throughout (Figure 5.12 and 5.7). These environments are also subject to a wide variety of high-intensity environmental stressors (Figure 5.4)
Within the marine sector, predicted cumulative effects are broadly distributed at low intensity (Figure 5.11). Only the mouth of the Saguenay River shows more intense cumulative effects (Figure 5.11) which are largely dictated by the effects of shipping on marine mammals that frequent this region of the study area (Figure 5.12). In addition to marine mammals, several areas of interest were also identified in this region (Figure 5.12).
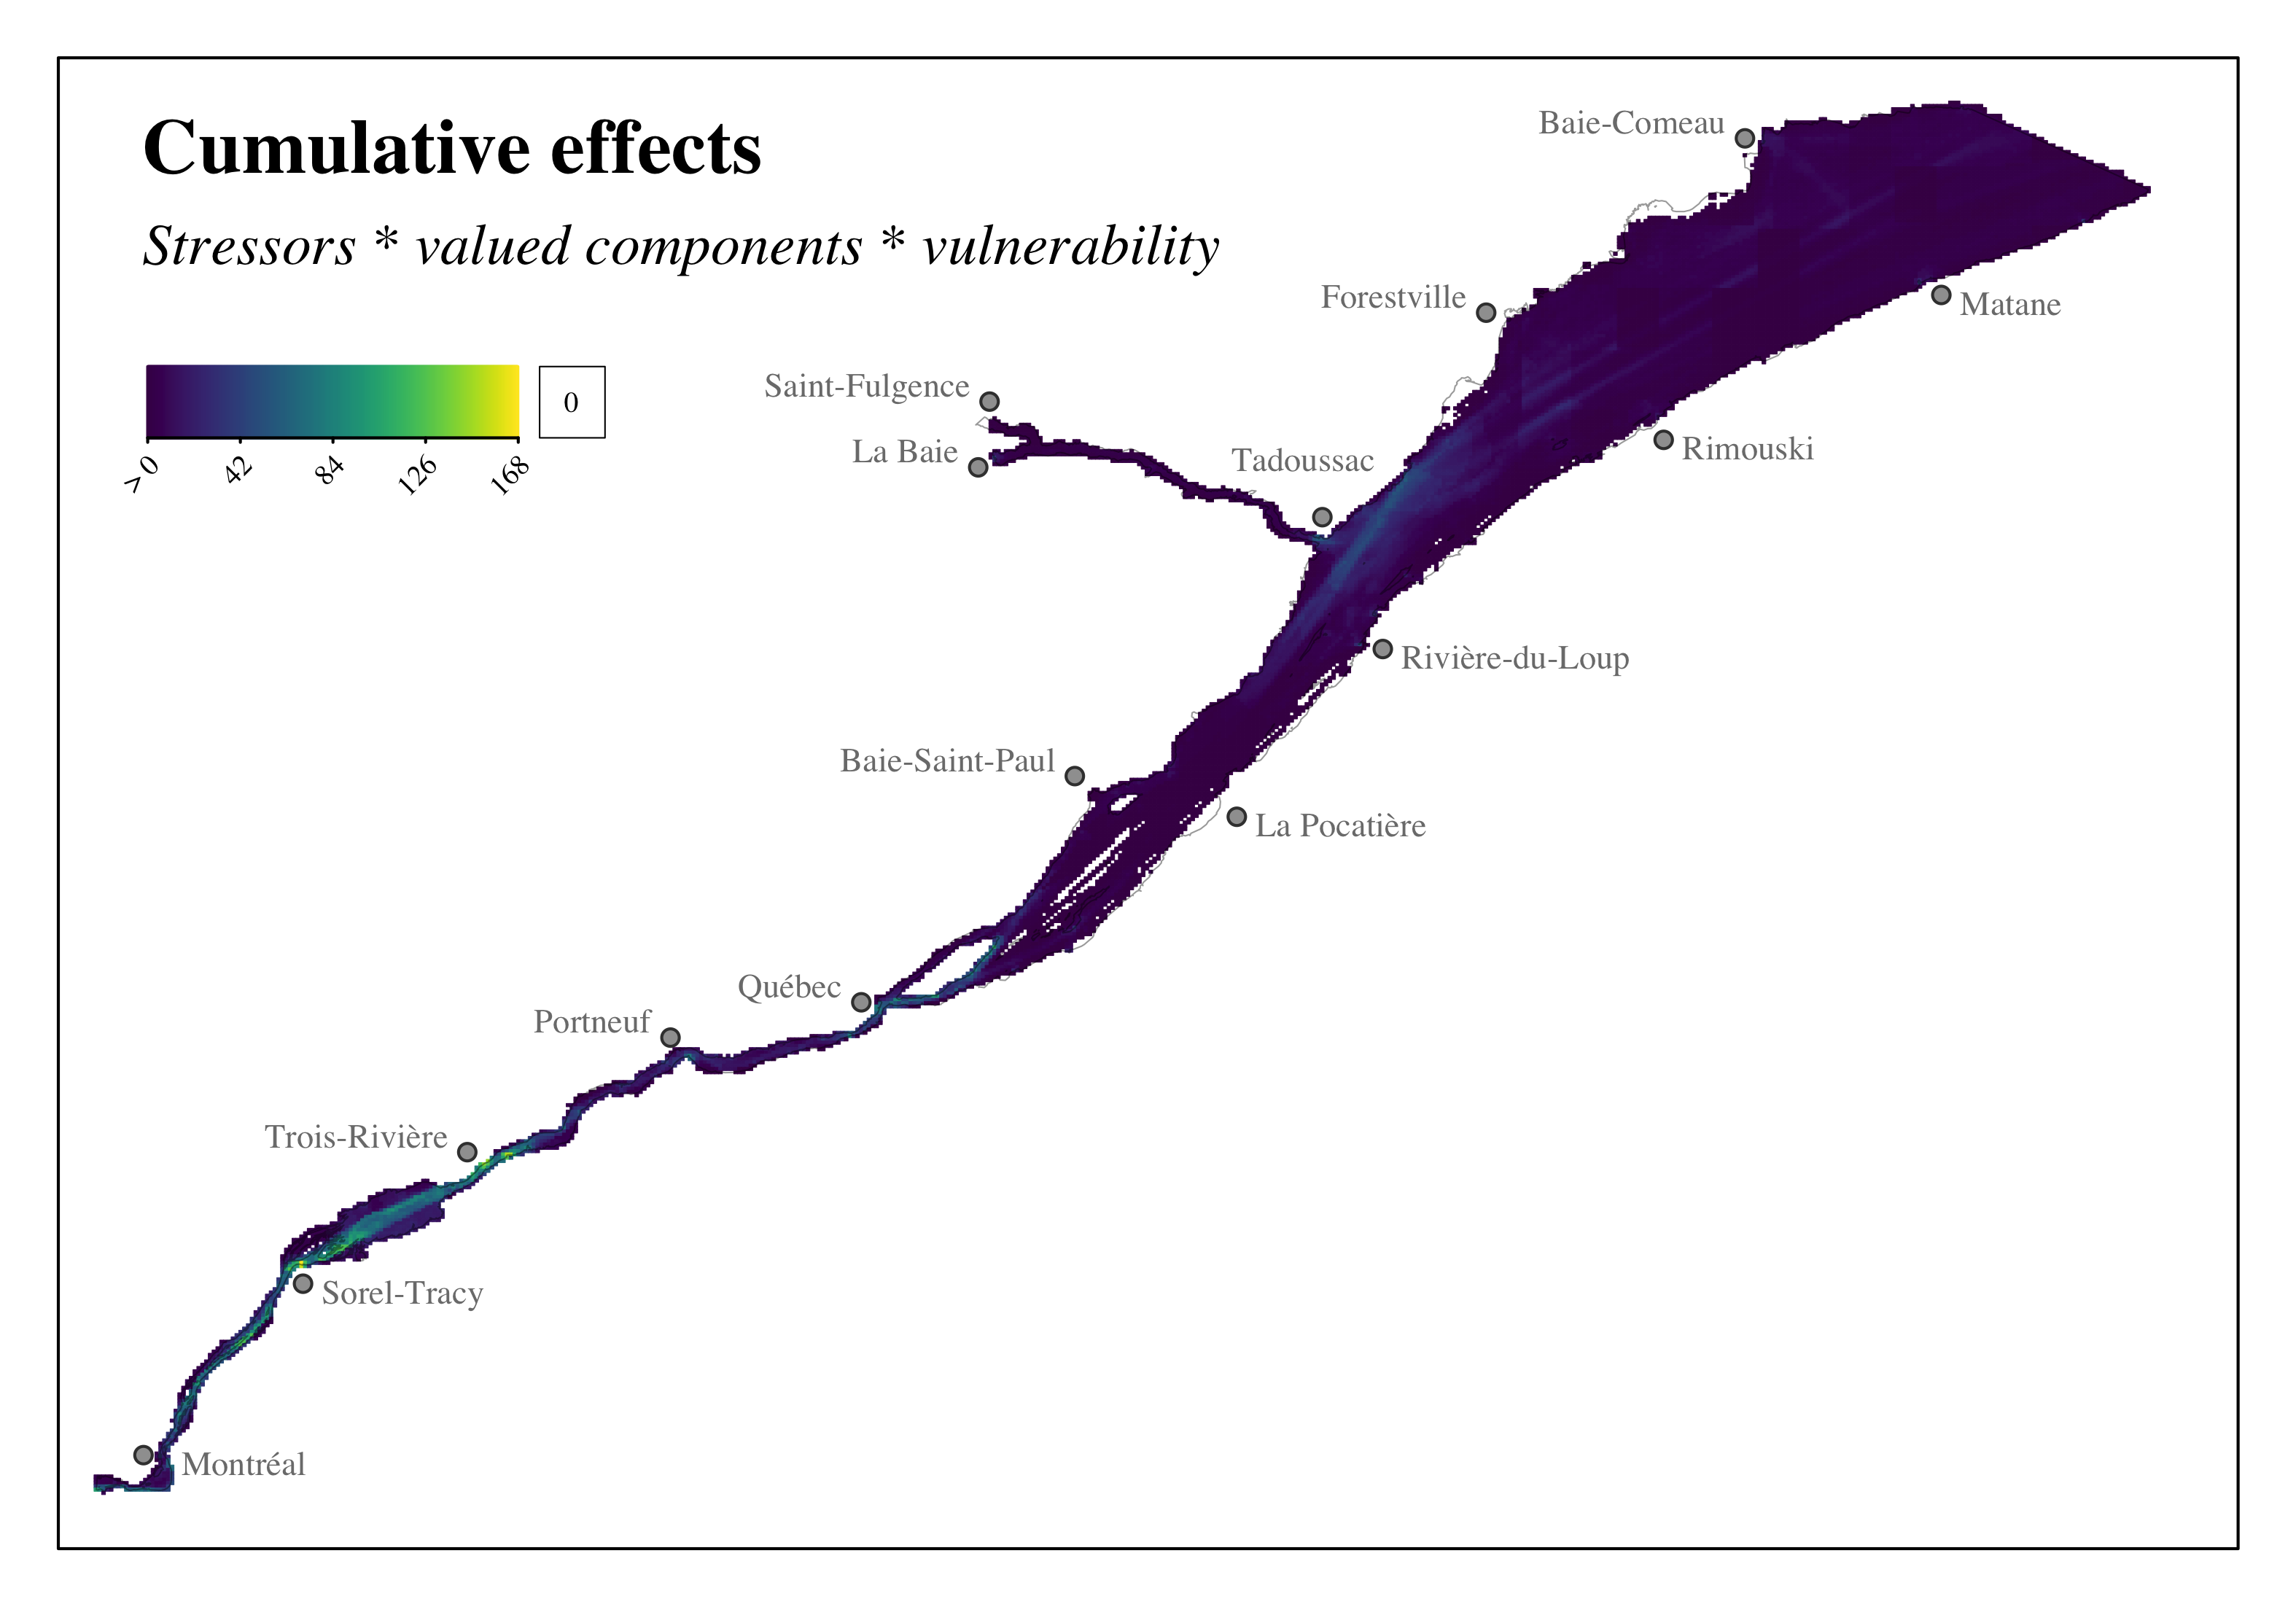
Figure 5.11: Distribution of the cumulative effects of environmental stressors on valued components in the study area.
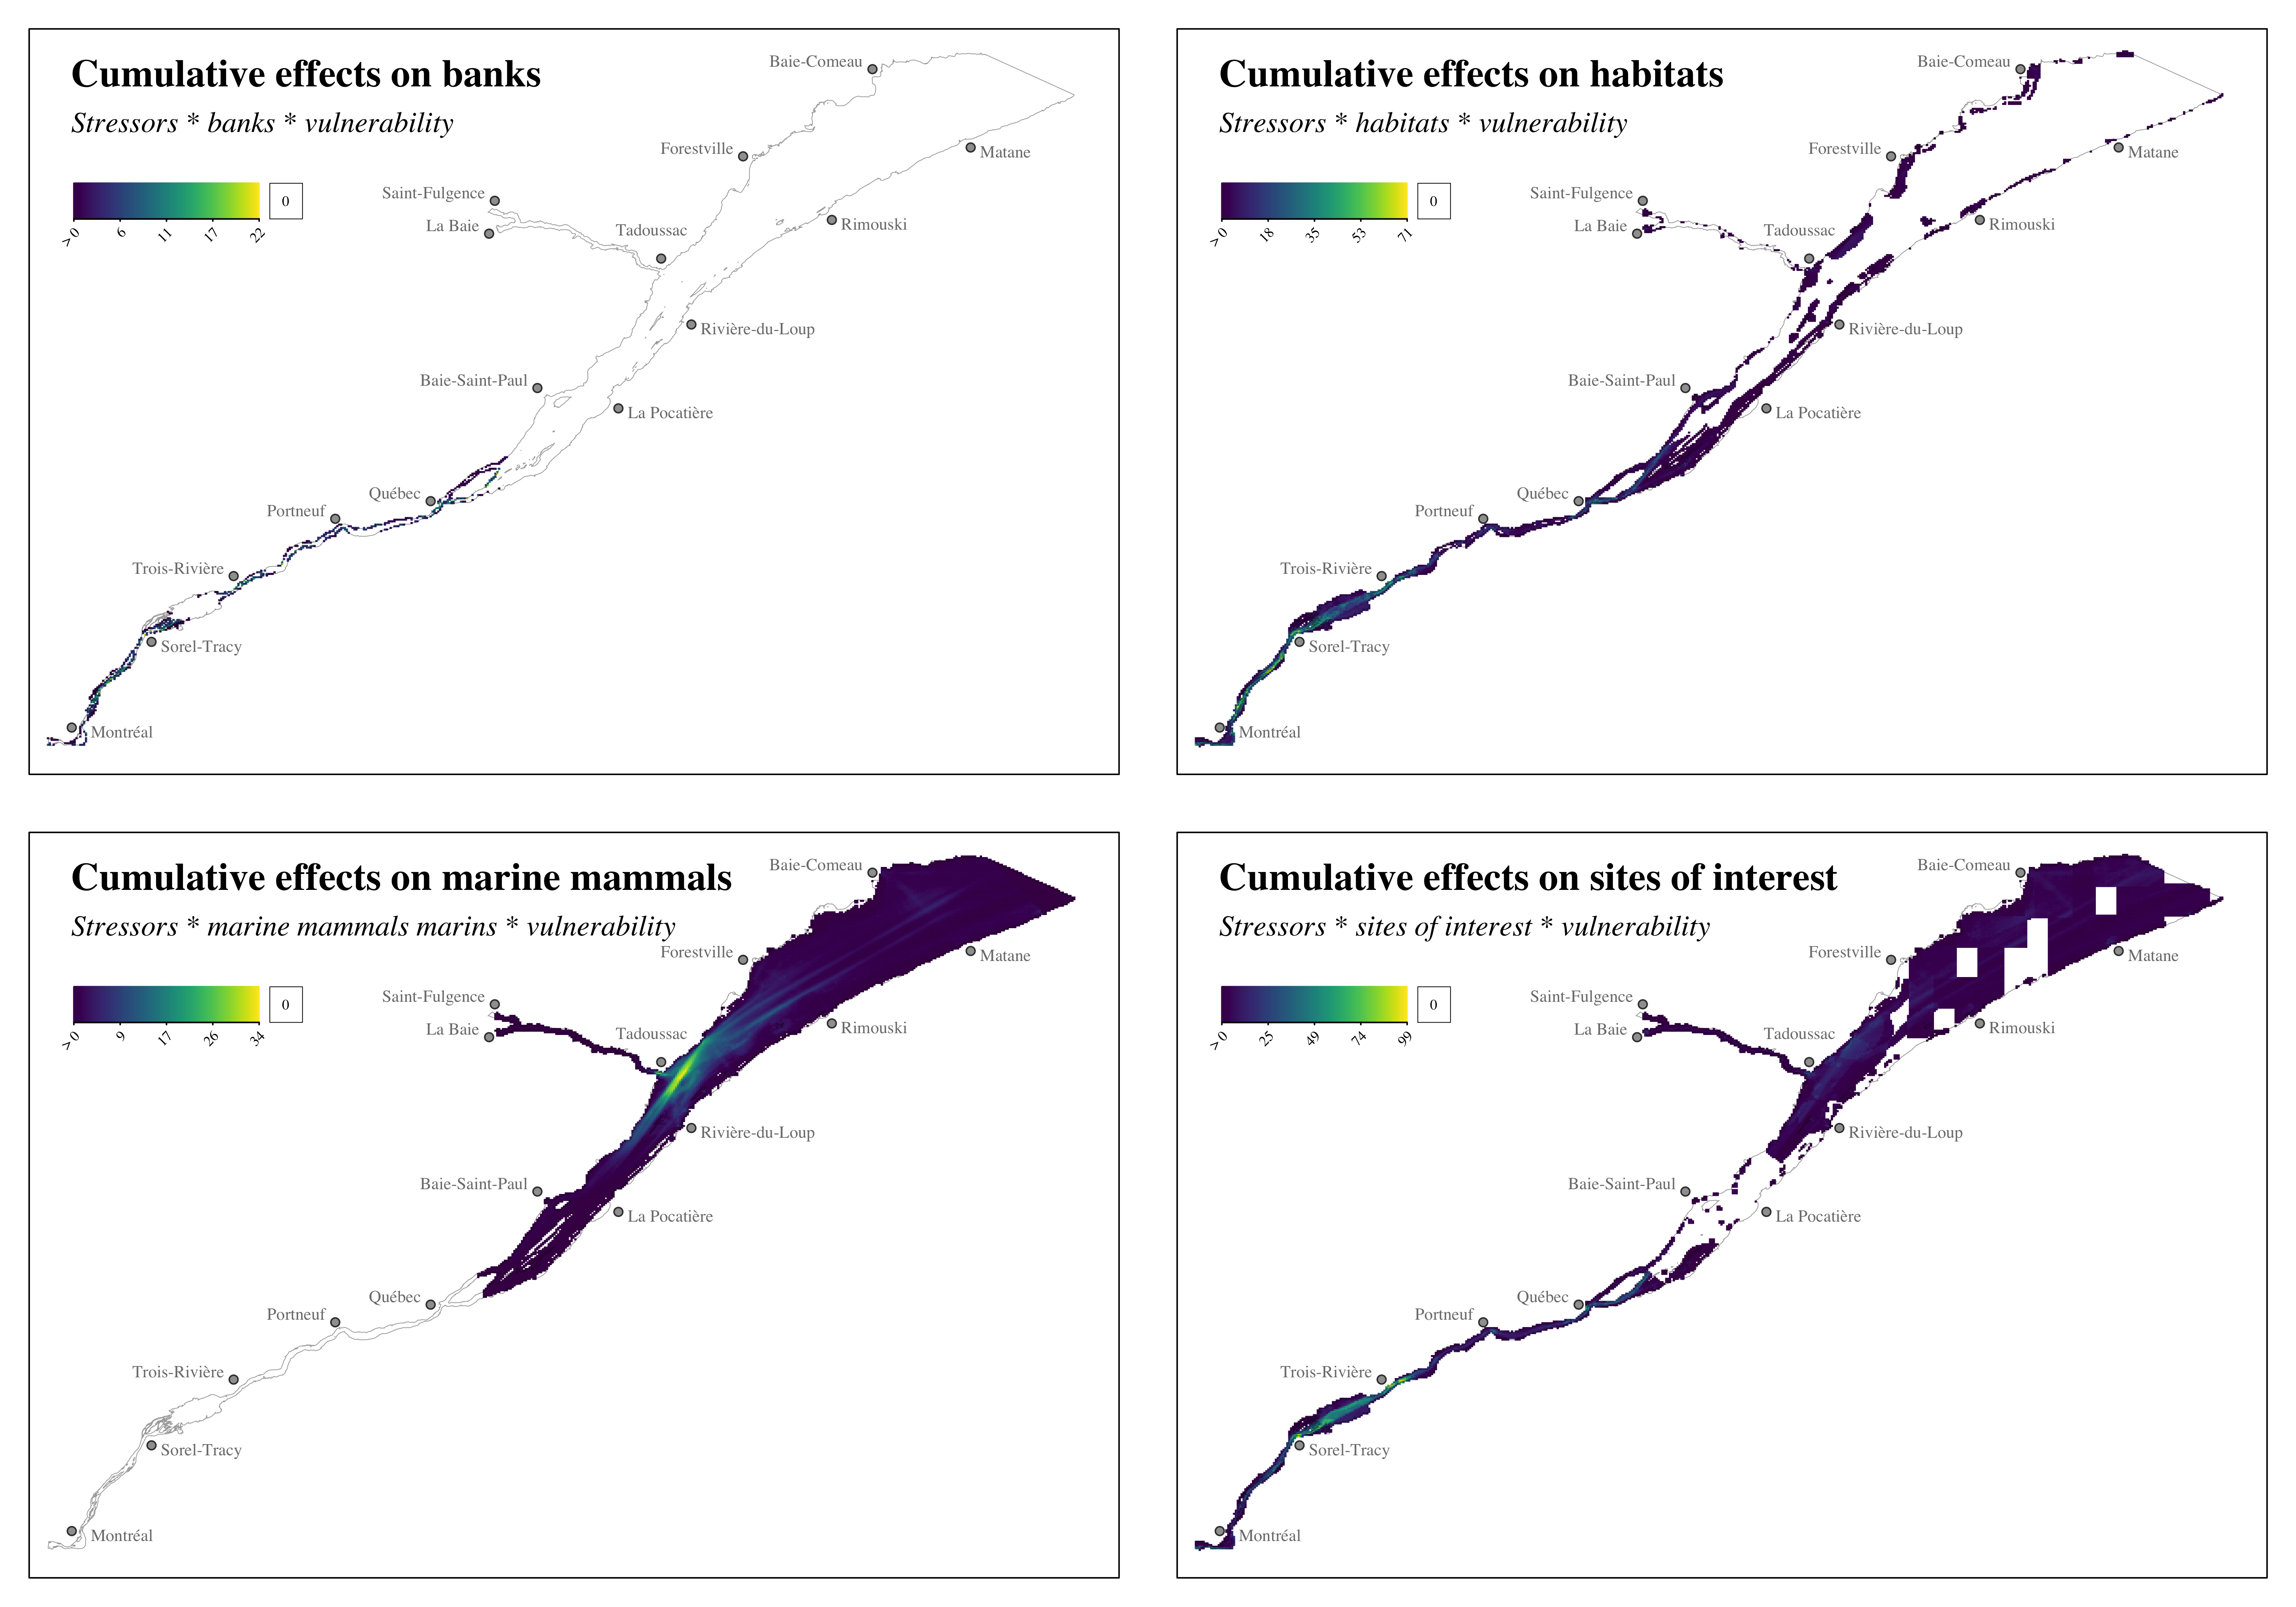
Figure 5.12: Distribution of the cumulative effects of environmental stressors on bank integrity, habitats, marine mammals et sites of cultural, heritage and archeoliglca interest in the study area.
5.5 Pathways of effect
The proposed cumulative effects assessment theoretically allows for the exploration of all combinations of stressors and valued components included in the assessment. Considering the 26 categories of stressors and the 83 categories of valued components, there are nearly 2,000 possible pairs; these pairs form the set of direct pathways of effect that environmental stressors can take to affect valued components. A pathway of effect links activities to their potential impacts on various aspects of the ecosystem (DFO, 2020).
Although we cannot explore all of these area of interest within this report, Figures 5.13 and 5.14 provide a visual representation of all of these combinations and the contribution of stressors to the total cumulative effects predicted for each valued component considered. The total effects of environmental stressors on valued components were assessed by the sum of the effects divided by the total area of the valued component on which an effect is predicted. For example, if a habitat with an area of 2 \(km^2\) is affected by two stressors with predicted effects of 0.25 and 0.75, respectively, the total effect on the valued component is 0.5 \(km^{-2}\). The greater the spatial distribution of a stressor, the greater its total effect is likely to be; similarly, total effects are likely to be greater the less widely distributed a valued component is.
The figure 5.13 visualizes the set of predicted direct area of interest within the cumulative effects assessment. The links represent the presence of a predicted effect of a stressor on a valued component. The size of the points represents the total predicted effects on the valued components or originating from the environmental stressors. It is important to note that this figure should not be interpreted in detail; rather, it provides an at-a-glance view of the amount of information available within the cumulative effects assessment conducted. There are 1531 direct area of interest with an average relative effect of 0.11 \(\pm\) 0.15, considering that the maximum possible relative effect is 1 based on our assessment method.
Figure 5.14 complements Figure 5.13 and makes it possible to explore the area of interest in more detail by presenting the relative contribution of each stressor to the predicted effects for each valued component. The significant effects of shipping and marine pollution on all valued components considered are noted. These results are expected since these stressors are the most prevalent among those considered for the assessment. Commercial fisheries affect certain valued component categories more intensively, such as many sites of interest, habitats of the fluvial sector and mollusk beds in the marine sector. Commercial fisheries in the fluvial sector seem to have a greater global effect than that of commercial fisheries in the marine sector, likely due to the smaller spatial extent of the fluvial sector compared to that of the marine sector. In general, the other environmental stressors have smaller total effects, except for commercial fisheries, which affect some categories of valued components more intensely, such as mollusk beds and some cultural, heritage and archeological areas of interest. The lower total effects can be explained by the more ad hoc distribution of other environmental stressors within the study area.
Cultural, heritage, and archeological areas of interest are the most exposed to the effects of marine activity-related stressors. It should be noted, however, that all areas of interest were considered vulnerable to all environmental stressors; as such, a spatial overlap between a stressor and an area of interest was sufficient to identify a pathway of effect. This means that a comparison between total effects on areas of interest and other valued components should be avoided, or at least take into account the maximum vulnerability attributed to areas of interest. Nevertheless, this is an important result that is informative about the exposure of areas of interest to marine vessel activities in the study area.
In addition to areas of interest, bank integrity is the most affected valued component, primarily by shipping and to a lesser extent, by dredging activities. Total habitat effects vary by habitat type, although habitats are affected by a wide variety of environmental stressors.
Finally, the least affected valued component is marine mammals. However, it is important to remember that these species cover a very large area and accordingly, the assessment per \(km^2\) underestimates the predicted cumulative effects scores. An analysis specifically targeting the critical environments of these species would undoubtedly increase the total predicted effects on marine mammals. It is also important not to downplay the cumulative effects on marine mammals since one of the areas at greatest risk of cumulative effects from marine vessel activities is at the mouth of the Saguenay River due to the significant presence of marine mammals (Figures 5.11 and 5.12).
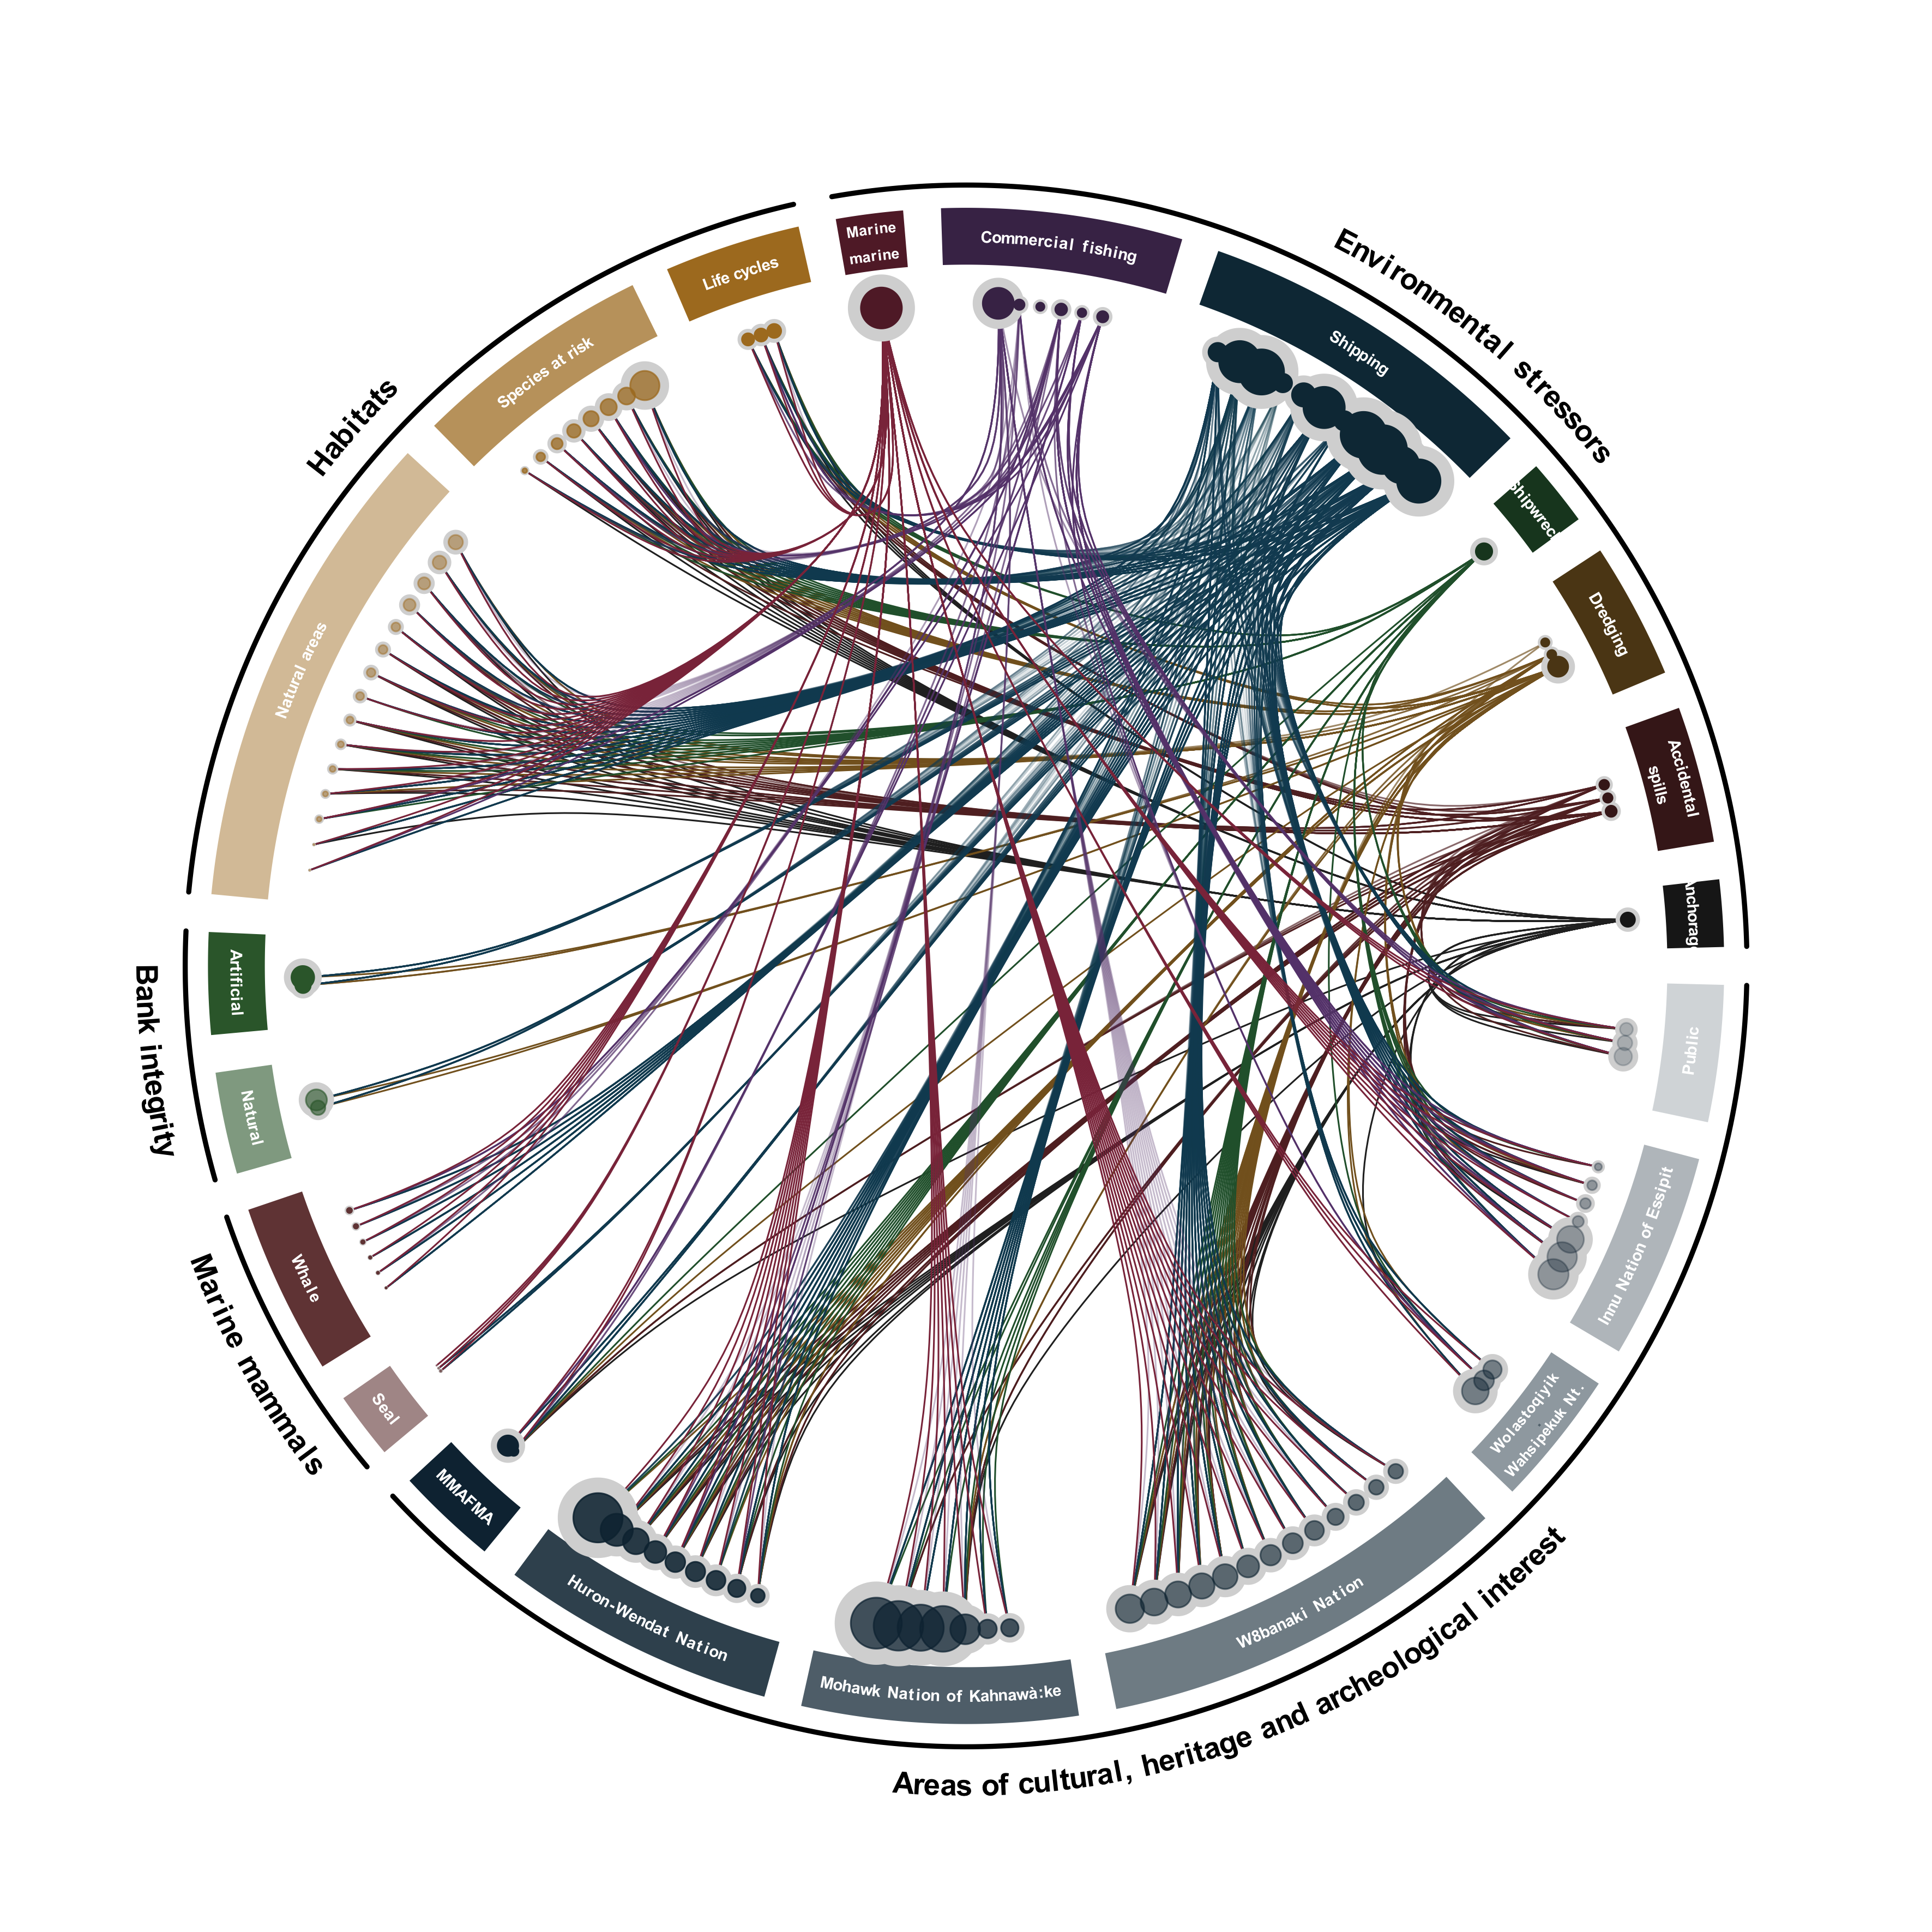
Figure 5.13: Multiplex network showcasing the presence of an effect of environmental stressors on each valued component included in the cumualtive effects assessment (i.e. colored links), total cumulative effects on each valued component (i.e. size of valued components points), et mean predicted cumulative effect of environmental stressors on all valued components (i.e. size of environmental stressors points). This visualization presents the quantity of information available in the dataset generated by the cumlative effects assessment.
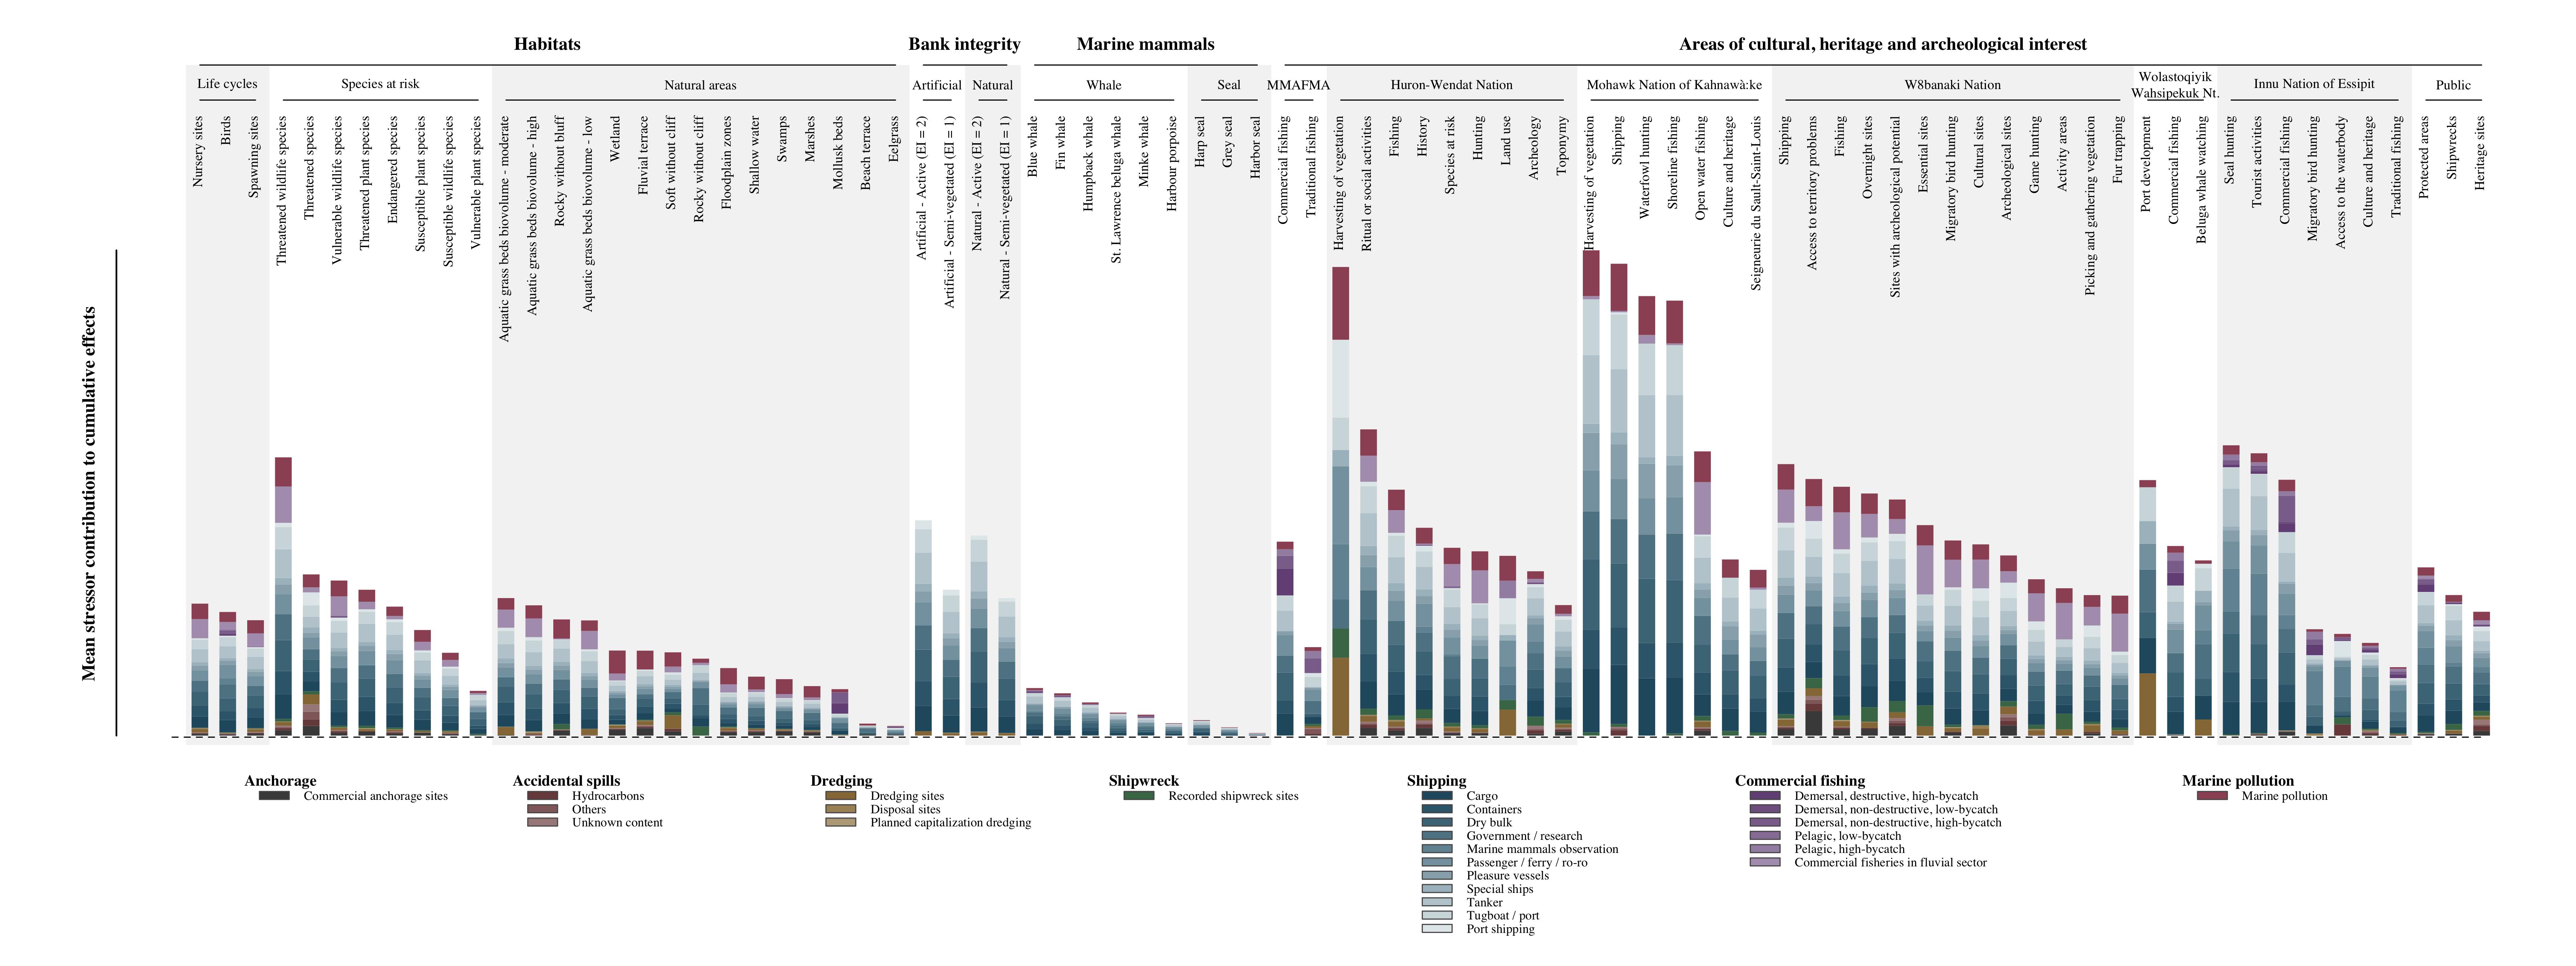
Figure 5.14: Mean contribution per \(km^2\) of environmental stressors to the cumulative effects on each valued component in the study area
5.6 Administrative regions
A cumulative effects assessment by \(km^2\) of the 11 administrative regions (Ministère de l’Énergie et des Ressources naturelles, 2021b) separating the study area was also conducted to explore regional differences in the intensity of the cumulative effects (Figures 5.15 and 5.16). The overall assessment combining all the valued components reveals that the administrative regions of the fluvial sector are much more at risk from the cumulative effects of marine vessel activities, while the marine sector seems less at risk. The Montérégie in particular seems to be the region most impacted by the effects of marine vessel activities. These observations are due to the concentration of marine vessel activities within a much narrower corridor within the fluvial sector compared to the marine sector. While this observation is not surprising, it does suggest that an increase in marine traffic in the marine sector may have disproportionate impacts in the fluvial sector if that traffic moves to the Great Lakes. This means that an additional vessel going through Quebec City cannot be interpreted in the same way as an additional vessel in Montreal. Commercial fisheries are also important is the fluvial sector, particularly for the Centre-du-Québec, Lanaudière and Mauricie regions. By extension to shipping, marine pollution is also an important stressor for the administrative regions of the fluvial sector. The types of vessels with the most significant effects are those related to the transport of goods (e.g. oil tankers, dry cargo, freighters and container ships). Government vessels also appear to have the potential to negatively affect the valued components in the study area, likely due to less constrained waterway routes and thus more widespread, lower intensity activities throughout the study area. The government and research shipping category, however, is composed of a significant diversity of vessel types, including military craft, patrol vessels, and scientific research vessels. This diversity increases the uncertainty with regard to how vulnerable the valued components are to this type of shipping, and accordingly, to the predicted effects.
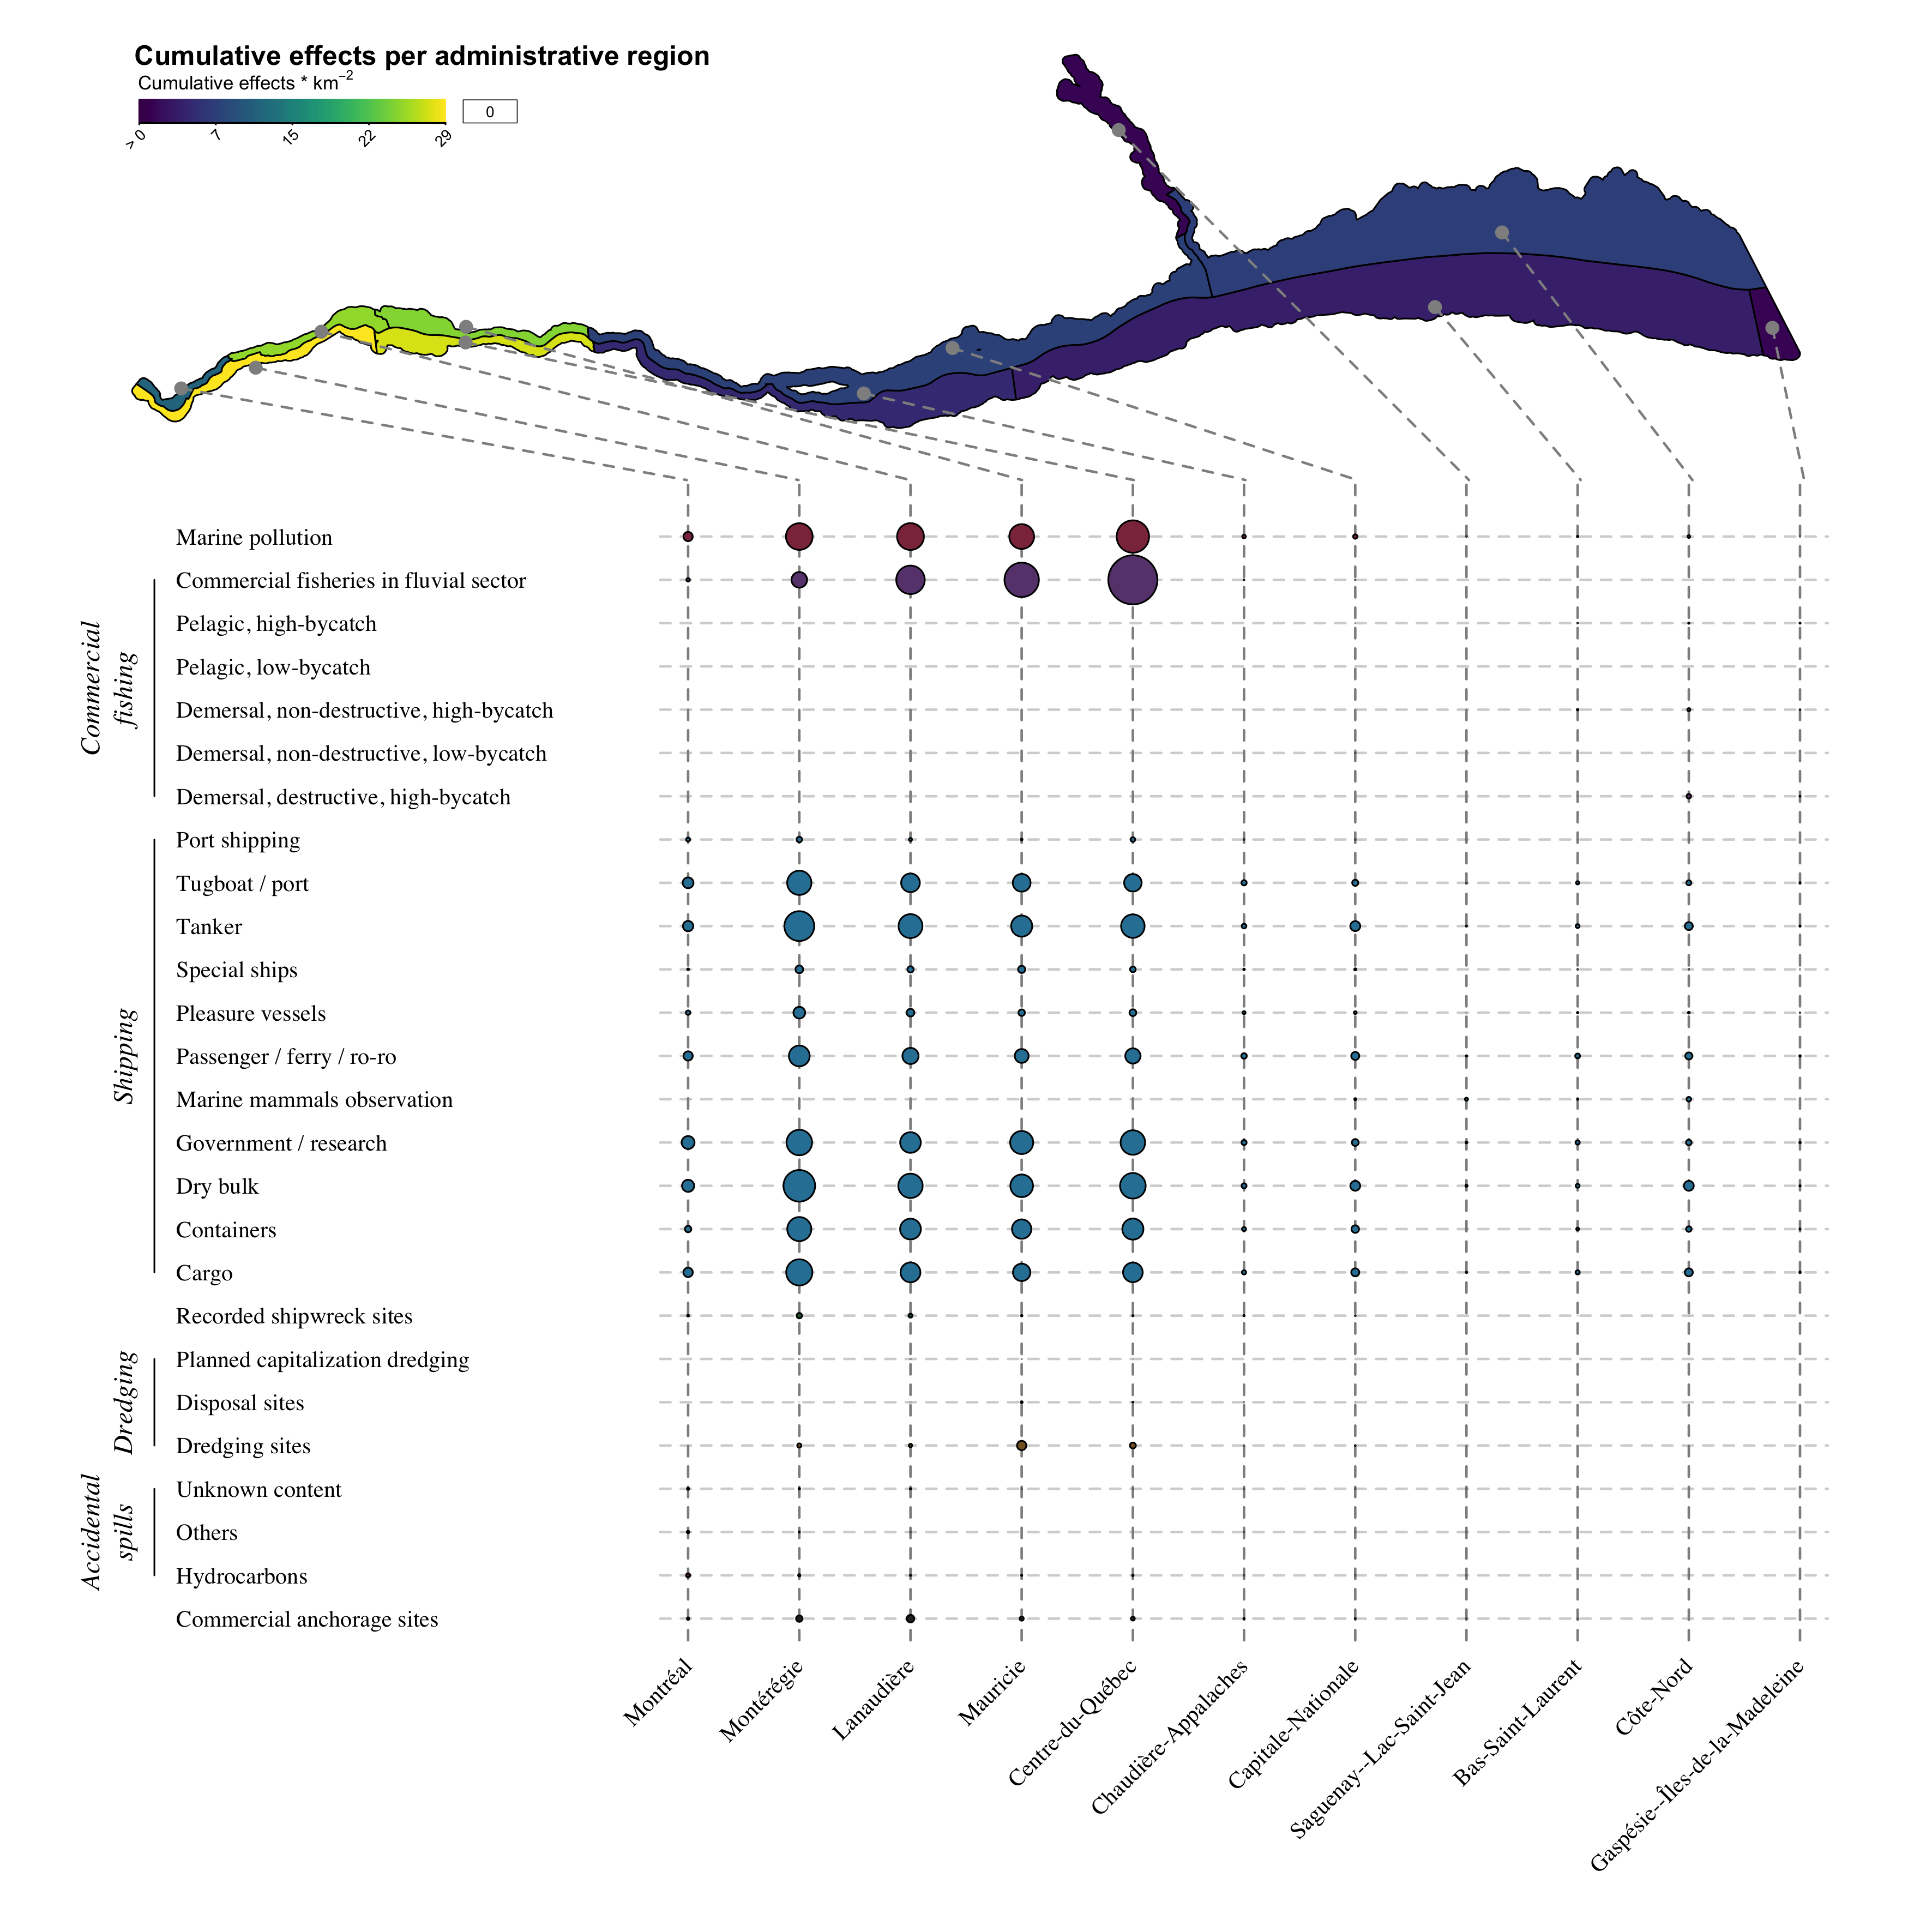
Figure 5.15: Mean contribution per \(km^2\) of environmental stressors to cumulative effects on valued components in provincial administrative regions of the study area.
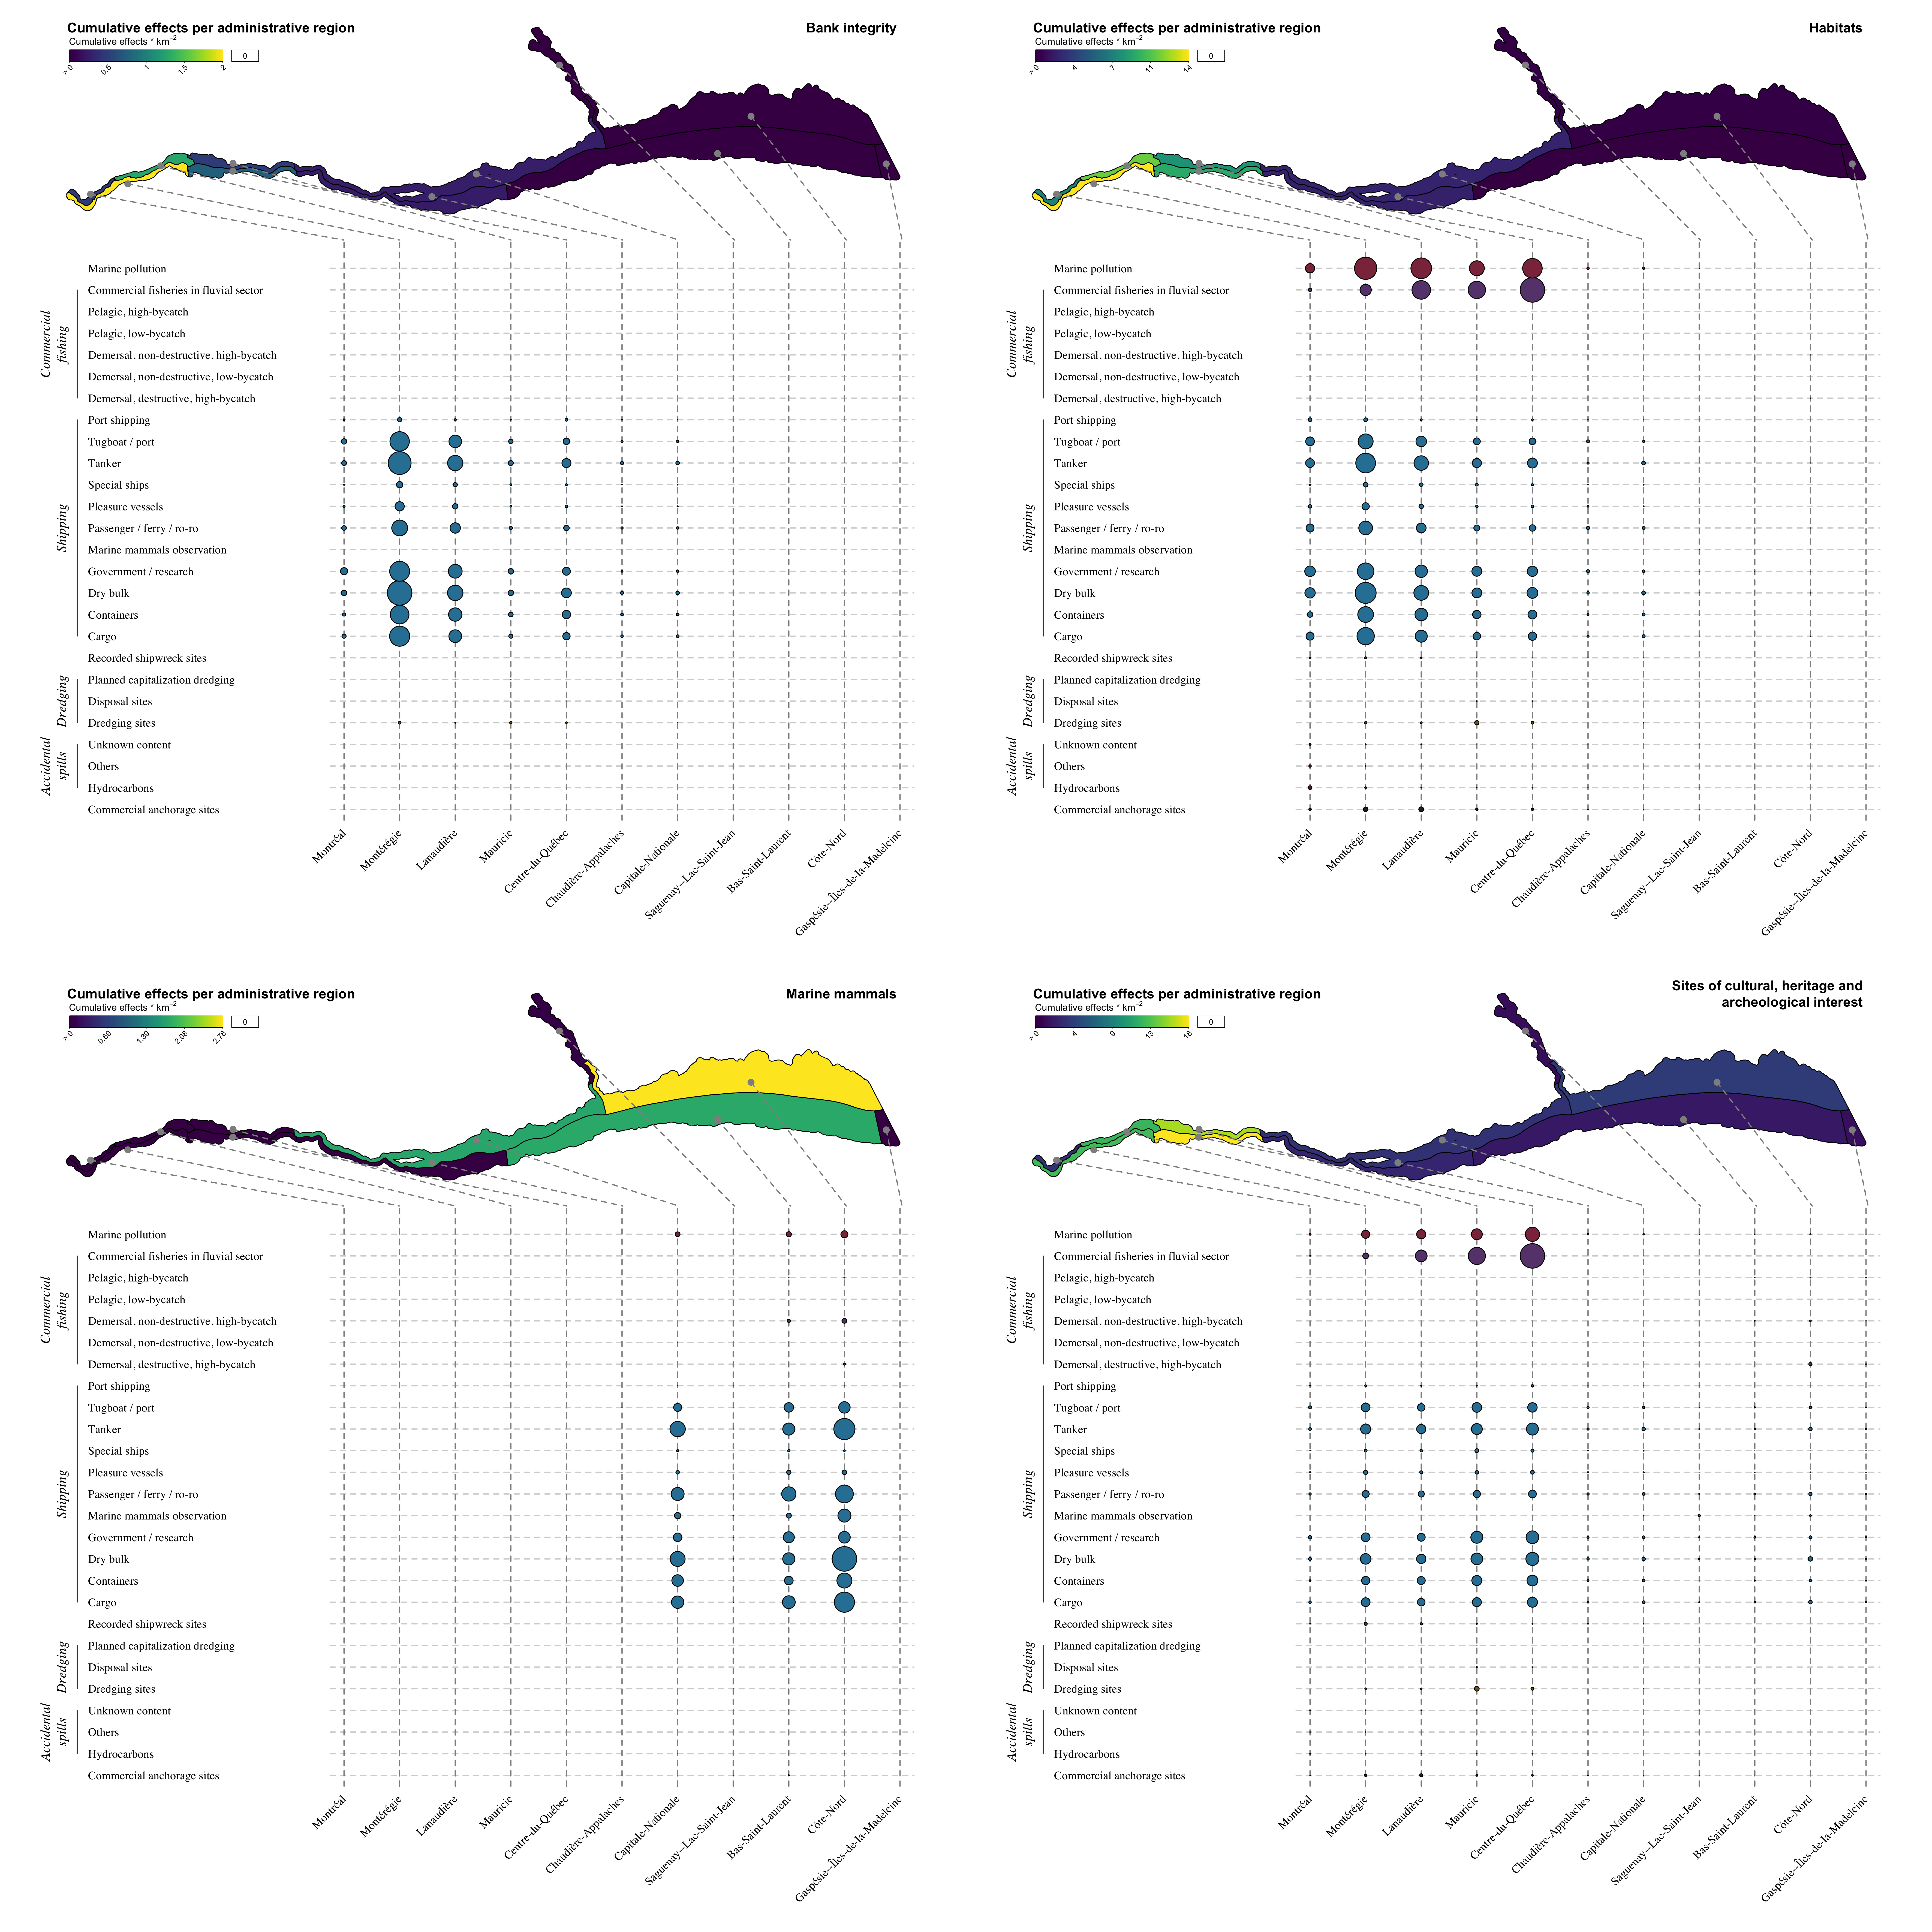
Figure 5.16: Mean contribution per \(km^2\) of environmental stressors to cumulative effects on bank integrity, habitats, marine mammals, and sites of cultural, heritage and archeological interest in the study area.